Tutorial: Measure & Optimize Your Coding Agents
What this suite gives you
Every time you use a coding agent (claude, opencode, copilot), the measurement suite can tell you what it cost, what it sent to the model, and whether a cheaper setup would do the same job. There are two ways to use it:
| Mode | Effort | You get | Use it when |
|---|---|---|---|
| Always-on measurement | Zero — it just runs | Per-session tokens, cost, timeline, and the exact context-window breakdown of every turn | You want to understand where your tokens go in normal work |
Experiments (/experiment) | One command | A ranked A/B table across models / agents / methods, gated by an objective test | You want a defensible decision: "which is cheapest for this job?" |
You don't choose one — always-on is passive and always there; you reach for experiments when you need a comparison. Everything shows up in the same place: http://localhost:3032 → Performance.
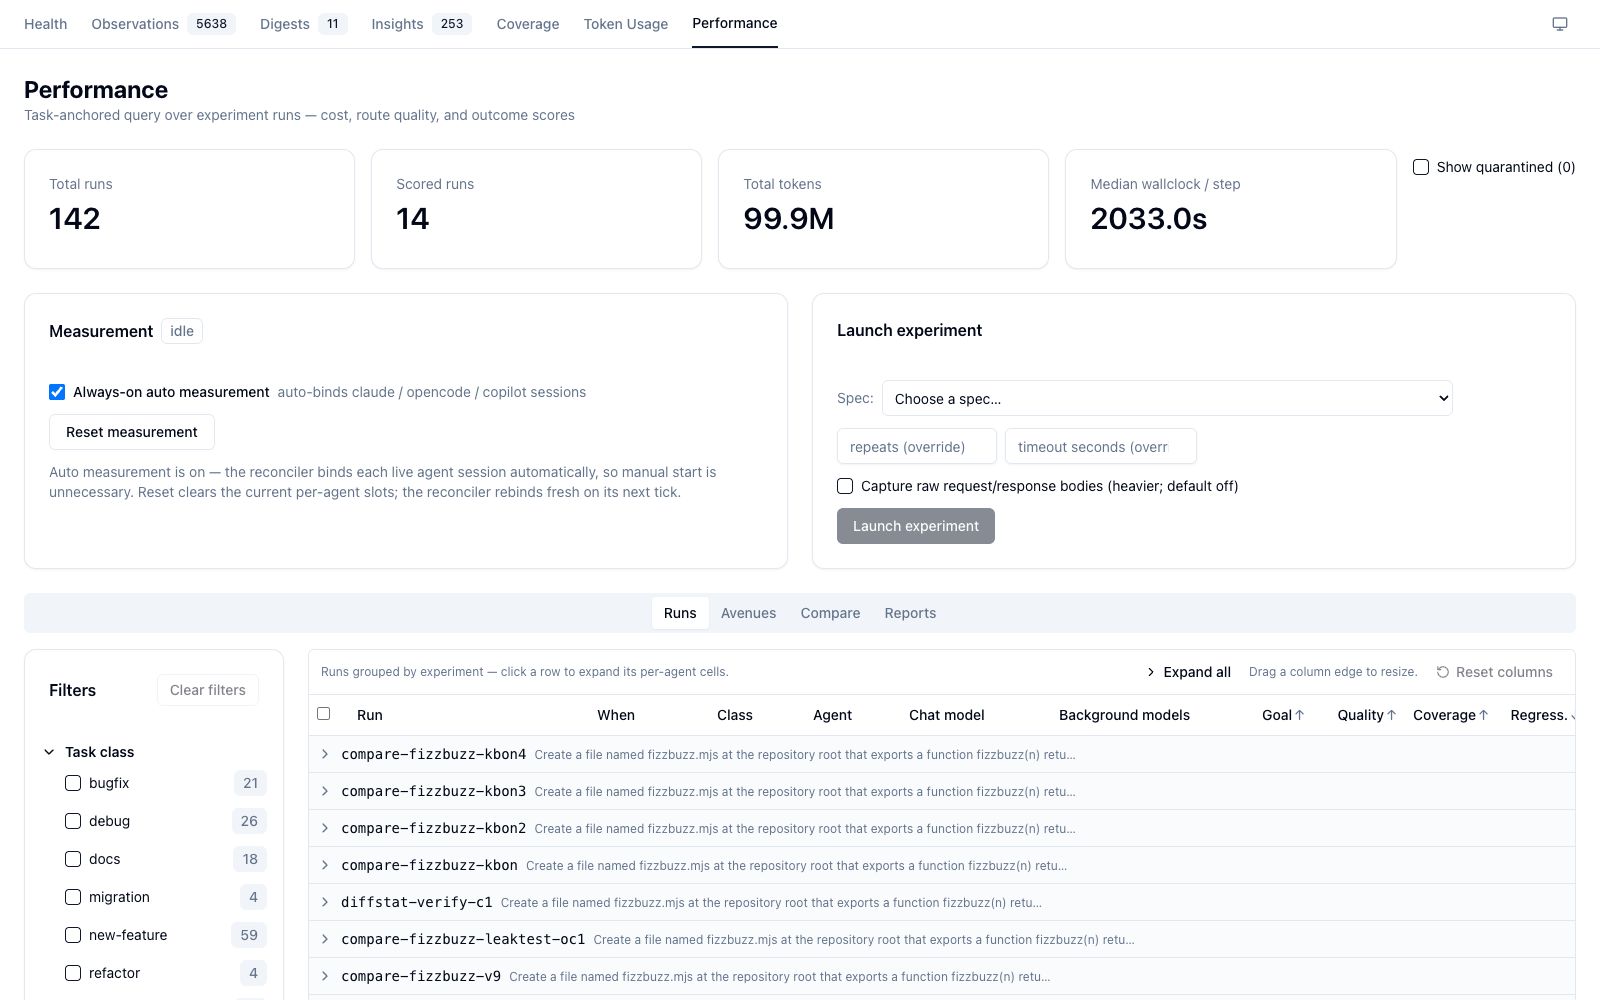
The four stat tiles (Total runs, Scored runs, Total tokens, Median wallclock/step) headline the page; the Show quarantined (N) toggle reveals runs hidden for an invalid task_class.
One-time setup — route through the proxy
Do this first, or you'll only see illustrative bands
Per-category capture (the real context-window breakdown) happens only for traffic that flows through the rapid-llm-proxy at localhost:12435. Agents using a direct provider (e.g. opencode's built-in github-copilot/*) bypass the proxy — you'll still get token totals, but the context-window band falls back to an illustrative placeholder.
In ~/.config/opencode/opencode.json, point your model at the rapid-proxy provider instead of a direct one:
{
  "model": "rapid-proxy/claude-sonnet-4.6",       // ✅ captured   (not github-copilot/…)
  "provider": {
    "rapid-proxy": {
      "options": { "baseURL": "http://localhost:12435/v1" },
      "models": {
        "claude-opus-4.8": {}, "claude-sonnet-4.6": {}, "claude-haiku-4.5": {},
        "gpt-4o": {}, "gpt-4o-mini": {}
      }
    }
  }
}
Config is read at launch, so start a fresh agent session after editing. Claude Code (via /v1/messages) is captured automatically — no change needed.
Path A — Just look at your work (zero effort)
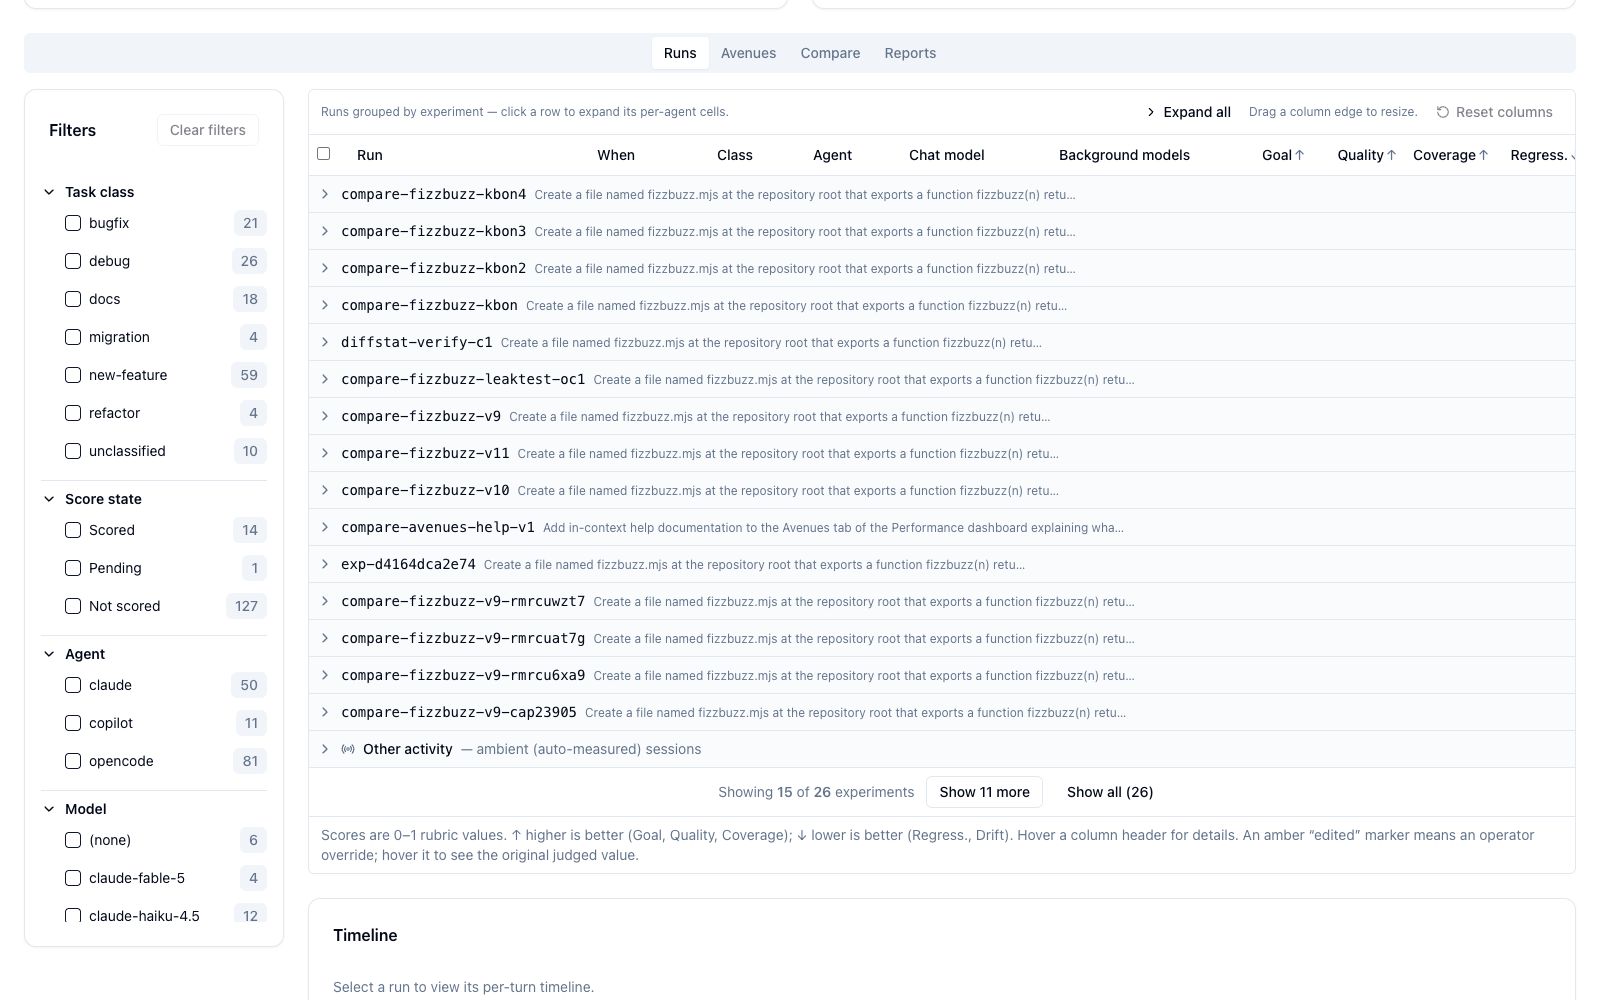
Do your normal coding. Then open Performance → Runs. Runs are grouped by experiment — one collapsible parent per experiment-run, plus a pinned "Other activity — ambient (auto-measured) sessions" bucket for your normal interactive work.
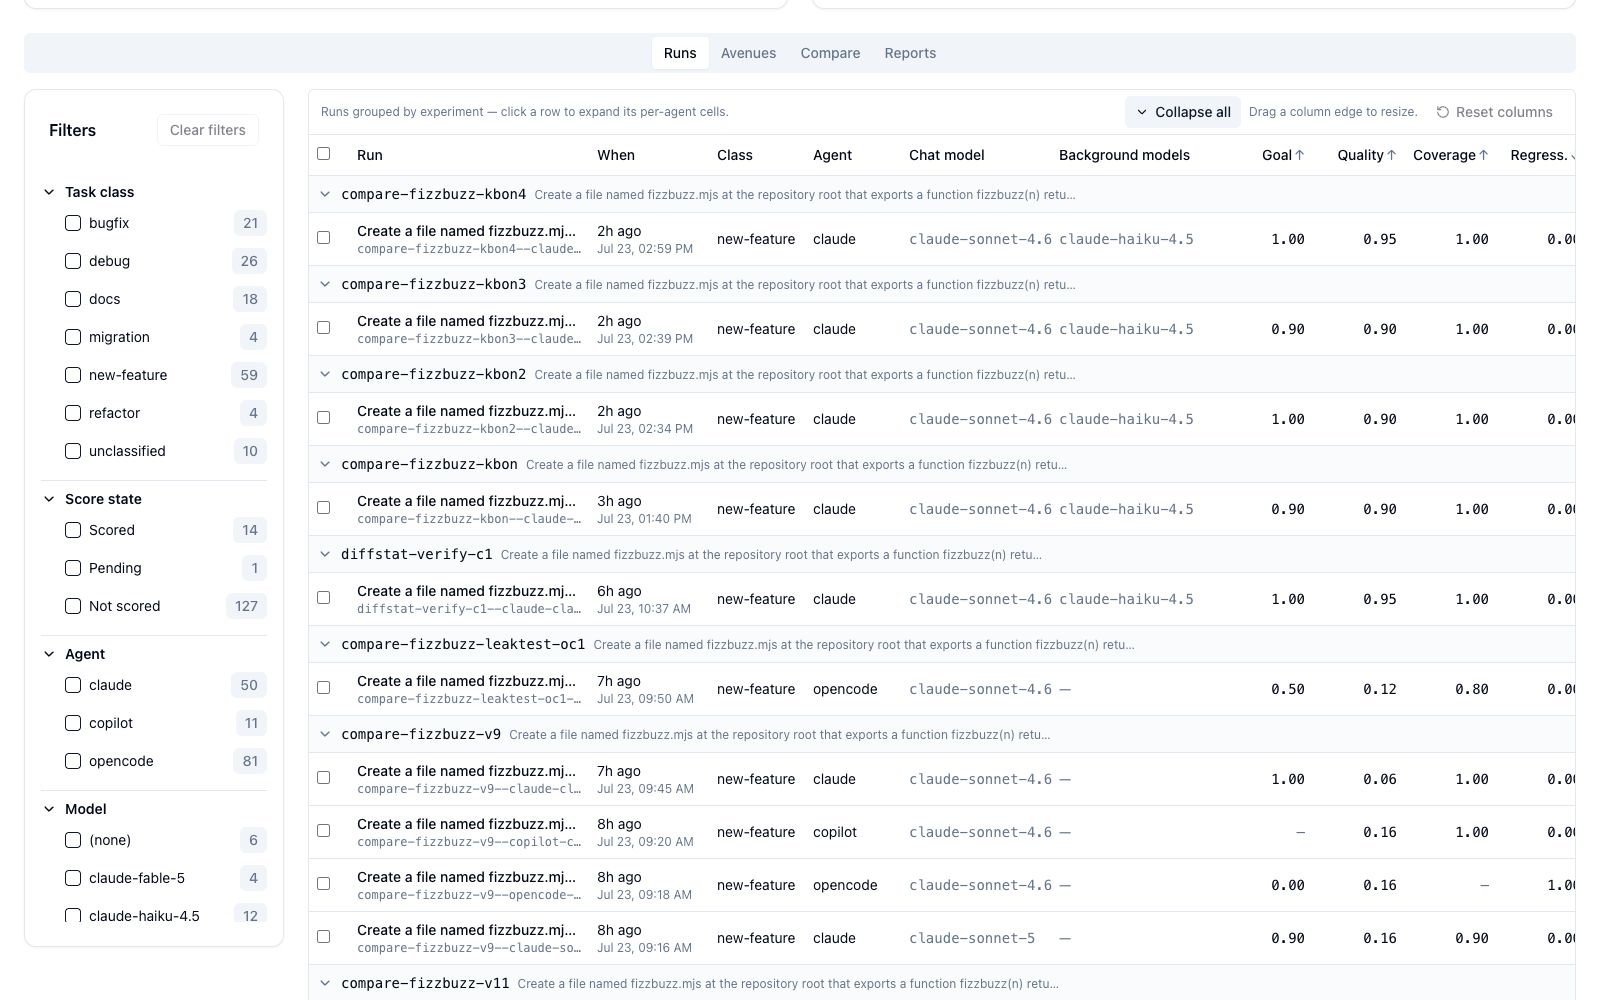
Expand all opens each parent into its per-agent cells, with the 5-dim rubric scores side by side — this is where a cross-agent spread jumps out (here claude scores 1.00 on Goal where opencode lands 0.00 on the same task):
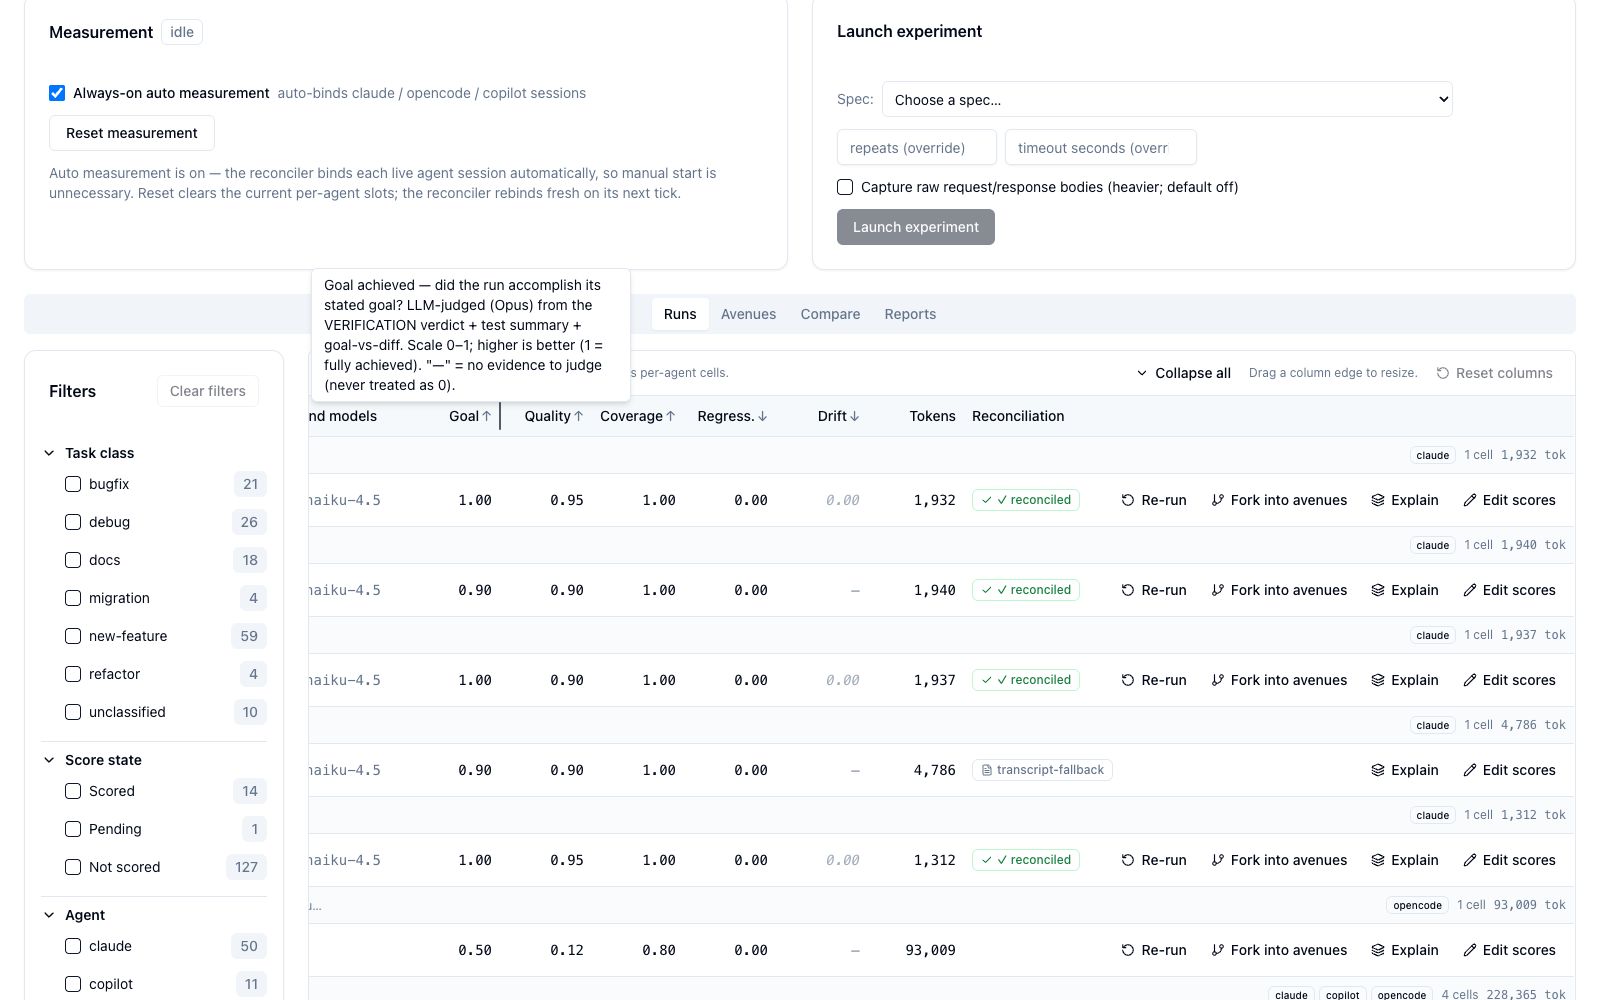
Hover the score columns — the definitions are hidden there
Every score header carries its full definition on hover. Goal: "did the run accomplish its stated goal? LLM-judged (Opus) from the VERIFICATION verdict + test summary + goal-vs-diff… '—' = no evidence to judge (never treated as 0)." Hover a value and you also get "Why this run scored this: <rationale>." The full set is in the Dashboard Reference.
The payoff: what actually got sent to the model
Click Explain on any run to open "Context & caching — what actually gets sent to the LLM." This is the centrepiece — the exact anatomy of your context window, measured from the real wire bytes:
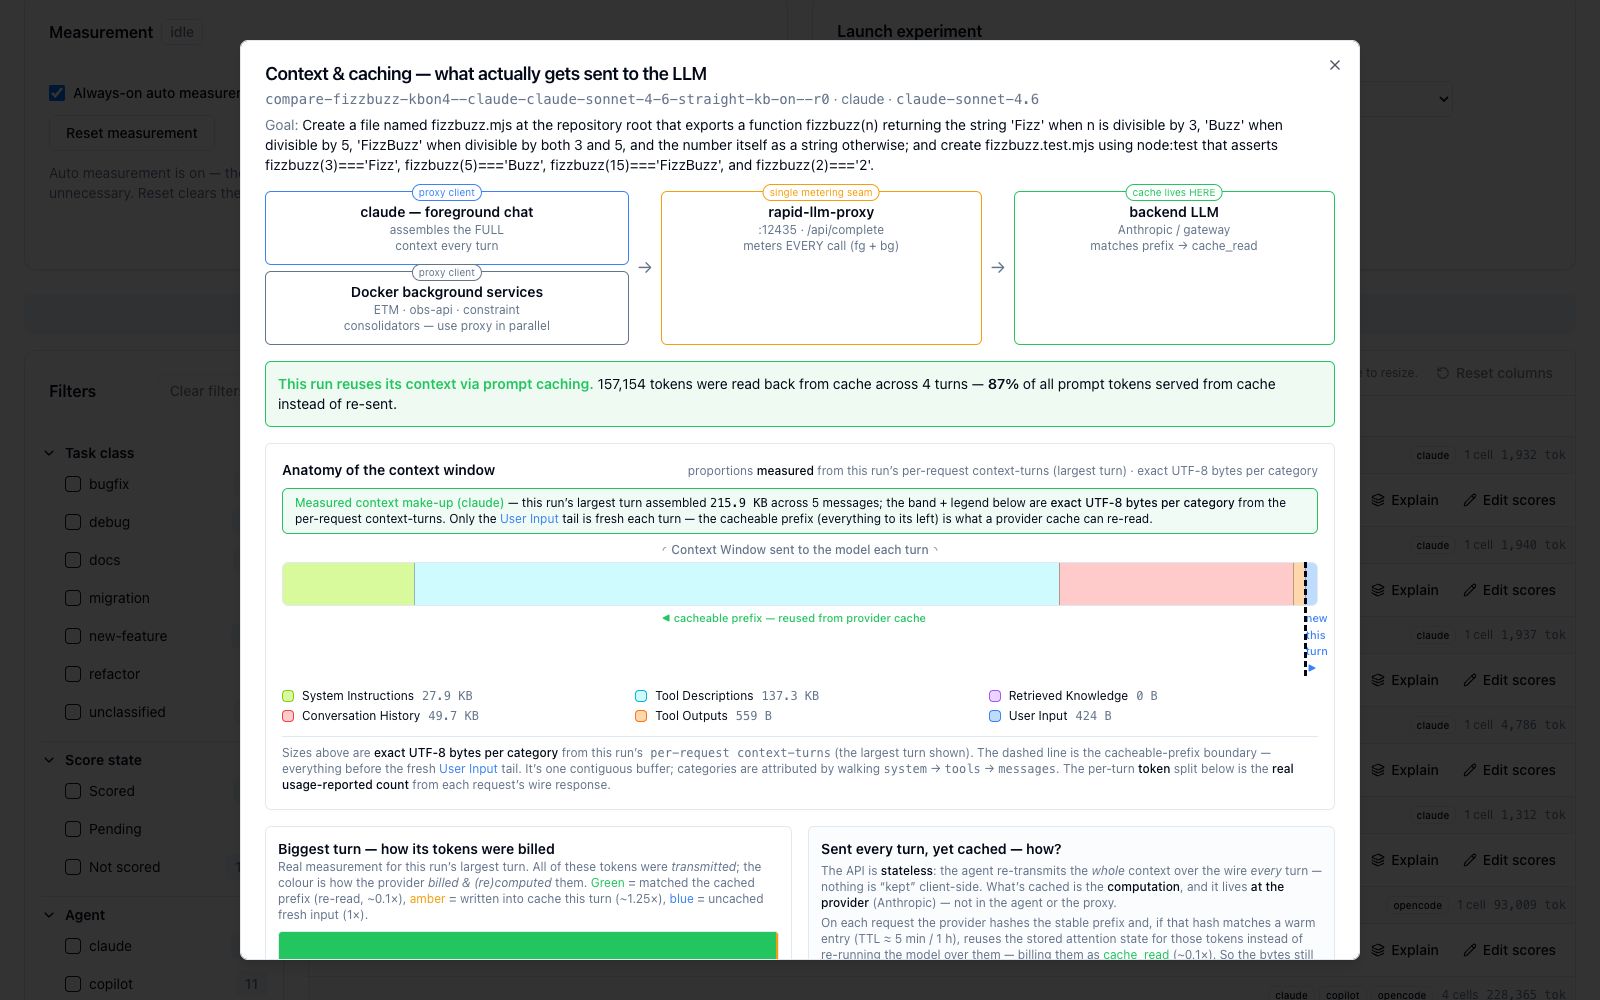
Read it like this:
- The topology strip shows the path: your agent → the
rapid-llm-proxy(the single metering seam at :12435) → the backend LLM (where the cache lives). - The band is one turn's full context window, scaled to real UTF-8 bytes: System Instructions, Tool Descriptions, Retrieved Knowledge, Conversation History, Tool Outputs, User Input. The dashed line is the cacheable-prefix boundary — everything to its left is re-read from cache; only the User Input tail is fresh each turn.
- "X% served from cache" tells you how much of the prompt was re-used (cheap
cache_read) vs re-sent.
Scroll down in the same modal for the caching detail — how the biggest turn was billed, the explicit-vs-implicit wire explanation, and the per-turn stacked bar chart (green = cache read, amber = cache write, blue = fresh input, purple = output):
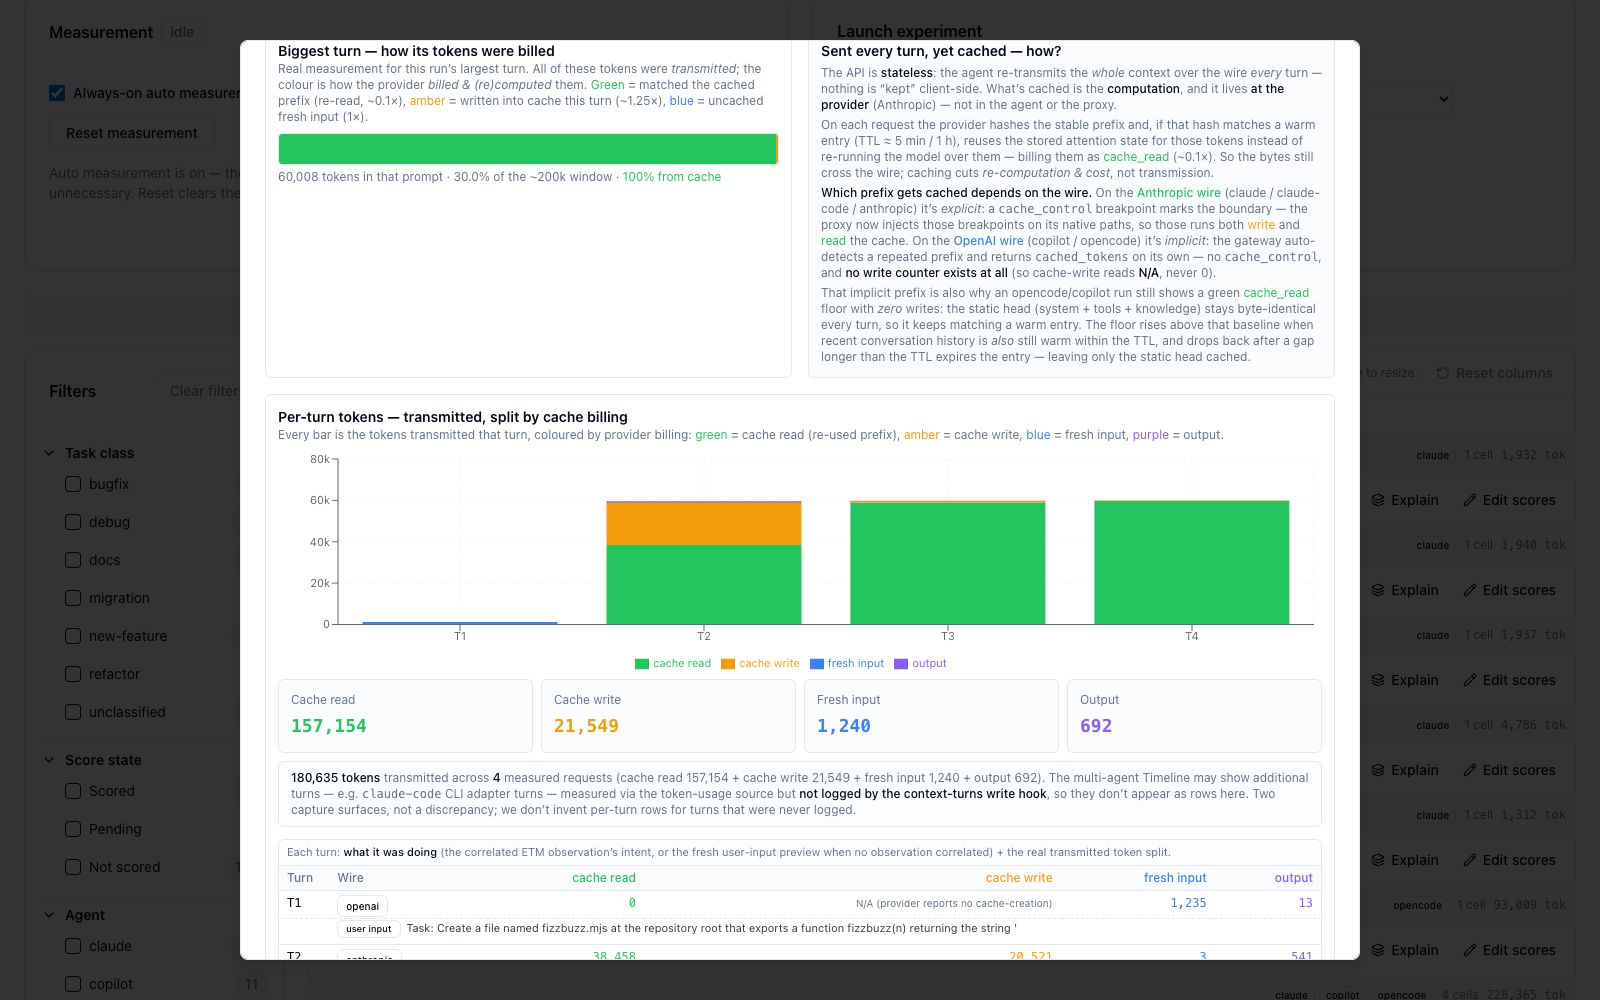
A 0-byte Retrieved-Knowledge block is the quality gate working
Click the Retrieved Knowledge segment for the injected-context breakdown — the ~1,000-token block (300 Working Memory + 700 semantic via Qdrant RRF). For a trivial task on a kb-on cell it shows 0 B: the relevance judge rejected the topical-but-useless matches. That empty block is the gate, not a bug.
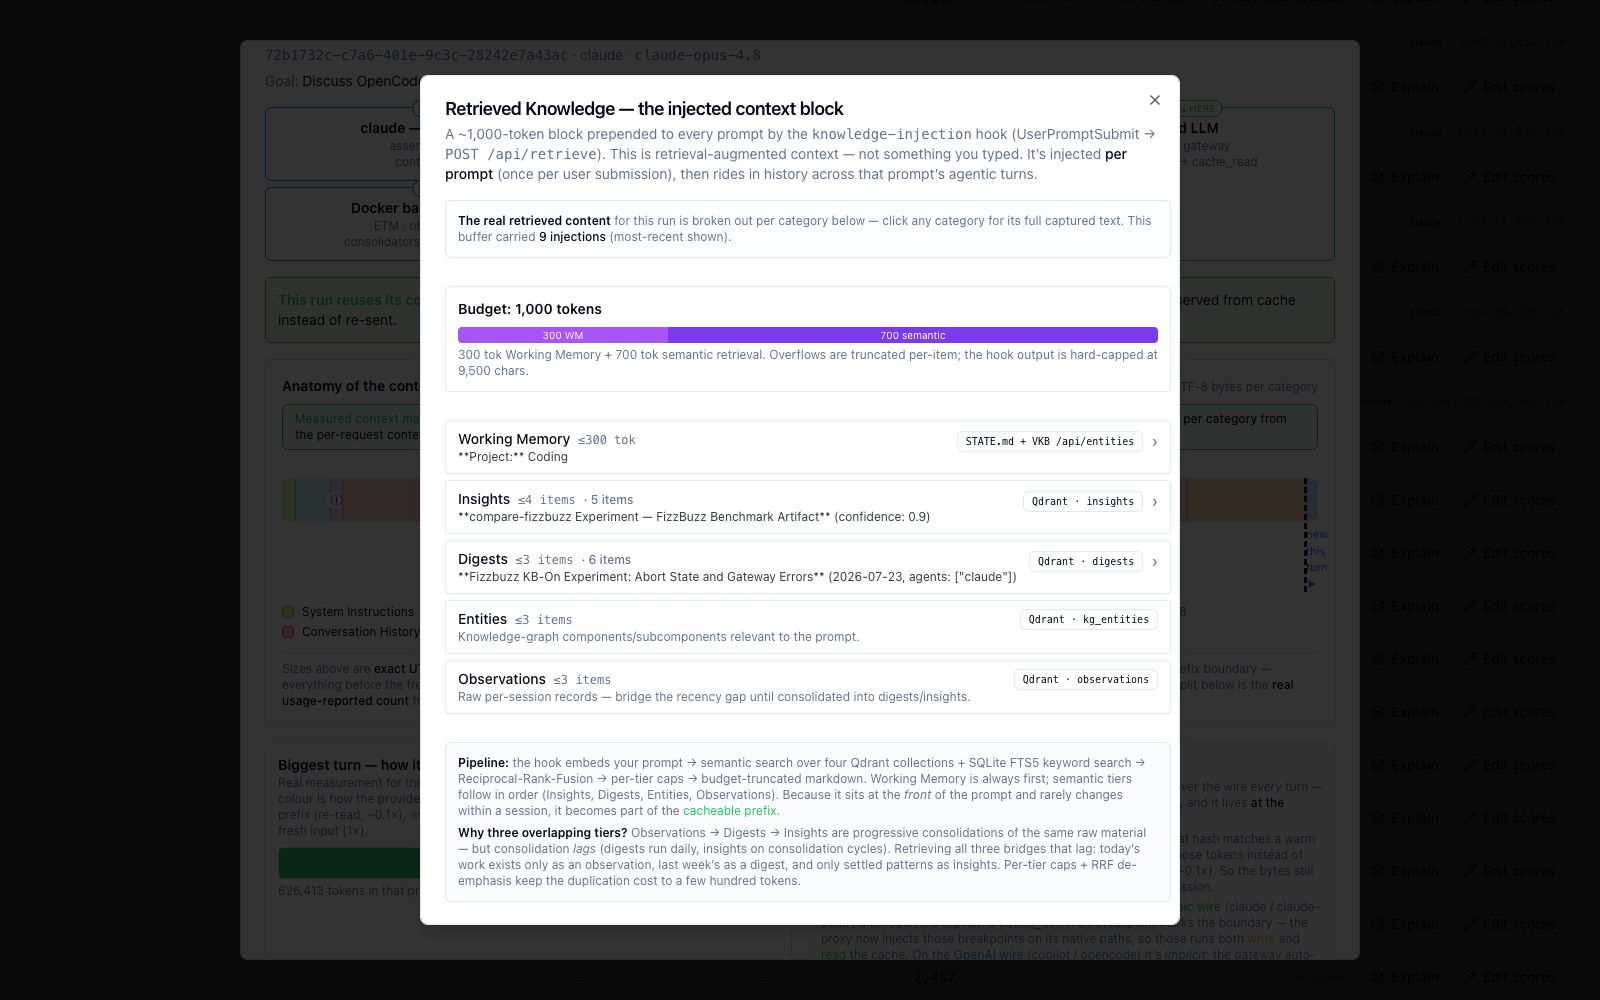
The timeline
Click a run to load its per-turn timeline below the table — turns are chronological, coloured by role (foreground development · knowledge capture · infrastructure), with role-filter chips to isolate a lane and cache-read hatching per turn:
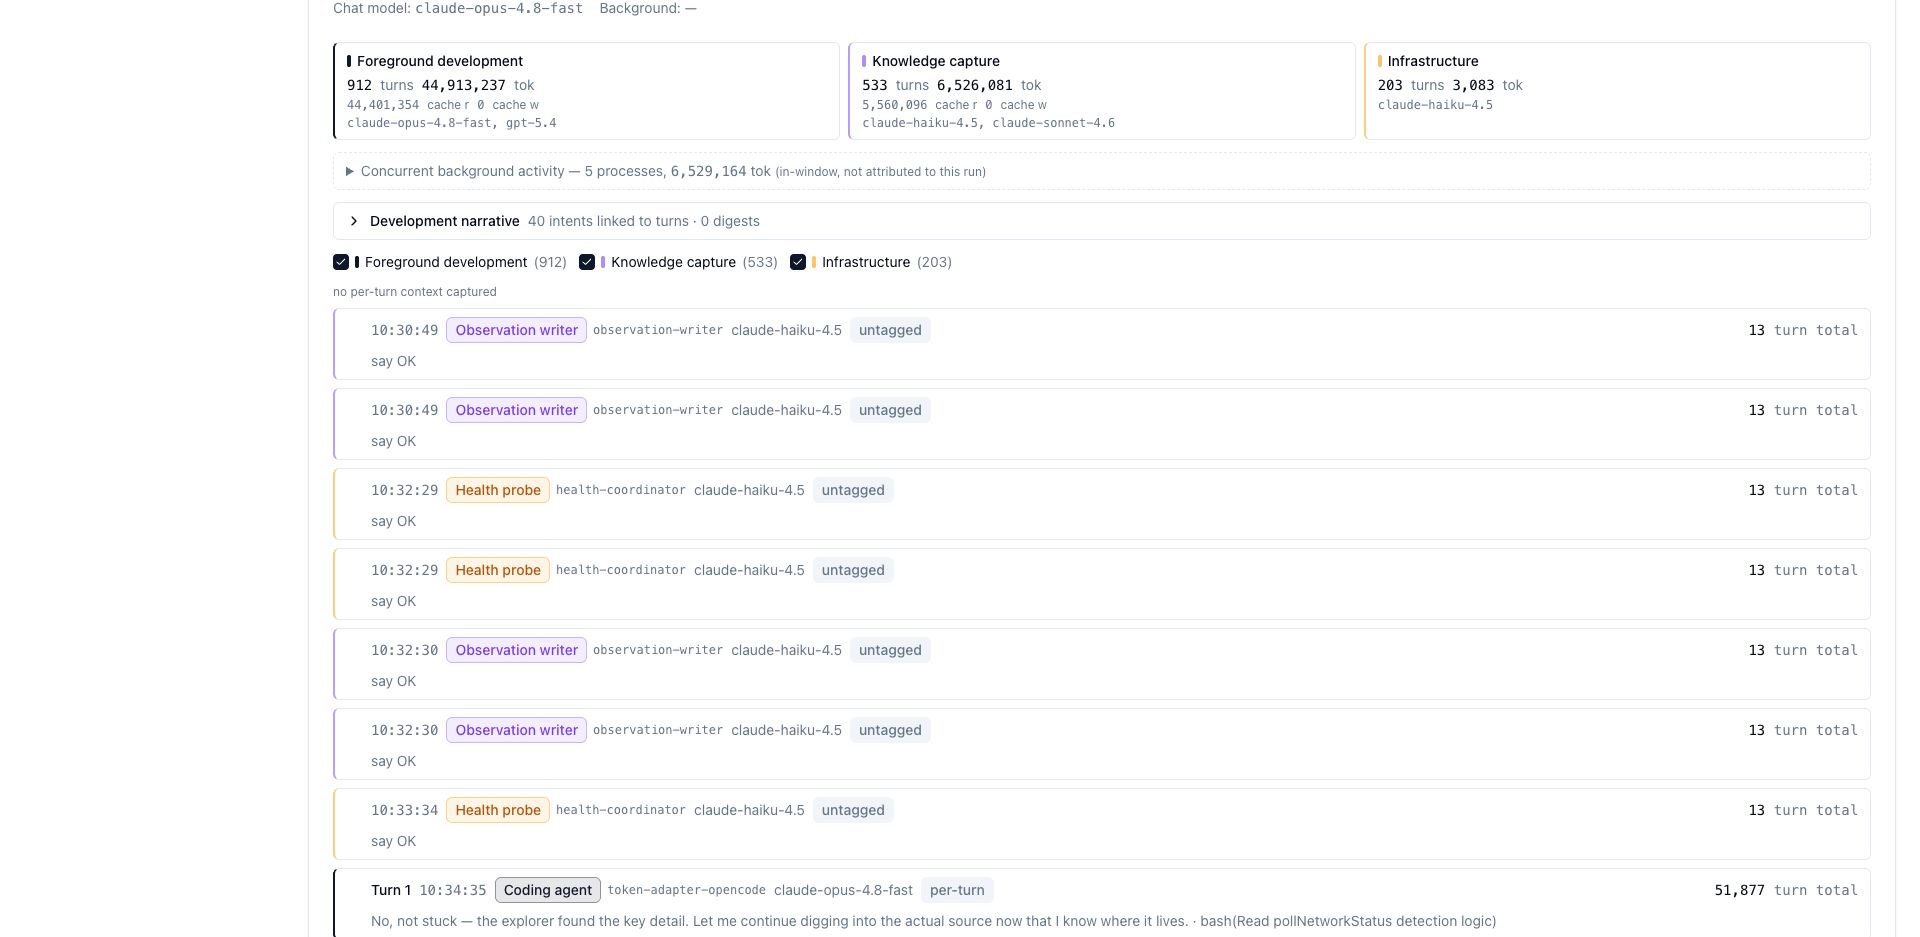
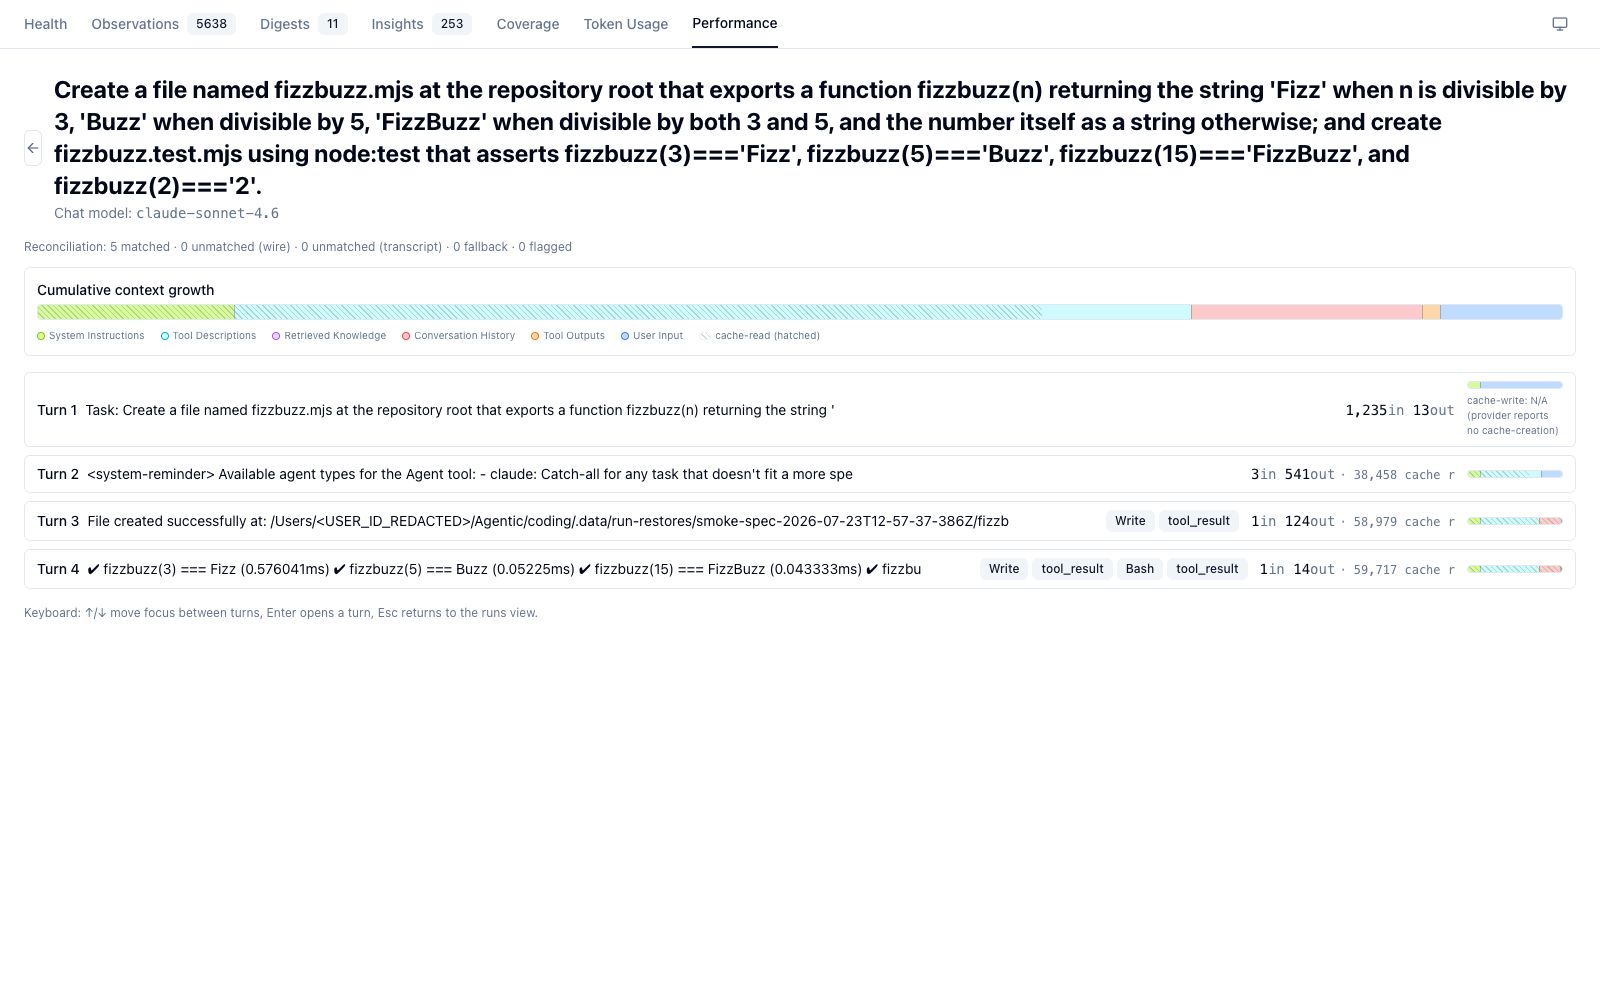
The fullscreen timeline adds the token-reconciliation summary and a cumulative context-growth band:
Always-on controls
The Always-on auto measurement checkbox is on by default — a reconciler binds each live claude / opencode / copilot session so its traffic is captured with zero setup. Reset clears the current per-agent slots and rebinds on the next tick. Leave it on.
Path B — Run an experiment (5 minutes)
When you need a decision instead of an observation, compare setups head-to-head.
Step 1 — Describe it in plain English
In any coding agent, type /experiment:
The skill turns your prose into a concrete matrix and drafts an objective test — the gate that makes results rankable — then writes config/experiments/<id>.yaml. Choose Run it (or Run ungated to skip the test, or Edit a field). The matrix runs unattended.
Run experiments unattended
There is a single measurement span slot (in serial mode). A concurrent in-repo agent call gets mis-stamped with the open cell's task_id. Don't drive a matrix from an interactive agent working the same repo.
You can also launch from the dashboard: pick a spec in Launch experiment, tick Run cells in parallel for a faster run if you like, then watch the Run monitor — a grid of live mini-terminals, one per cell, each streaming the agent's own output and moving through restoring → running → scoring. Cells are colored per agent, dim with a green glow on success (red on failure), and click any terminal to zoom in for a readable log:
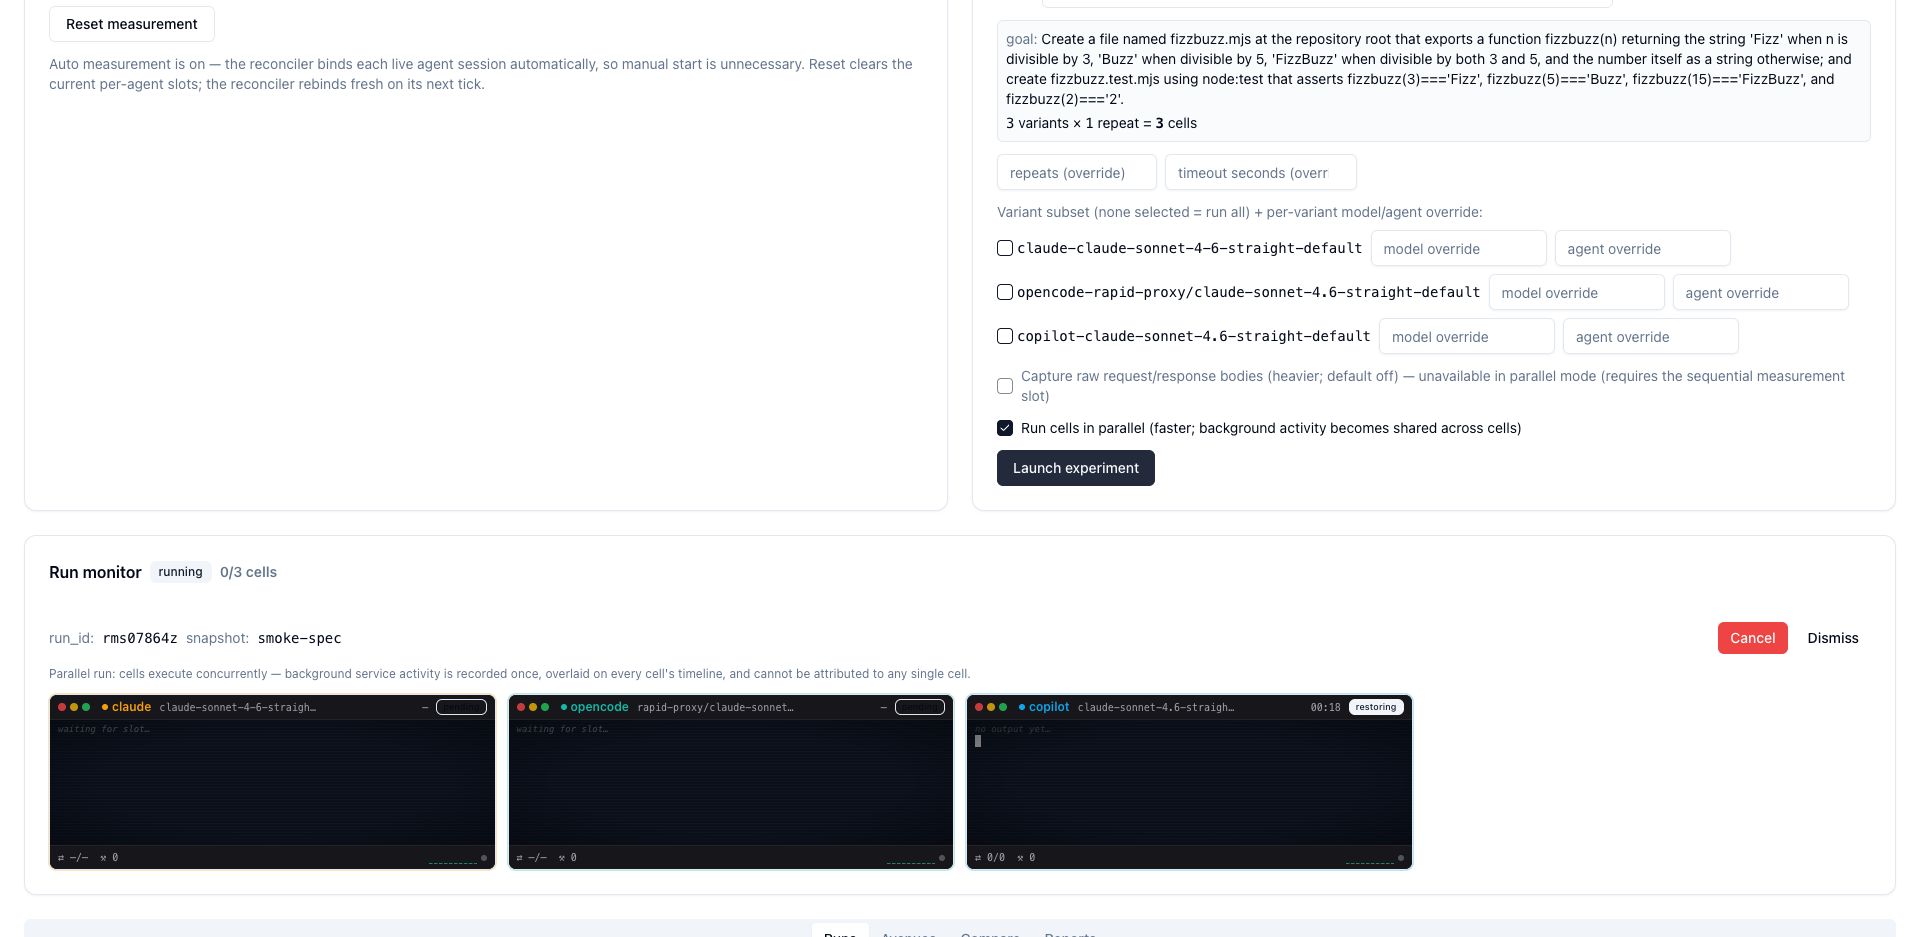
Parallel mode runs the cells through a bounded worker pool instead of one at a time. It's faster, but opencode cells will show as unmeasured (they attribute tokens only via the serial span slot) — run serially when you need their token numbers. See Serial vs parallel execution for the details.
Step 2 — Read the ranked comparison
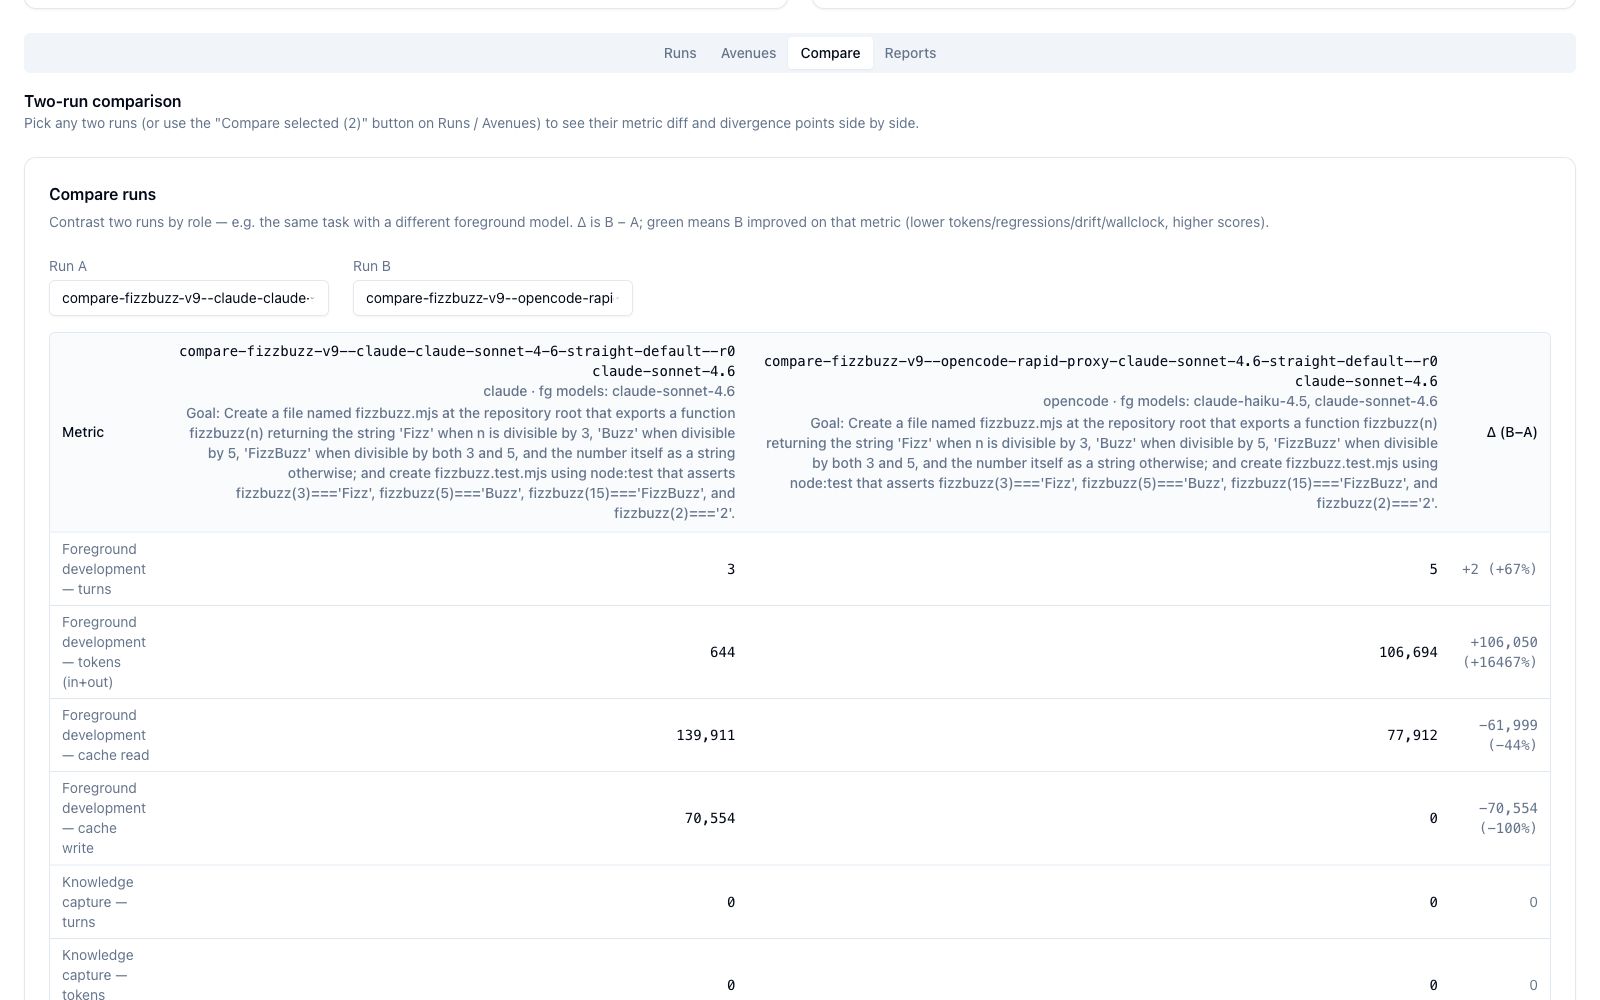
Dashboard → Performance → Compare. Two sections. Two-run comparison contrasts any two runs by role — tick two rows on Runs, hit Compare selected (2), and read the Δ(B−A) column. This is the clearest way to see the harness-overhead story (here claude sends 644 tokens where opencode sends 106,694 for the same fizzbuzz):
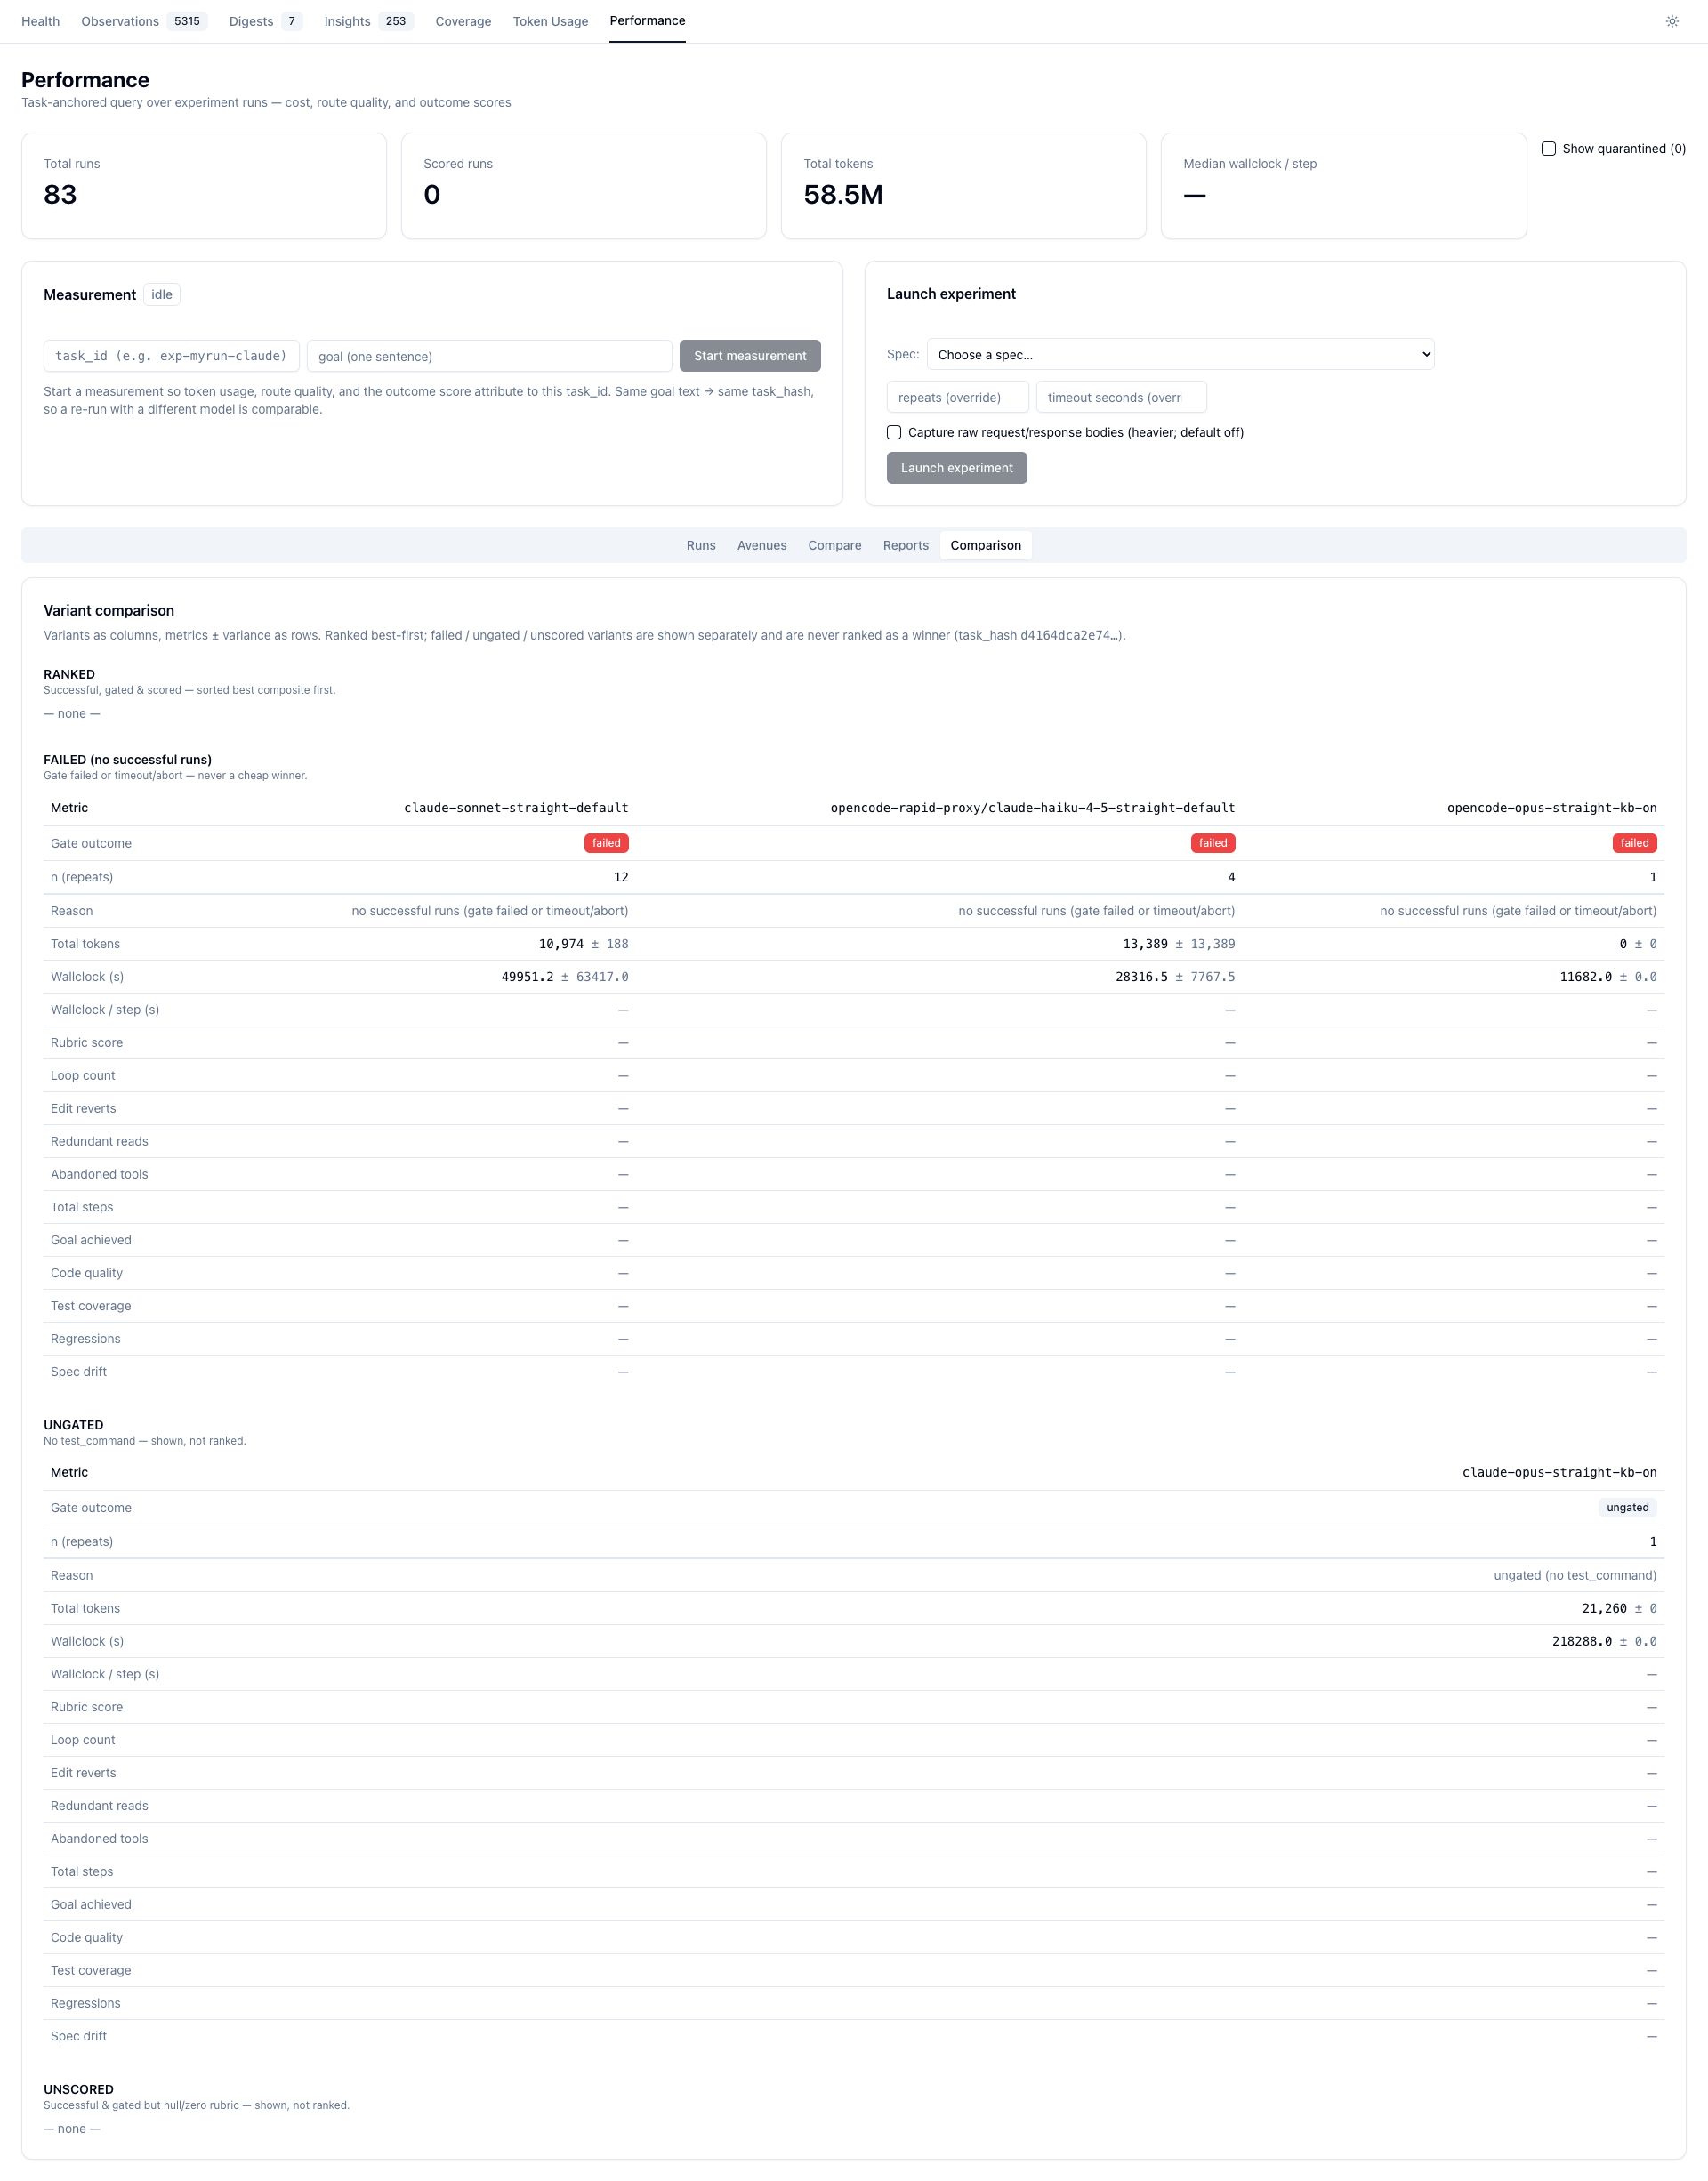
Experiment variant comparison is the ranked matrix — variants as columns, metrics ± variance as rows, grouped into the honesty spine: RANKED (best composite first), FAILED, UNGATED, UNSCORED — so a variant that never passed the gate is never crowned a winner:
Step 3 — Make the call
graph TD
    A[Open the Compare tab] --> B{Is the RANKED group empty?}
    B -->|Yes| B1[Nothing passed the gate.<br/>Fix the goal/test or run ungated;<br/>compare tokens & wall-clock only]
    B -->|No| C{Enough repeats?<br/>n >= 3 for trust}
    C -->|n = 1-2| C1[Treat as directional.<br/>Re-run with more repeats<br/>before committing]
    C -->|n >= 3| D[Take the lowest composite<br/>= cheapest per unit quality]
    D --> E{Close call<br/>between top variants?}
    E -->|Clear winner| F[Choose it]
    E -->|Composite tied| G[Break the tie on route heuristics:<br/>loop_count, edit_revert_count,<br/>total_step_count = solution stability]
    E -->|Quality gap matters| H[Drill into the 5-dim rubric:<br/>code_quality, test_coverage, spec_drift]
    G --> F
    H --> I{Cheaper variant's<br/>quality acceptable?}
    I -->|Yes| J[Switch to the cheaper<br/>model/agent/methodology]
    I -->|No| K[Keep the higher-quality variant;<br/>the cost premium is justified]
Path C — Fork the same span into avenues
When you've got a run you like and want to try the same prompt several ways at once, Fork into avenues seeds a sweep across the agent / model / framework / knowledge-injection axes — each avenue on its own isolated git branch and worktree. The Avenues tab groups every sibling of one origin span into a single ranked table with a built-in help card:
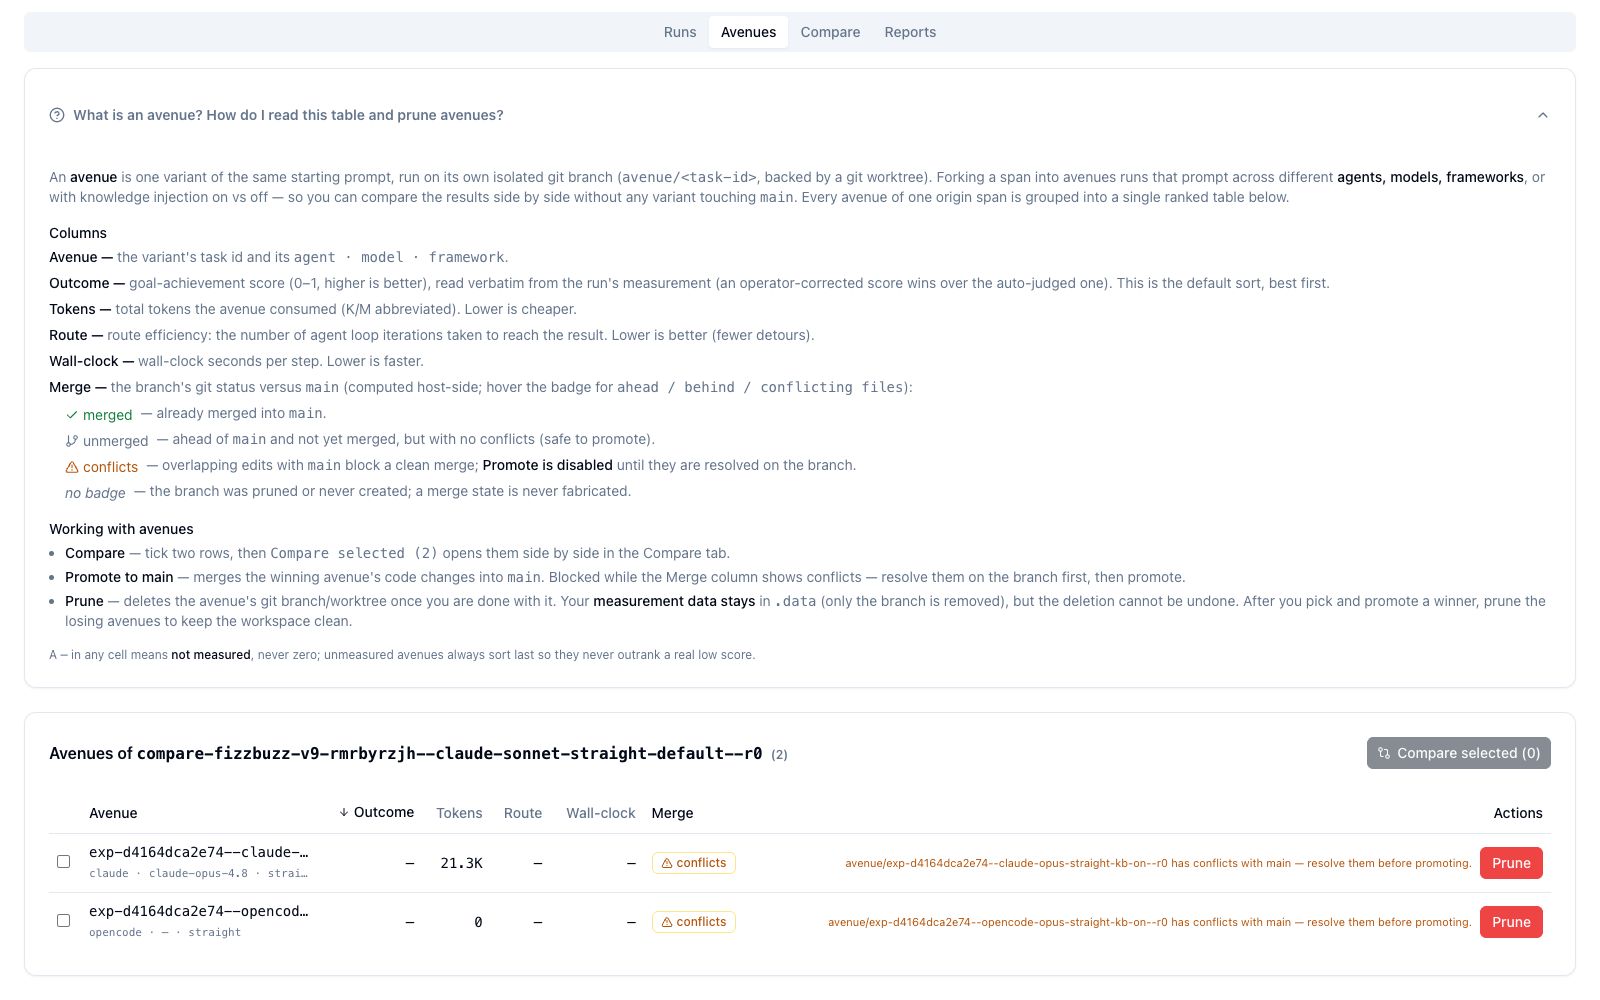
Rank by Outcome, then Promote to main the winner (blocked while its Merge badge shows conflicts) and Prune the losers — the branch goes, but the measurement data stays in .data.
Where to look for what
| I want to… | Go to |
|---|---|
| See what a session cost / its timeline | Performance → Runs → click a row |
| See the real context-window breakdown & cache reuse | Runs → Explain on a row |
| Compare two runs or a variant matrix | Performance → Compare |
| Sweep the same prompt many ways | Runs → Fork into avenues → Avenues tab |
| Override a wrong auto-score | Runs → Edit scores |
| Every column / badge / tooltip defined | The Dashboard Reference |
What the numbers mean
| Metric | Prefer | Reads as |
|---|---|---|
composite | lower | cost per unit quality — the headline |
totalTokens | lower | raw cost (compare within an agent, not across) |
goal_achieved | higher | quality (0–1) |
wallclock | lower | latency |
loop_count, edit_revert_count, total_step_count | lower | solution efficiency / stability |
n | higher | how much to trust the result |
Optimizing across the levers
- Models — sweep
opus/sonnet/haikufor one agent to find the cheapest tier that clears your quality bar. - Agents — same goal across
claude/opencode/copilot; the composite normalizes their different token economics. - Methods — vary
framework(straight vs TDD) or theenvkb-on / kb-off axis to measure whether a heavier method actually pays for itself.
Execution-style goals score better for opencode/copilot
opencode's headless run ends its loop on the first assistant message with no tool call, so an analysis-shaped goal ("explain how…") gets narrated instead of executed. Phrase deliverables as execution ("create file X, write it, done only once it exists") to get a real artifact. See Operational notes.
See the Dashboard Reference for every facet, the /experiment skill reference for all options, the Overview for the three-layer model, or the Architecture for how capture works under the hood.