Measurement & Cost Optimization
Run the same task across agents, models and methodologies; measure what each costs; rank them by cost per unit of quality.
What this answers
"Which model should I use?" — as a measured decision rather than a feeling. The same coding goal is run across variants, each run is measured on three axes, and the variants are ranked.
- Tokens — the cost proxy (input + output + reasoning)
- Wall-clock — how long you waited
- Quality — a 0–1 rubric score, gated by an objective pass/fail test
The headline number combines them:
A variant that is 3× cheaper at 10% lower quality usually wins — which is exactly the trade-off this makes visible.
The one thing to remember
A comparison never fakes a winner. A variant is only cost-ranked if it passed an objective test gate. Anything that failed, was never gated, or could not be scored is shown separately and never averaged into the ranking. If nothing passed, the ranked list is empty.
Start here
The Tutorial goes from a plain-English description to a cost decision in about five minutes. Or open the dashboard at localhost:3032 → Performance.
Run, score, comparison
Three nouns carry the whole model:
- Run — one execution of the goal by one variant (
agent × model × framework × env), repeated N times, recording tokens, wall-clock and routing. - Score — after the run, an objective test gate decides pass/fail and a five-dimension rubric judge produces the quality signal. The evidence is a diffstat over a post-restore baseline commit, so only the agent's own edits count, and untracked new files count too.
- Comparison — runs sharing a
task_hash(the sha256 of the goal sentence) are aggregated per variant and ranked.
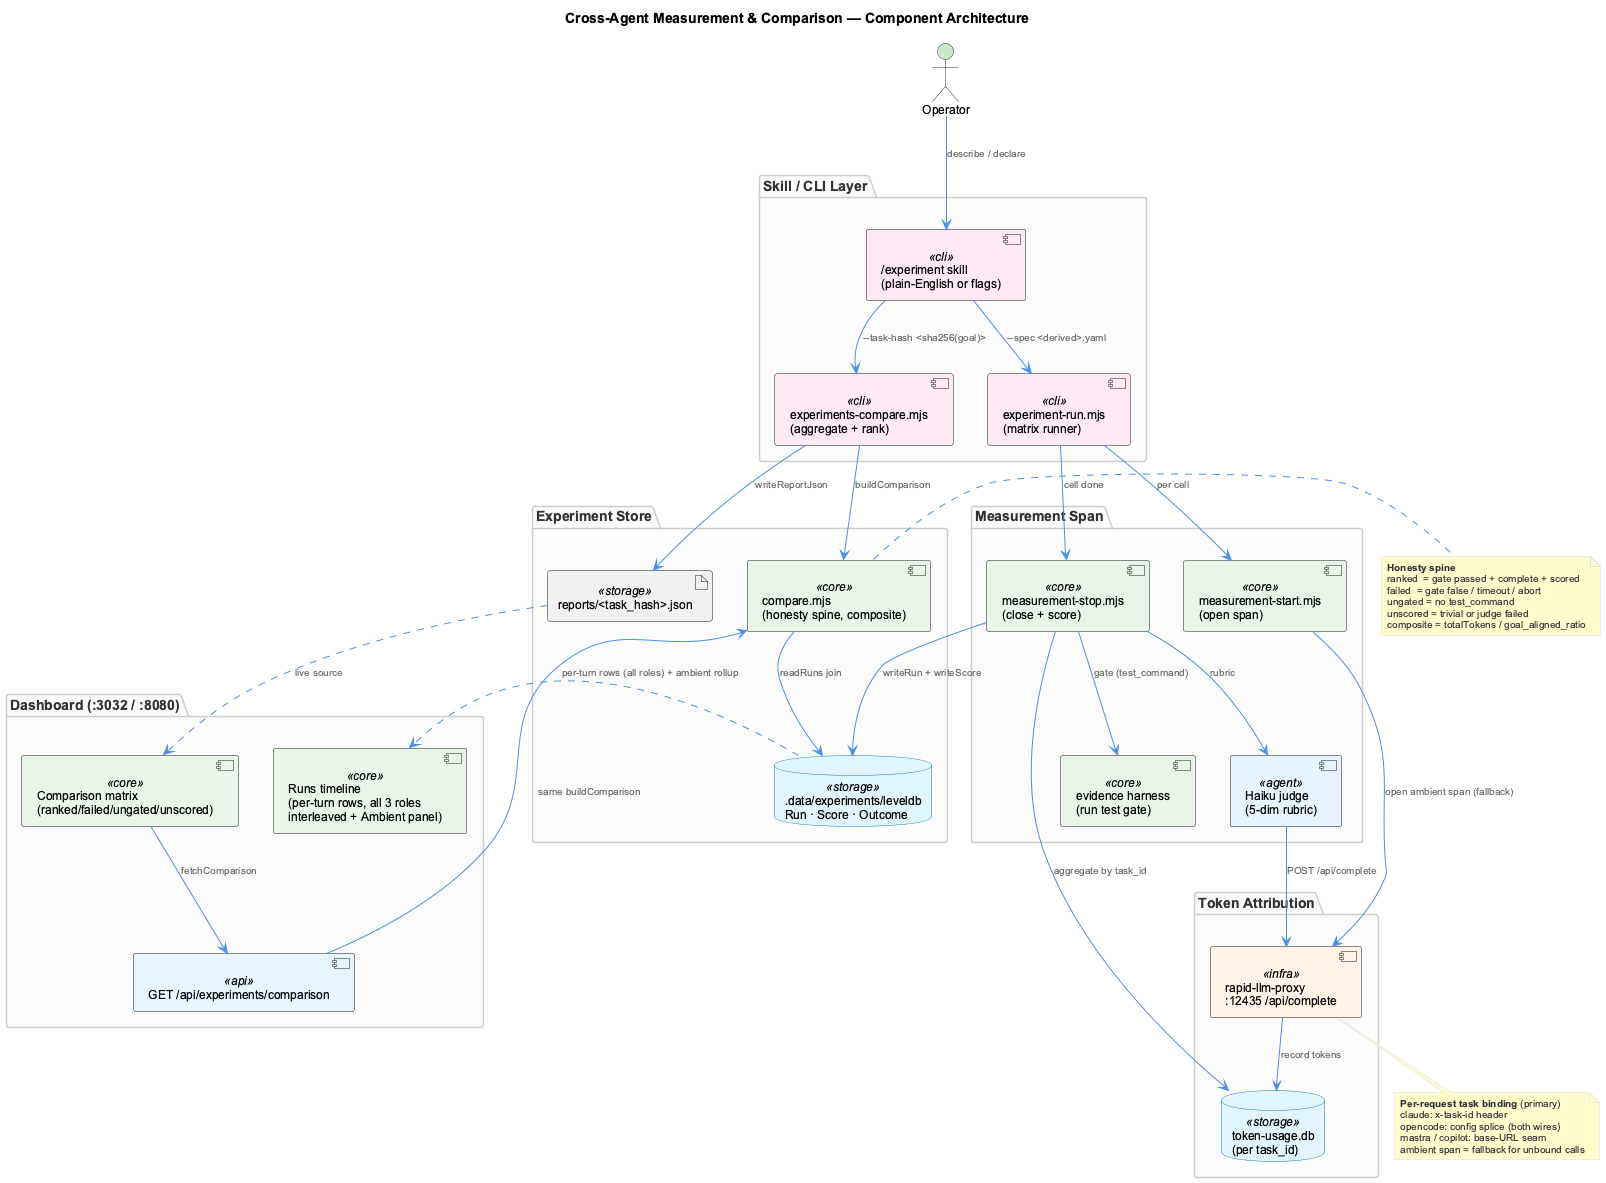
Why the results can be trusted
Every variant lands in exactly one group, and only the first is ranked on cost:
| Group | Meaning | Cost-ranked? |
|---|---|---|
| ranked | Gate passed, run completed, rubric scored | yes |
| failed | Gate failed, or the run timed out or aborted | no — shown, never averaged |
| ungated | No objective test was supplied | no — tokens and wall-clock only |
| unscored | Trivial run, or the judge could not score it | no — shown separately |
This is why supplying a test gate matters: it is what makes a variant rankable at all.
Three layers of measurement
Only the top two ask anything of you.
Ambient is always on. Every call routed through the proxy is recorded passively, and a daemon writes one Run per session — including sessions on bypass providers that never touch the proxy. You get a token and route timeline for free, but no quality score, because the judge is not run.
Measurement is a named span with a task_id and a one-sentence goal, so a task's tokens attribute to a stable task_hash and closing the span triggers the heavy work ambient skips: token aggregation, the judge, the score. It can be bound automatically to each live foreground session, or opened by hand for a single task you want scored and re-runnable.
Experiment runs a whole matrix — variants × repeats, each measured, gated and judged — then ranks them and writes the report the Compare tab reads. Drive it from the dashboard or the /experiment skill.
Choosing the right layer
- Just want to see what a session cost? Ambient already recorded it.
- Want this task scored and comparable later? Open a measurement span.
- Want to decide between options? Run an experiment — one variant measured once is an anecdote.
Typical questions it settles: is Haiku good enough for this class of task; Claude or OpenCode on the same goal; straight prompting versus a TDD framework; knowledge injection on or off.
Where to look next
- Do it now — the Tutorial, five minutes end to end.
- How it works — Architecture, the measurement sequence and data model.
- Every knob — the Dashboard Reference.
Overview
This project can run the same coding task across multiple agents, models, and methodologies, measure what each one actually costs, and rank them by cost-per-unit-quality — so you can choose the cheapest option that still does the job. It turns "which model should I use?" from a guess into a measured decision.
Every run is measured on three axes:
- Tokens — the direct cost proxy (input + output + reasoning).
- Wall-clock — user-perceived latency.
- Quality — a
goal_aligned_ratio(0–1) from a rubric judge, gated by an objective pass/fail test.
The headline number is the composite:
A variant that is 3× cheaper but only 10% lower quality usually wins on composite — and this tooling makes that trade-off visible instead of hypothetical.
The mental model: Run → Score → Comparison
- Run — one execution of the goal by one variant
(agent × model × framework × env), repeated N times. Each run records its tokens, wall-clock, and route heuristics. - Score — after the run, an objective test gate decides pass/fail, and a 5-dimension rubric judge (Opus 4.8) produces the quality signal. Evidence for the judge comes from a scratch-index diffstat (so untracked new-file deliverables count) over a post-restore baseline commit (so only the agent's edits are diffed).
- Compare — runs sharing a
task_hash(the sha256 of the goal sentence) are aggregated per variant (mean ± stddev, median, min/max, n) and ranked.
The honesty spine
A comparison never fakes a winner. Every variant lands in exactly one group:
| Group | Meaning | Ranked on cost? |
|---|---|---|
| ranked | Test gate passed, run completed, rubric scored | ✅ yes |
| failed | Test gate failed, or the run timed out / aborted | ❌ shown, never cost-averaged |
| ungated | No objective test was supplied | ❌ compared on tokens/wall-clock only |
| unscored | Trivial run, or the judge could not score it | ❌ shown separately |
If nothing passed the gate, the ranked section is empty — and the dashboard shows "— none —" rather than crowning a failed variant. This is why supplying a test gate matters: it's what makes variants rankable.
Ambient, measurement, experiment — three layers
Measurement happens at three levels, and only the top two ask anything of you:
- Ambient (always-on). Every LLM call that routes through the
rapid-llm-proxyis recorded passively, and theauto-measure-foregrounddaemon (com.coding.auto-measure-foreground, every 120s) writes one dashboard Run per OpenCode session — including bypass-provider sessions (e.g. copilot-BYOK) that never hit the proxy. You get a token/route timeline for all work without asking. It attributes cost but does not run the judge, so ambient Runs carry no quality Score. - Measurement — a named span with a
task_id+ one-sentence goal, so a specific task's tokens attribute to a stabletask_hash(sha256(goal)) and its Stop triggers the heavy close (token-aggregate + judge + score) that ambient skips. This span can open two ways:- Always-on (default). The measurement reconciler keeps a span bound to each live claude / opencode / copilot foreground session automatically, so interactive sessions get a real context-window breakdown with no clicks — provided the session routes through the proxy (a
rapid-proxy/<model>model, not a directgithub-copilot/<model>one, which bypasses the wire-tap and yields only the illustrative band). A single Always-on auto measurement checkbox on the Performance tab toggles it; when on, the manual form becomes a Reset button (clear-and-rebind). See Architecture → Always-on per-agent measurement. - Manual. With always-on off, the Start measurement button opens the span with a
task_id+ goal you choose — reach for it when you want one hand-run task to be a scored, re-runnable, comparable unit (effectively a single manual experiment cell).
- Always-on (default). The measurement reconciler keeps a span bound to each live claude / opencode / copilot foreground session automatically, so interactive sessions get a real context-window breakdown with no clicks — provided the session routes through the proxy (a
- Experiment — the Launch experiment button, or the
/experimentskill. Runs a whole matrix (variants × repeatscells, each measured, gated, judged), ranks them, and writes the report the Compare tab reads. A completed run can also be forked into avenues — the same prompt swept across agent/model/framework/knowledge axes, each on its own isolated branch (see the Dashboard Reference → Avenues).
The Performance tab surfaces all of it: a grouped Runs table (every measured/ambient Run), each run's role-lane timeline, the Compare and Avenues tabs, and the Context & Caching explainer. Every tab, column, badge, and hover tooltip is catalogued in the Dashboard Reference.
When to reach for it
- Choosing a model — is Haiku good enough for this class of task, or do you need Sonnet/Opus?
- Choosing an agent — Claude vs OpenCode vs Copilot on the same goal.
- Choosing a methodology — straight prompting vs TDD framework, KB-injection on vs off.
- Justifying a switch — turning "Haiku feels fine" into "Haiku is 0.85 quality at ⅓ the tokens on
new-featuretasks, n=5."
Where to look
- Run it: the
/experimentskill — describe an experiment in plain English (or with flags) and it drives the whole pipeline. - How it works: Architecture — the end-to-end measurement sequence, the knowledge-injection axis, and the data model.
- Do it now: the Tutorial — a 5-minute walkthrough from a plain-English description to a cost decision.
- Every knob: the Dashboard Reference — exhaustive tab/column/badge/tooltip catalogue.
Dashboard: http://localhost:3032 → Performance tab.