Performance Dashboard — Full Reference
Every tab, column, badge and score dimension on the Performance dashboard — including the hover tooltips, written out as visible prose.
Where it is
localhost:3032 → Performance.
The tabs
| Tab | Shows |
|---|---|
| Runs | Every measured and ambient run, grouped, with its timeline |
| Avenues | One prompt swept across agent, model, framework and knowledge axes |
| Compare | Variants ranked for one task |
| Reports | Generated experiment reports |
Plus a Context & Caching explainer for the per-turn context breakdown.
The rule to remember
A variant is only cost-ranked if it passed an objective test gate. Anything that failed, was never gated, or could not be scored appears separately and is never averaged into the ranking — so an empty ranked section means nothing passed, not that nothing ran.
Why this page exists
The dashboard hides a lot of load-bearing explanation behind hover tooltips. They are all reproduced here as text, because a tooltip you have to know exists is not documentation.
Softer entry points
For a screenshot-driven walkthrough, start with the Tutorial. For the model behind the numbers, read the Overview.
What the page is for
The Performance dashboard is the single front-end over every measured run — ambient ones recorded passively, named measurement spans, and full experiment matrices. The tabs differ in how much they ask of you, not in where their data comes from.
Runs
The grouped table of every run in the window, each expandable into a role-lane timeline showing where its time and tokens went. Ambient runs appear here alongside deliberate ones and are distinguishable by carrying no quality score — the judge is not run for them.
Avenues
A completed run can be forked into avenues: the same prompt swept across the agent, model, framework and knowledge axes, each on its own isolated branch. This is the tab for "what if we had done it the other way" without re-typing the goal.
Compare
Variants for one task, ranked. The ranking obeys the grouping rule that runs through this whole system: ranked, failed, ungated and unscored are four distinct outcomes, and only the first is cost-ranked. That is deliberate — a comparison that promoted a failing variant because it was cheap would be worse than no comparison.
When the ranked section is empty, the honest reading is that nothing passed its gate, which is usually a message about the gate rather than about the variants.
Badges and glossary
The dashboard uses badges to carry provenance — whether a figure was observed live or reconstructed afterwards, and whether a run's tokens are complete. Reconstructed values are badged rather than silently blended, because a number rebuilt against today's configuration is wrong wherever the configuration has since changed.
Every badge, column and score dimension is catalogued in the Deep Dive below, along with each hover tooltip written out in full.
Related
- Overview — run, score, comparison
- Tutorial — a guided walkthrough
- Architecture — the measurement sequence and data model
This page is the exhaustive reference for the Performance dashboard at http://localhost:3032 → Performance — every tab, column, badge, score dimension, and interactive facet, plus every hover tooltip written out as visible prose (the dashboard hides a lot of load-bearing explanation behind hover; it is all reproduced here).
For a guided, screenshot-driven walkthrough, start with the Tutorial. For the model behind it, see the Overview and Architecture.
The page at a glance
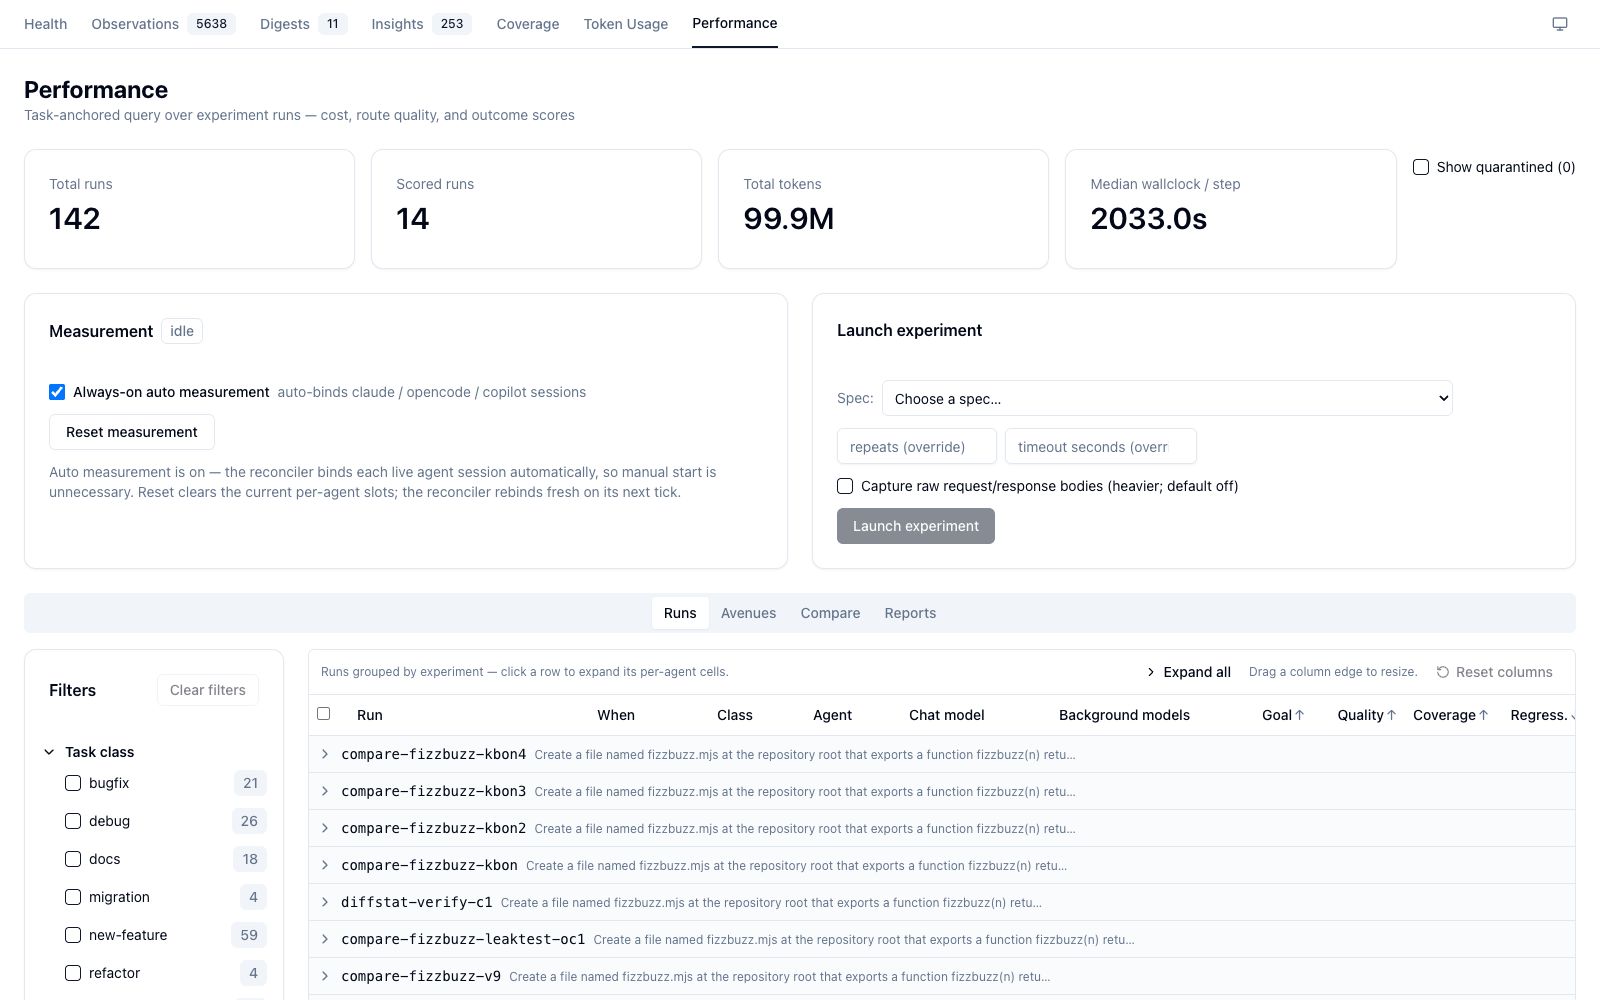
The header reads "Task-anchored query over experiment runs — cost, route quality, and outcome scores." Below it:
- Four stat tiles — Total runs, Scored runs, Total tokens, Median wallclock / step.
- Show quarantined (N) — a toggle that re-fetches with
?includePendingto reveal runs that were quarantined (invalid/unclassifiedtask_class); hidden from default queries. - Measurement panel (left) and Launch experiment panel (right) — see below.
- Sub-tabs: Runs · Avenues · Compare · Reports.
- A faceted Filters rail (Task class · Score state · Agent · Model · Framework).
Measurement panel
Always-on auto measurement is on by default — "auto-binds claude / opencode / copilot sessions." A background reconciler binds each live agent session automatically, so a manual start is unnecessary. Reset measurement clears the current per-agent slots; the reconciler rebinds fresh on its next tick.
Launch experiment panel
Pick a Spec from the dropdown (populated from config/experiments/*.yaml via GET /api/experiments/specs; malformed specs appear disabled with their parse error). Optional repeats / timeout overrides, a variant subset with per-variant model/agent overrides, a Sweep expander (every combination of the selected fork axes), Capture raw request/response bodies (heavier; default off), and Run cells in parallel. Launch experiment posts to /api/experiments/run and wires up the Run monitor.
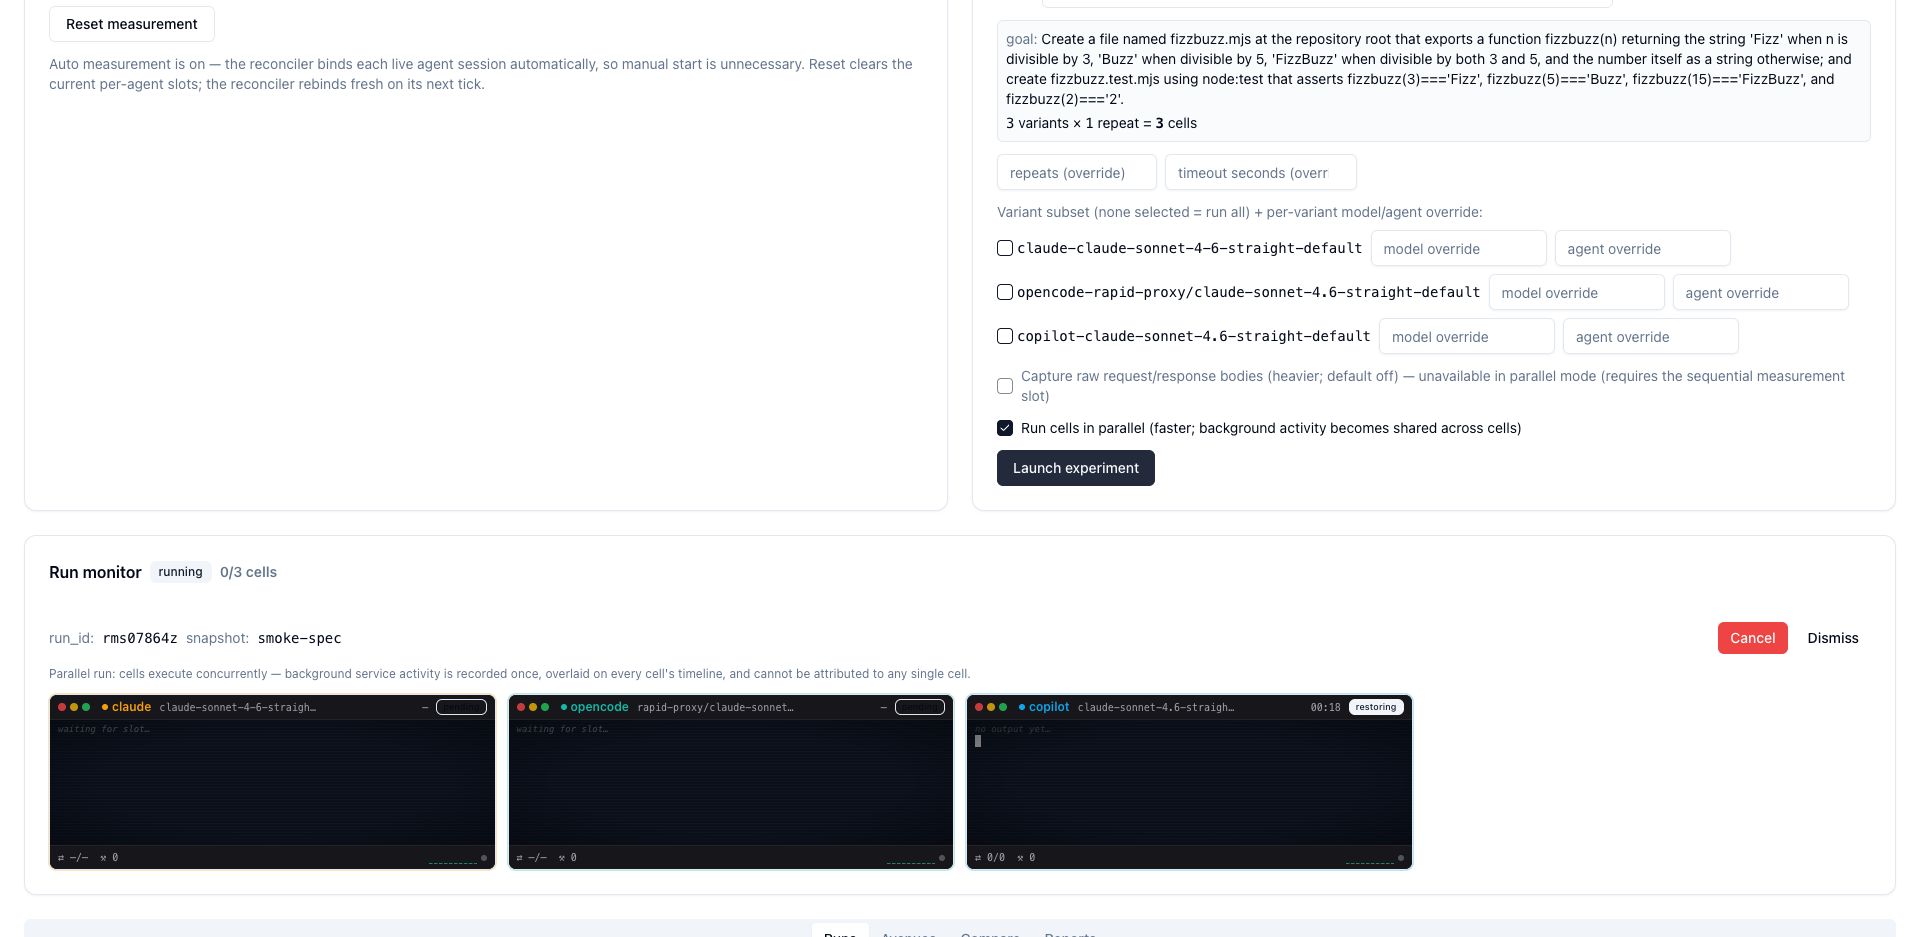
Run cells in parallel
Ticking Run cells in parallel runs the matrix through a bounded worker pool instead of one cell at a time. It threads --parallel to the runner (default pool size 4). Because parallel cells cannot share the single global span slot, spans go slotless (per-cell) and attribution relies on per-request binding — see The /experiment skill → Serial vs parallel execution for the full mechanism. Two consequences are visible in the UI:
- Capture raw bodies is disabled while parallel is on (raw capture is armed off the global slot, which parallel mode never writes) — the checkbox greys out with a hint.
- opencode cells show as unmeasured (0 tokens) in parallel mode — they are ambient-slot-bound and only attribute via the global slot. Run serially to measure them. claude and copilot are per-request bound and measure either way.
Run monitor — the mini-terminal grid
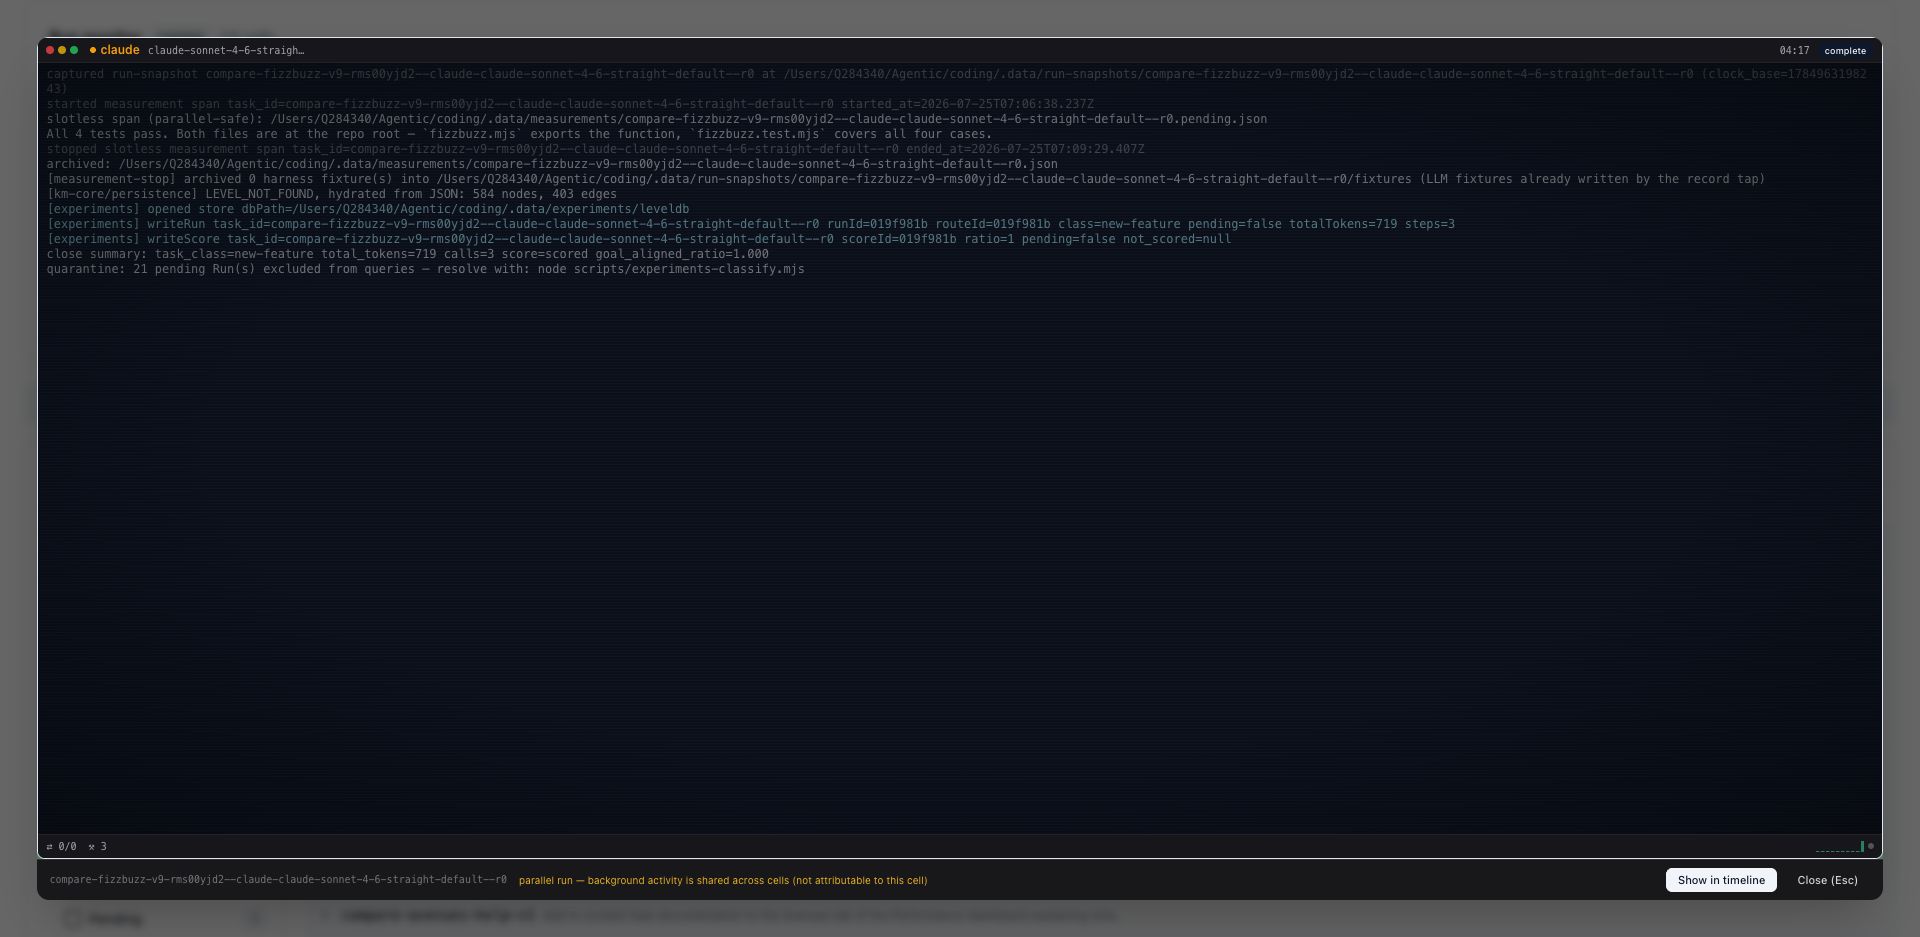
The Run monitor renders each cell as a scaled-down live terminal that tails the cell's own log (<runDir>/cells/<taskId>.log, polled every ~1.5 s via GET /api/experiments/run-log/:runId/:taskId). Each terminal card shows: a header with the agent (in a stable per-agent accent — claude amber, opencode teal, copilot blue, pi violet), model + kb-on chips, a state badge, and a ticking elapsed timer; a colorized auto-scrolling log body (errors red, tool calls cyan, infra dimmed) with a blinking cursor while running; and a footer with live tokens in/out, tool-call count, and a lines-per-minute activity sparkline. Completed cells dim with a green edge-glow; a timeout/abort gets a red glow and the failure reason pinned. A parallel run also shows a note that background activity is shared across cells.
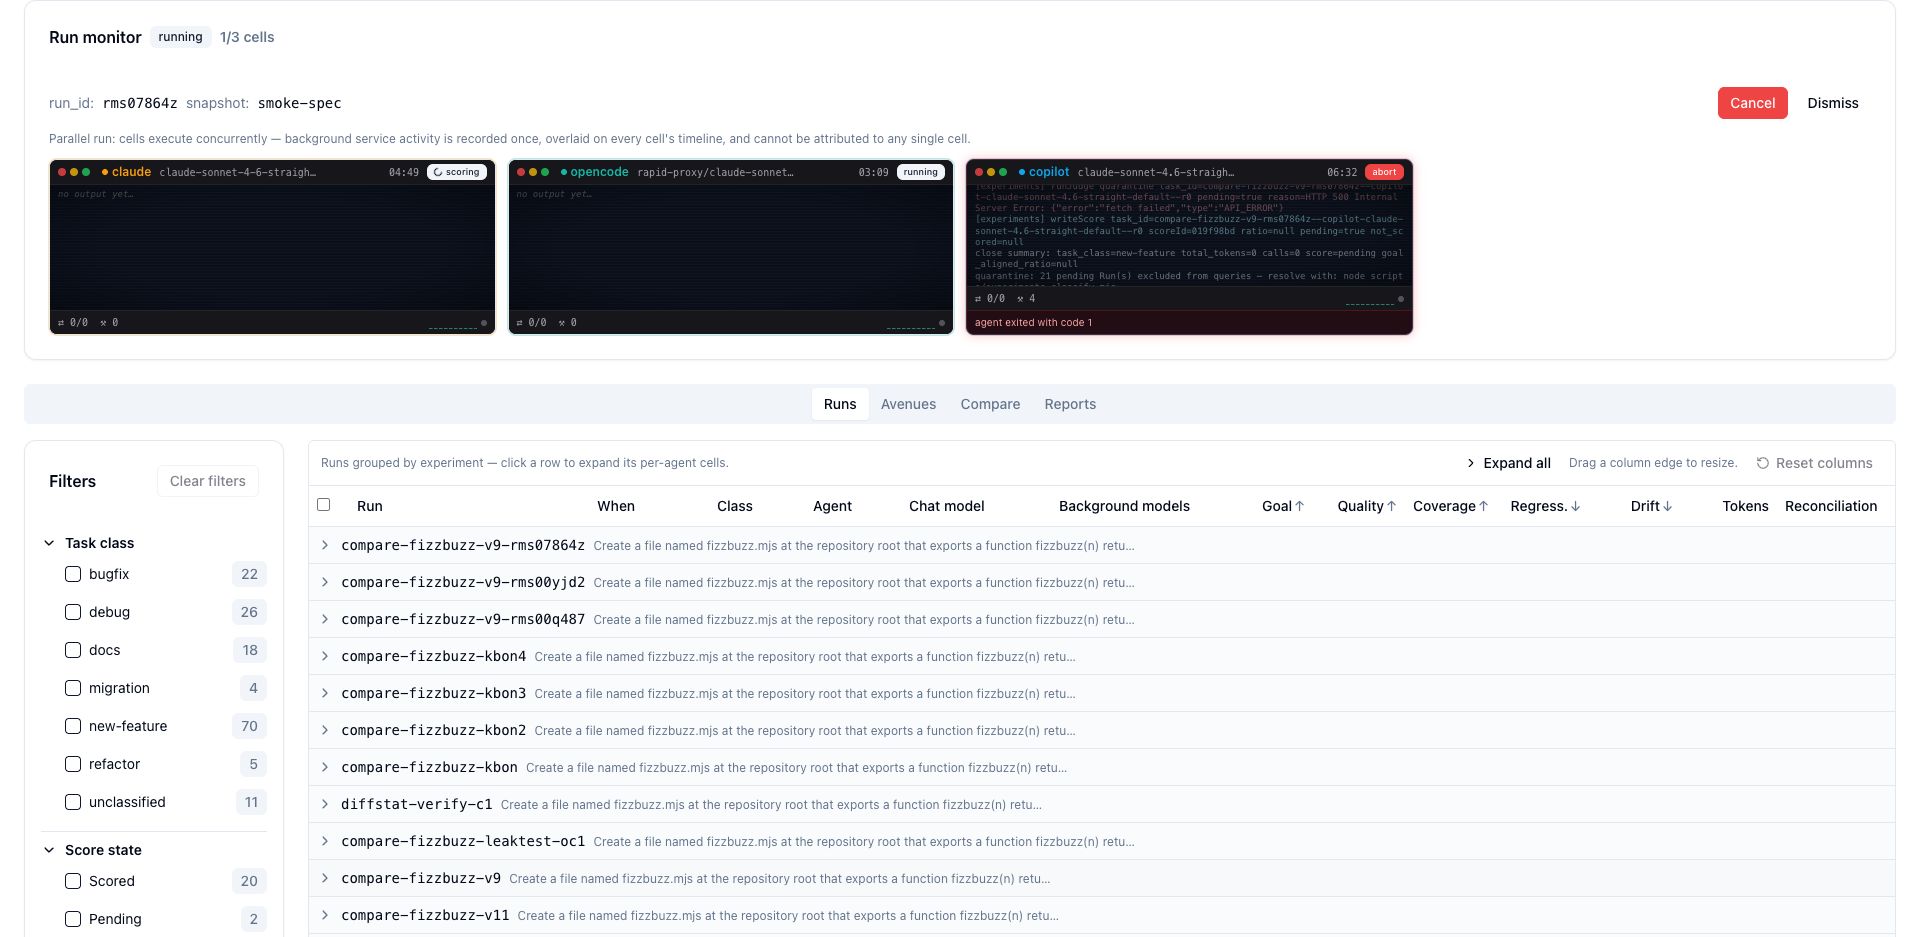
Click any terminal to zoom in. The tile FLIP-animates into a near-fullscreen terminal with a readable, scrollable log, the full task_id, a Show in timeline jump, and (for a parallel run) the shared-background disclaimer. Esc or a backdrop click shrinks it back.
Run experiments UNATTENDED
In serial mode there is a single global measurement span slot and a shared host proxy: a concurrent in-repo agent LLM call gets mis-stamped with the open cell's task_id. In parallel mode there is no global slot to mis-stamp, but opencode goes unmeasured (above). Either way, never drive a matrix from an interactive agent working the same repo.
Runs tab
Runs are grouped by experiment-run — one collapsible parent per experiment (see experiment-RUN id), each showing a goal summary, agent chips, cell count, and total tokens. Non-experiment sessions collapse into a pinned "Other activity — ambient (auto-measured) sessions" bucket. Expand all / Collapse all toggles every group.
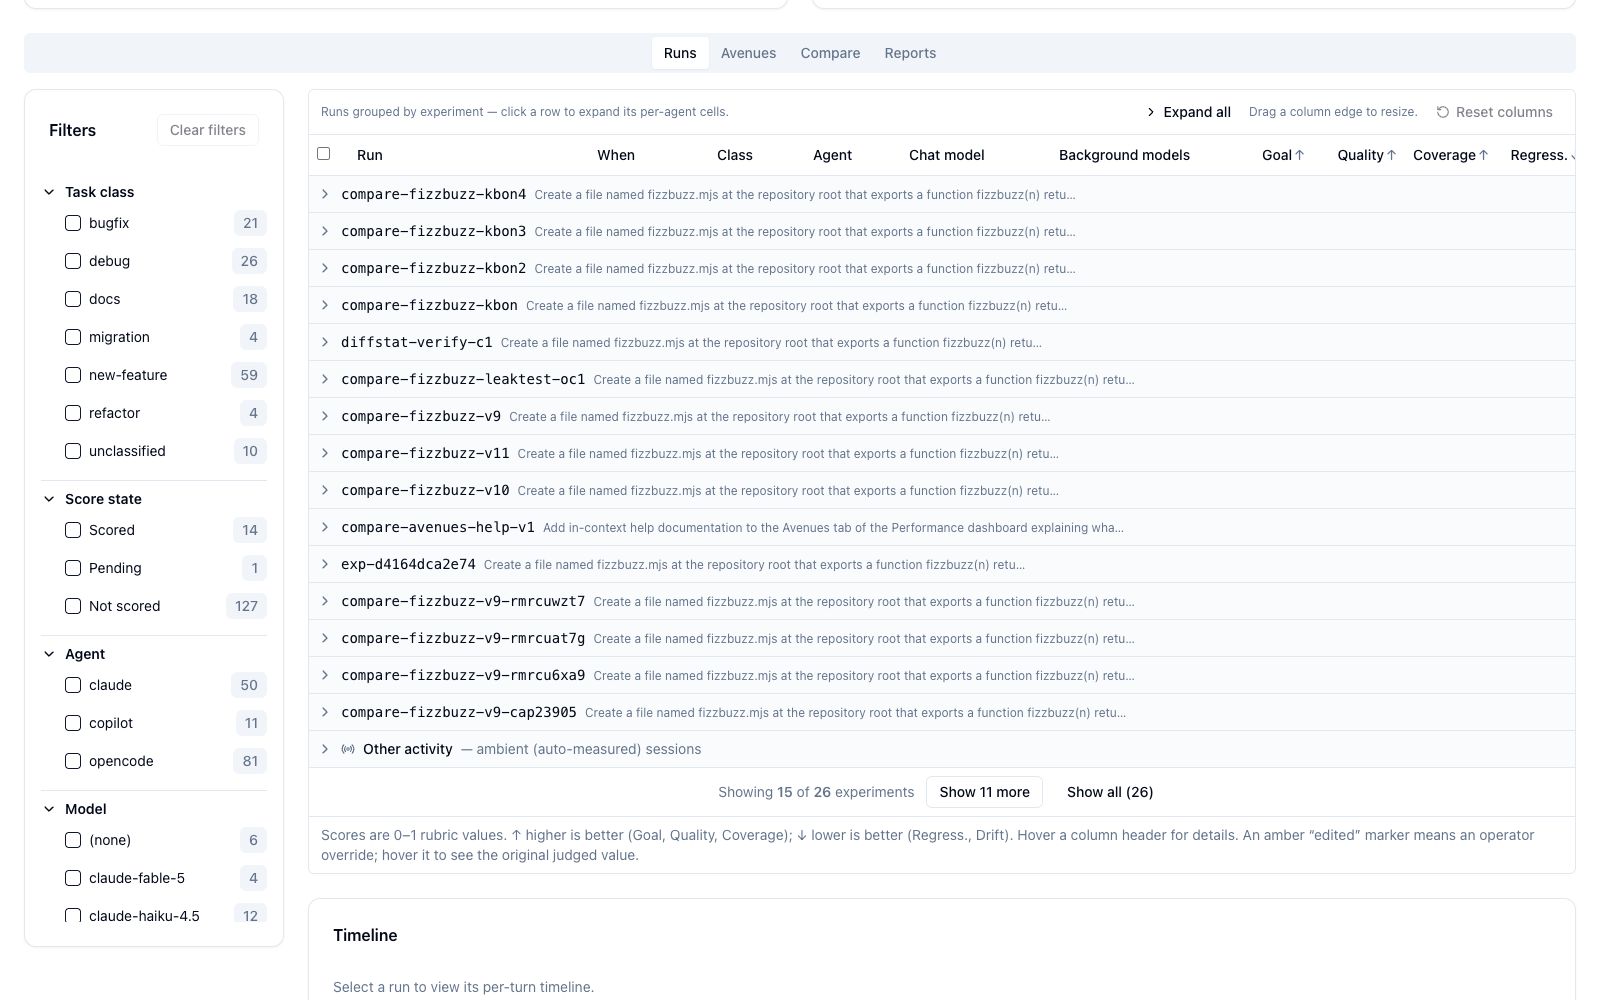
Expanded, each parent reveals its per-agent child cells with their composite task_id and scores:
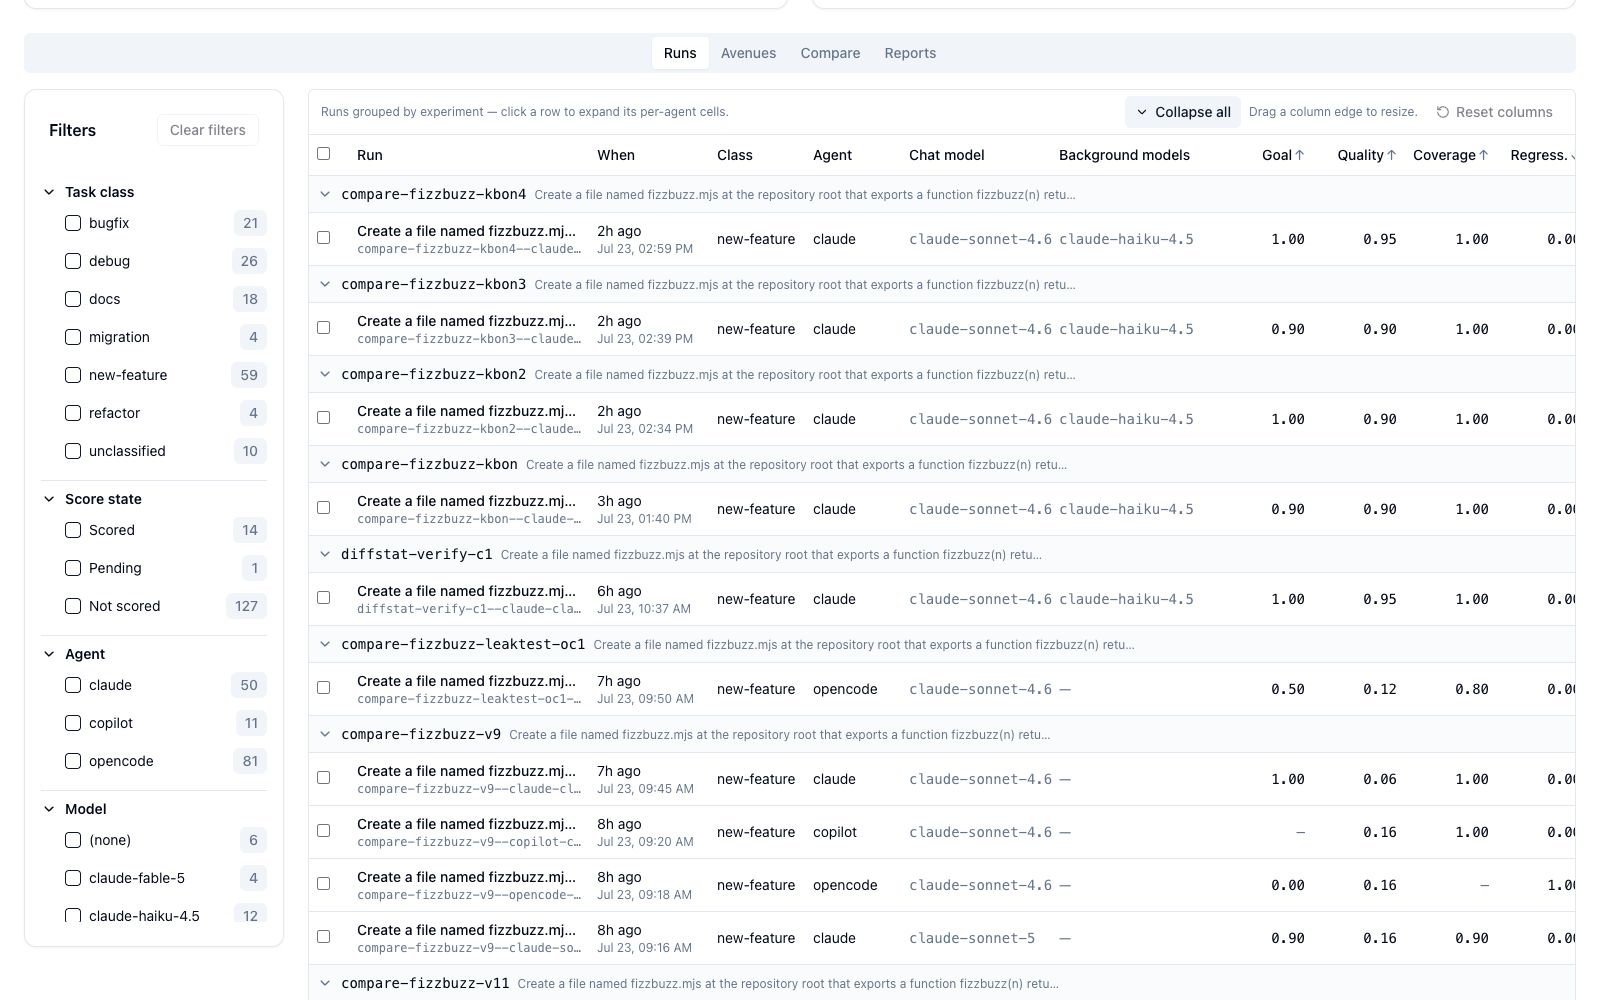
Runs table columns
| Column | Shows | Notes |
|---|---|---|
| (select) | Row checkbox | Header selects all; drives Compare selected (2) |
| Run | goal_sentence (bold) + task_id (mono, muted) | task_id only when no goal |
| When | Relative age + absolute date, or "running Nm" | Turns amber "· stuck?" when a run is open > 20 min |
| Class | task_class | "unclassified" (muted) when null |
| Agent | claude / opencode / copilot / pi | em-dash if null |
| Chat model | Normalized canonical_model | italic "unmeasured" when empty |
| Background models | Distinct background models for the cell | em-dash if none |
| Goal ↑ · Quality ↑ · Coverage ↑ · Regress. ↓ · Drift ↓ | The 5-dim rubric (0–1) | null renders "—", never 0 — see glossary |
| Tokens | input + output + cache | Compare within an agent, not across |
| Reconciliation | Token-reconciliation badge | reconciled / transcript-fallback / Δ discrepancy |
| Actions | Re-run · Fork into avenues · Explain · Edit scores | Re-run + Fork only on completed experiment runs |
Footer legend (verbatim): "Scores are 0–1 rubric values. ↑ higher is better (Goal, Quality, Coverage); ↓ lower is better (Regress., Drift). Hover a column header for details. An amber 'edited' marker means an operator override; hover it to see the original judged value."
Score-dimension glossary
The 5 rubric dimensions (SCORE_DIMENSIONS: goal_achieved, code_quality, test_coverage, regressions, spec_drift). Hover any header for the definition — reproduced here verbatim:
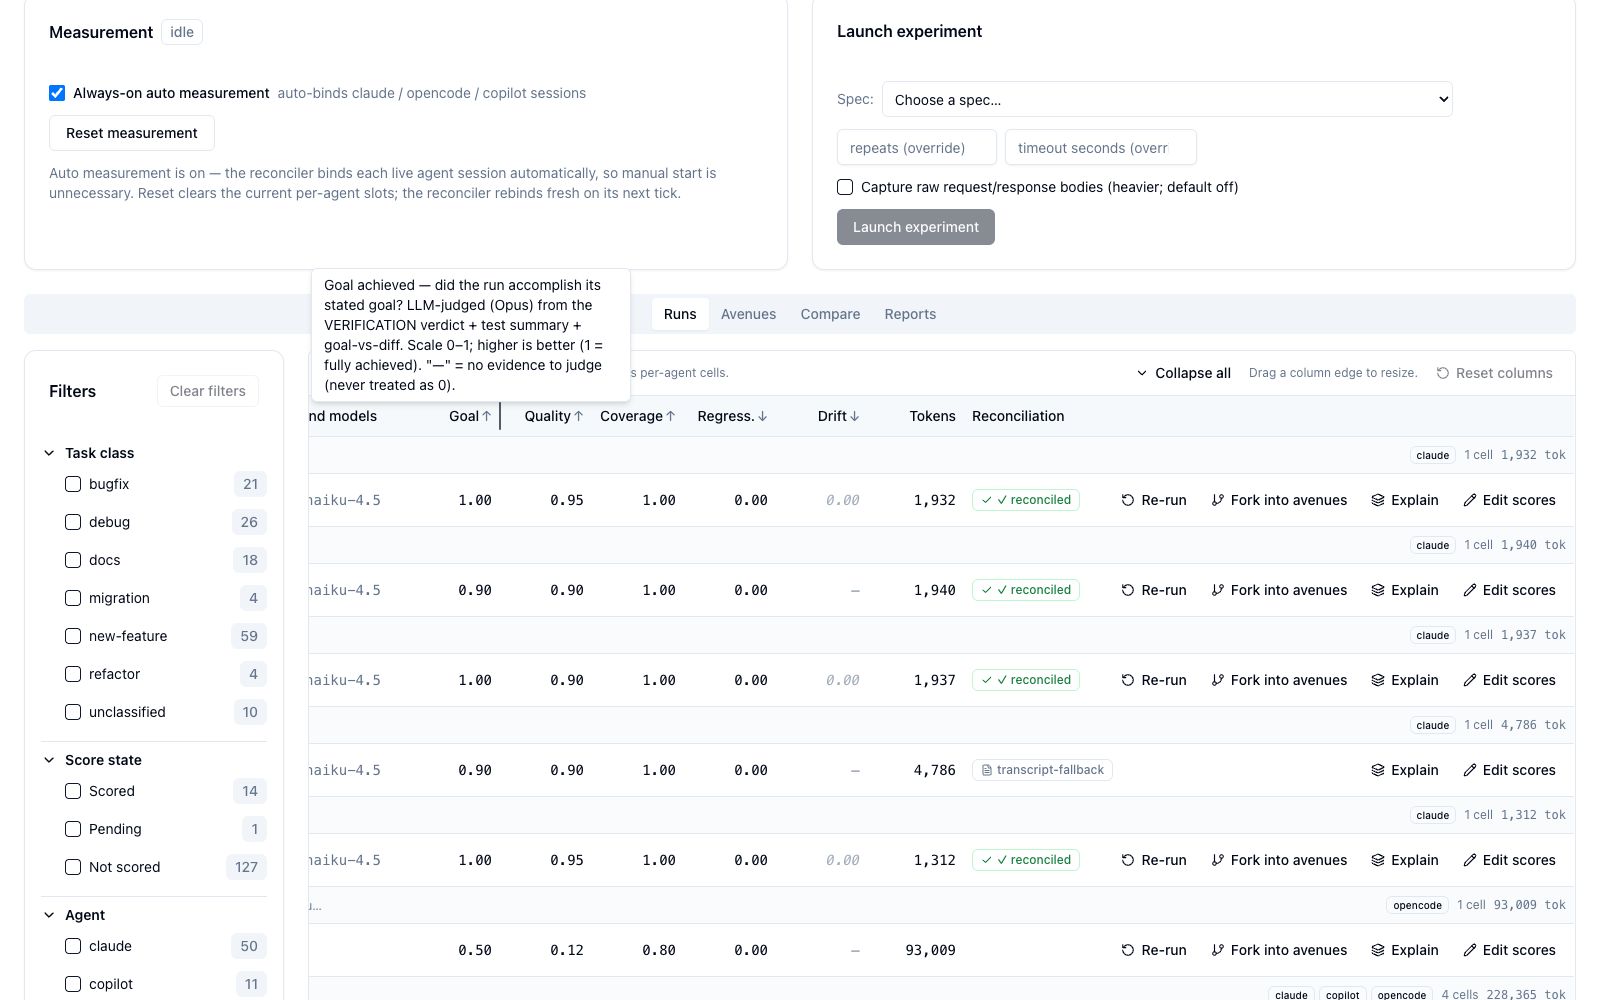
- Goal ↑ — "Goal achieved — did the run accomplish its stated goal? LLM-judged (Opus) from the VERIFICATION verdict + test summary + goal-vs-diff. Scale 0–1; higher is better (1 = fully achieved). '—' = no evidence to judge (never treated as 0)."
- Quality ↑ — "Code quality of the result — LLM-judged from diff size + code-review findings. Scale 0–1; higher is better. '—' = no code evidence available (e.g. the diffstat did not capture the change). NOTE: the judge never sees file contents, so this is a coarse signal."
- Coverage ↑ — "Test coverage of the change — judged from test pass-rate + new-tests-for-new-code ratio. Scale 0–1; higher is better. <1 is usually an evidence-completeness discount (judge could not fully confirm), not a specific missing test. '—' = no test evidence."
- Regress. ↓ — "Regressions introduced — tests that broke and were NOT introduced by this run. Binary 0 or 1; lower is better (0 = none). '—' = no evidence."
- Drift ↓ — "Drift from the spec/intent (divergence from the PLAN.md task list, else the goal sentence). Scale 0–1; lower is better (0 = on-spec). '—' = null (no plan to diverge from — the common case for freeform goals)." Plus the experiment-cell note: "For experiment cells (freeform goals, no PLAN.md task list) Drift mirrors Goal — it is not an independent signal, so it is shown muted here."
Hovering a score value shows the dimension value, its definition, and "Why this run scored this: <rationale>" (Goal uses the ratio rationale; the others use the rubric rationale):
Tokens column — read it right
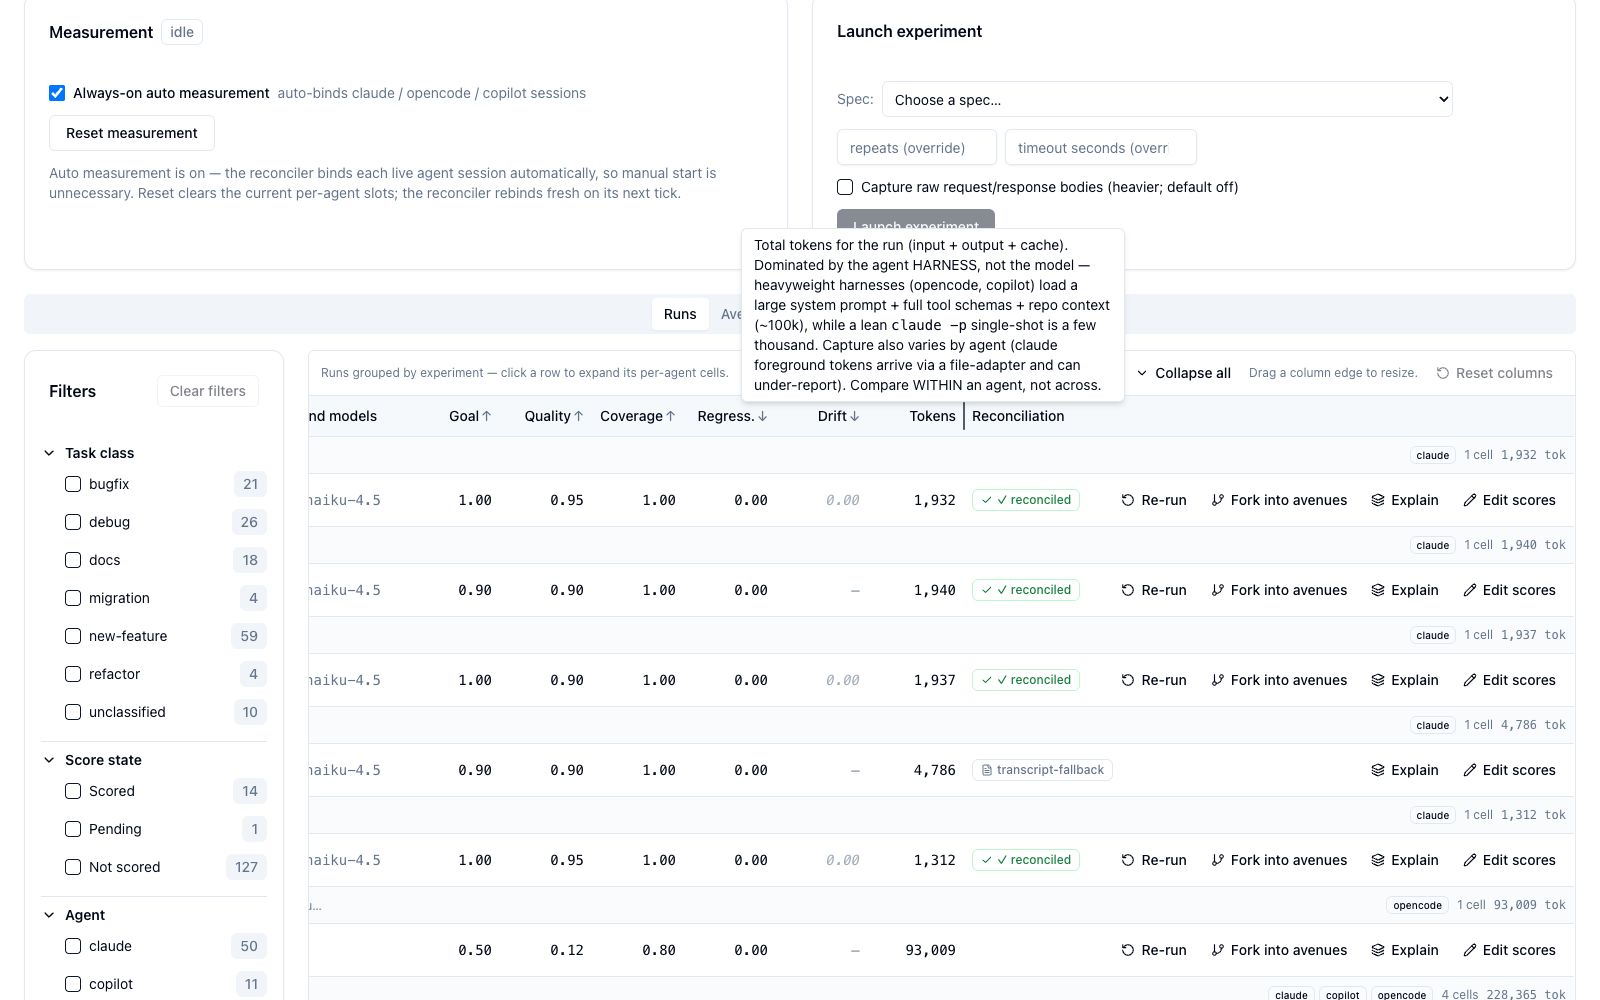
Hover the Tokens header: "Total tokens for the run (input + output + cache). Dominated by the agent HARNESS, not the model — heavyweight harnesses (opencode, copilot) load a large system prompt + full tool schemas + repo context (~100k), while a lean claude -p single-shot is a few thousand. Capture also varies by agent (claude foreground tokens arrive via a file-adapter and can under-report). Compare WITHIN an agent, not across." Per-row: "A suspiciously small claude number can be a foreground-capture gap, not a real efficiency win."
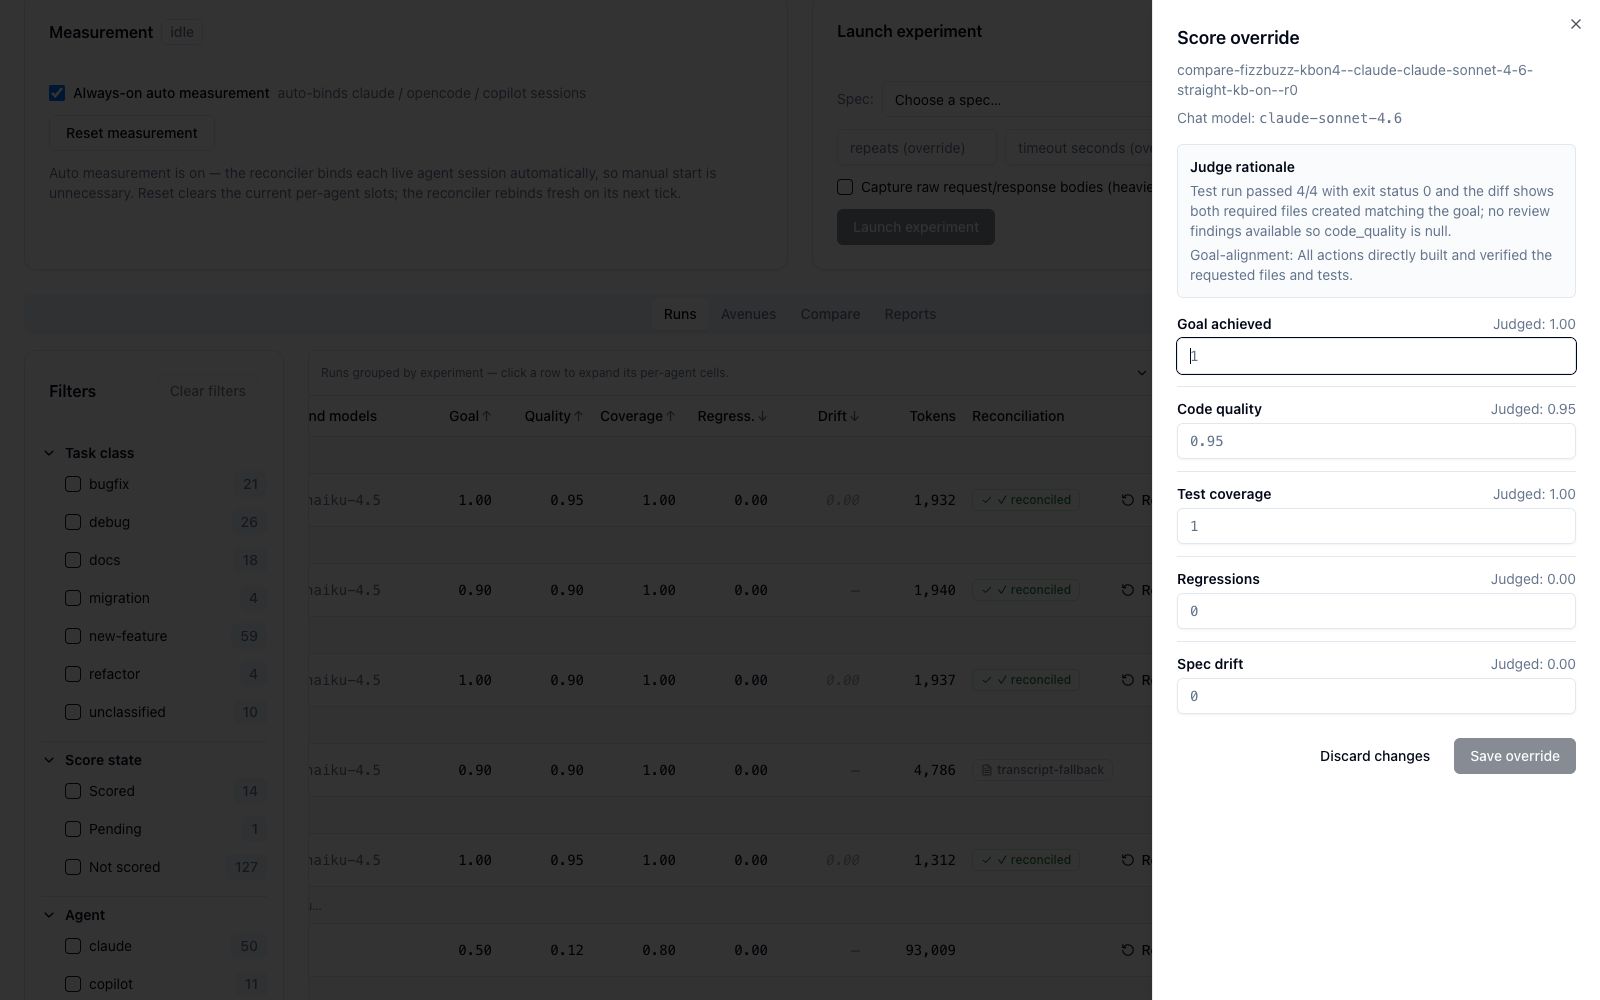
Editing a score (operator override)
Edit scores opens the override drawer. Each dimension shows its Judged: X value and an editable field; the Judge rationale panel explains the auto-score. A saved override sets the amber "edited" badge (hover shows "Judged (before your edit): <value>"); effective() uses corrected_* → judged → null.
Avenues tab
An avenue is one variant of the same starting prompt, run on its own isolated git branch (avenue/<task-id>, backed by a worktree). Forking a span runs that prompt across agents, models, frameworks, or knowledge-injection on vs off — every avenue of one origin span is grouped into a single ranked table.
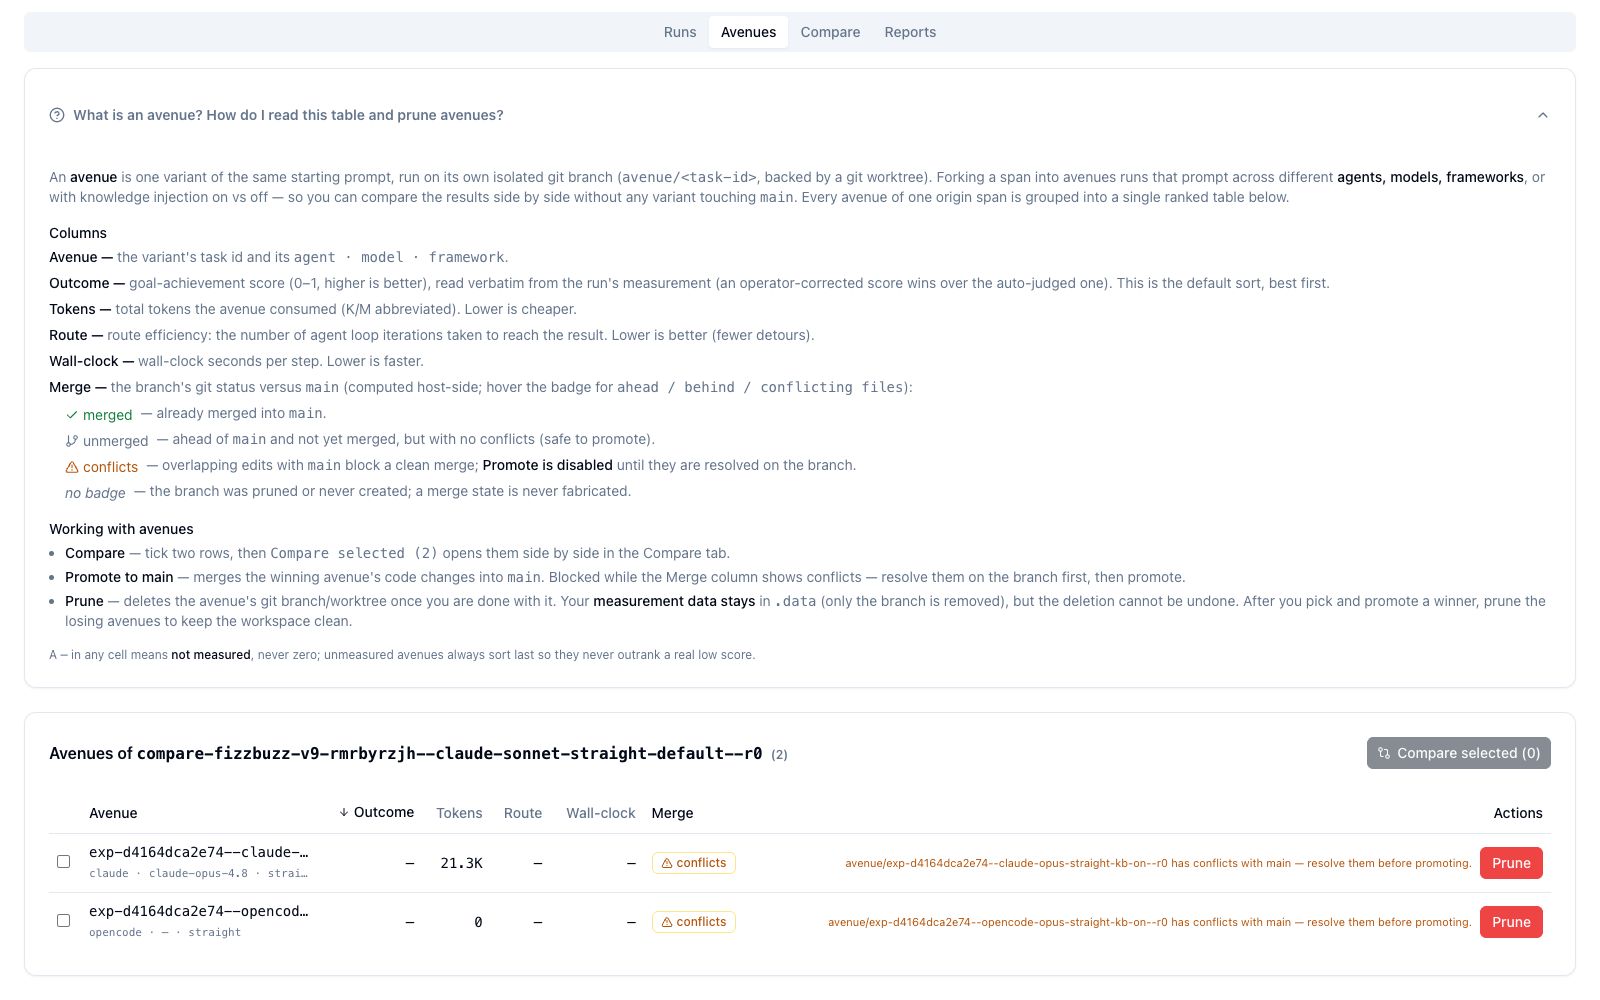
The built-in help card (surfaced here) defines every column and action:
- Avenue — the variant's task id and its
agent · model · framework. - Outcome — goal-achievement score (0–1, higher is better), read verbatim from the run's measurement (an operator-corrected score wins over the auto-judged one). Default sort, best first.
- Tokens — total tokens the avenue consumed (K/M abbreviated). Lower is cheaper.
- Route — route efficiency: agent loop iterations to reach the result. Lower is better.
- Wall-clock — wall-clock seconds per step. Lower is faster.
- Merge — the branch's git status vs
main(hover for ahead/behind/conflicting files): ✓ merged (already merged), unmerged (ahead, no conflicts — safe to promote), ⚠ conflicts (overlaps block a clean merge — Promote disabled until resolved), no badge (pruned or never created — a merge state is never fabricated). - A — in any cell means not measured, never zero; unmeasured avenues always sort last.
Working with avenues: Compare (tick two → Compare tab), Promote to main (merges the winner; blocked while conflicts show — "avenue/<taskId> has conflicts with main — resolve them before promoting."), Prune (deletes the branch/worktree — "Measurement data stays in .data — only the branch is removed. This cannot be undone.").
Compare tab
Two sections. Two-run comparison contrasts any two runs by role; Experiment variant comparison is the ranked variant matrix for one experiment.
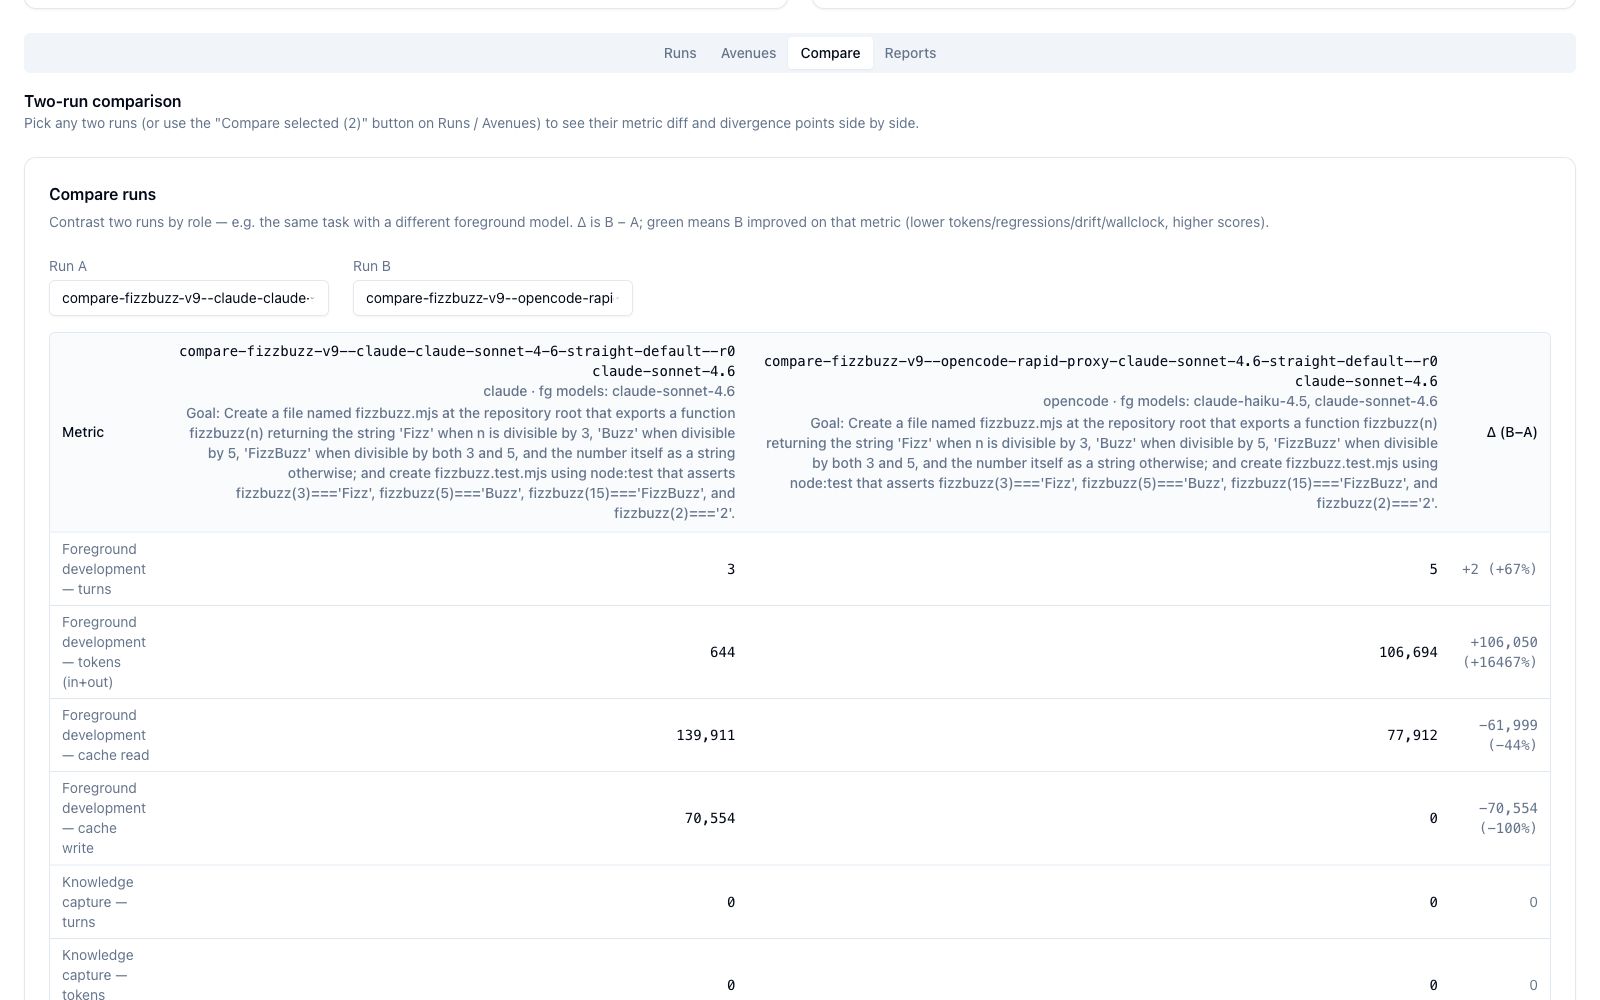
Two-run comparison (RunCompare)
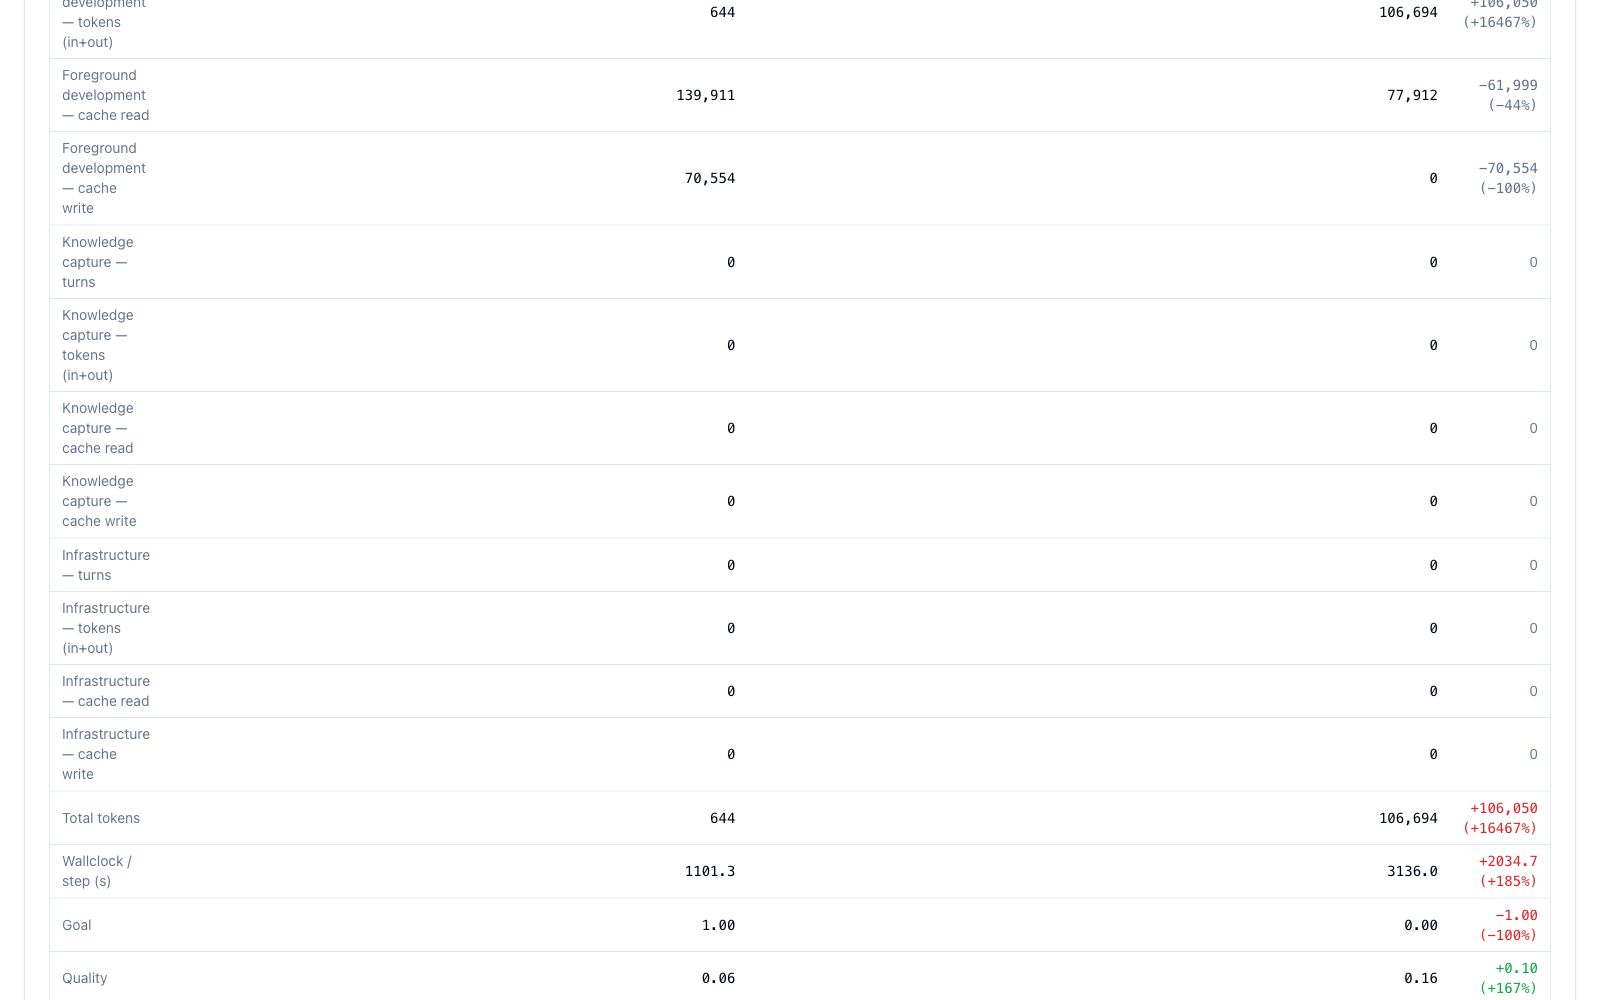
"Contrast two runs by role — e.g. the same task with a different foreground model. Δ is B − A; green means B improved on that metric (lower tokens/regressions/drift/wallclock, higher scores)." Rows break tokens down by role (foreground / knowledge / infrastructure) × turns / tokens / cache read / cache write, then Total tokens, Wallclock/step, and the 5 score dims.
The lower half surfaces the outcome deltas (Goal, Quality, Wallclock) with green/red direction coloring:
A companion Difference viewer aligns the two runs by request signature, collapses the identical prefix, and starts at the first divergence — "how the different decisions cost more or fewer tokens and loops."
Experiment variant comparison (ComparisonMatrix)
"Variants as columns, metrics ± variance as rows. Ranked best-first; failed / ungated / unscored variants are shown separately and are never ranked as a winner." The honesty spine:
- RANKED — "Successful, gated & scored — sorted best composite first."
- FAILED (no successful runs) — "Gate failed or timeout/abort — never a cheap winner."
- UNGATED — "No test_command — shown, not ranked."
- UNSCORED — "Successful & gated but null/zero rubric — shown, not ranked."
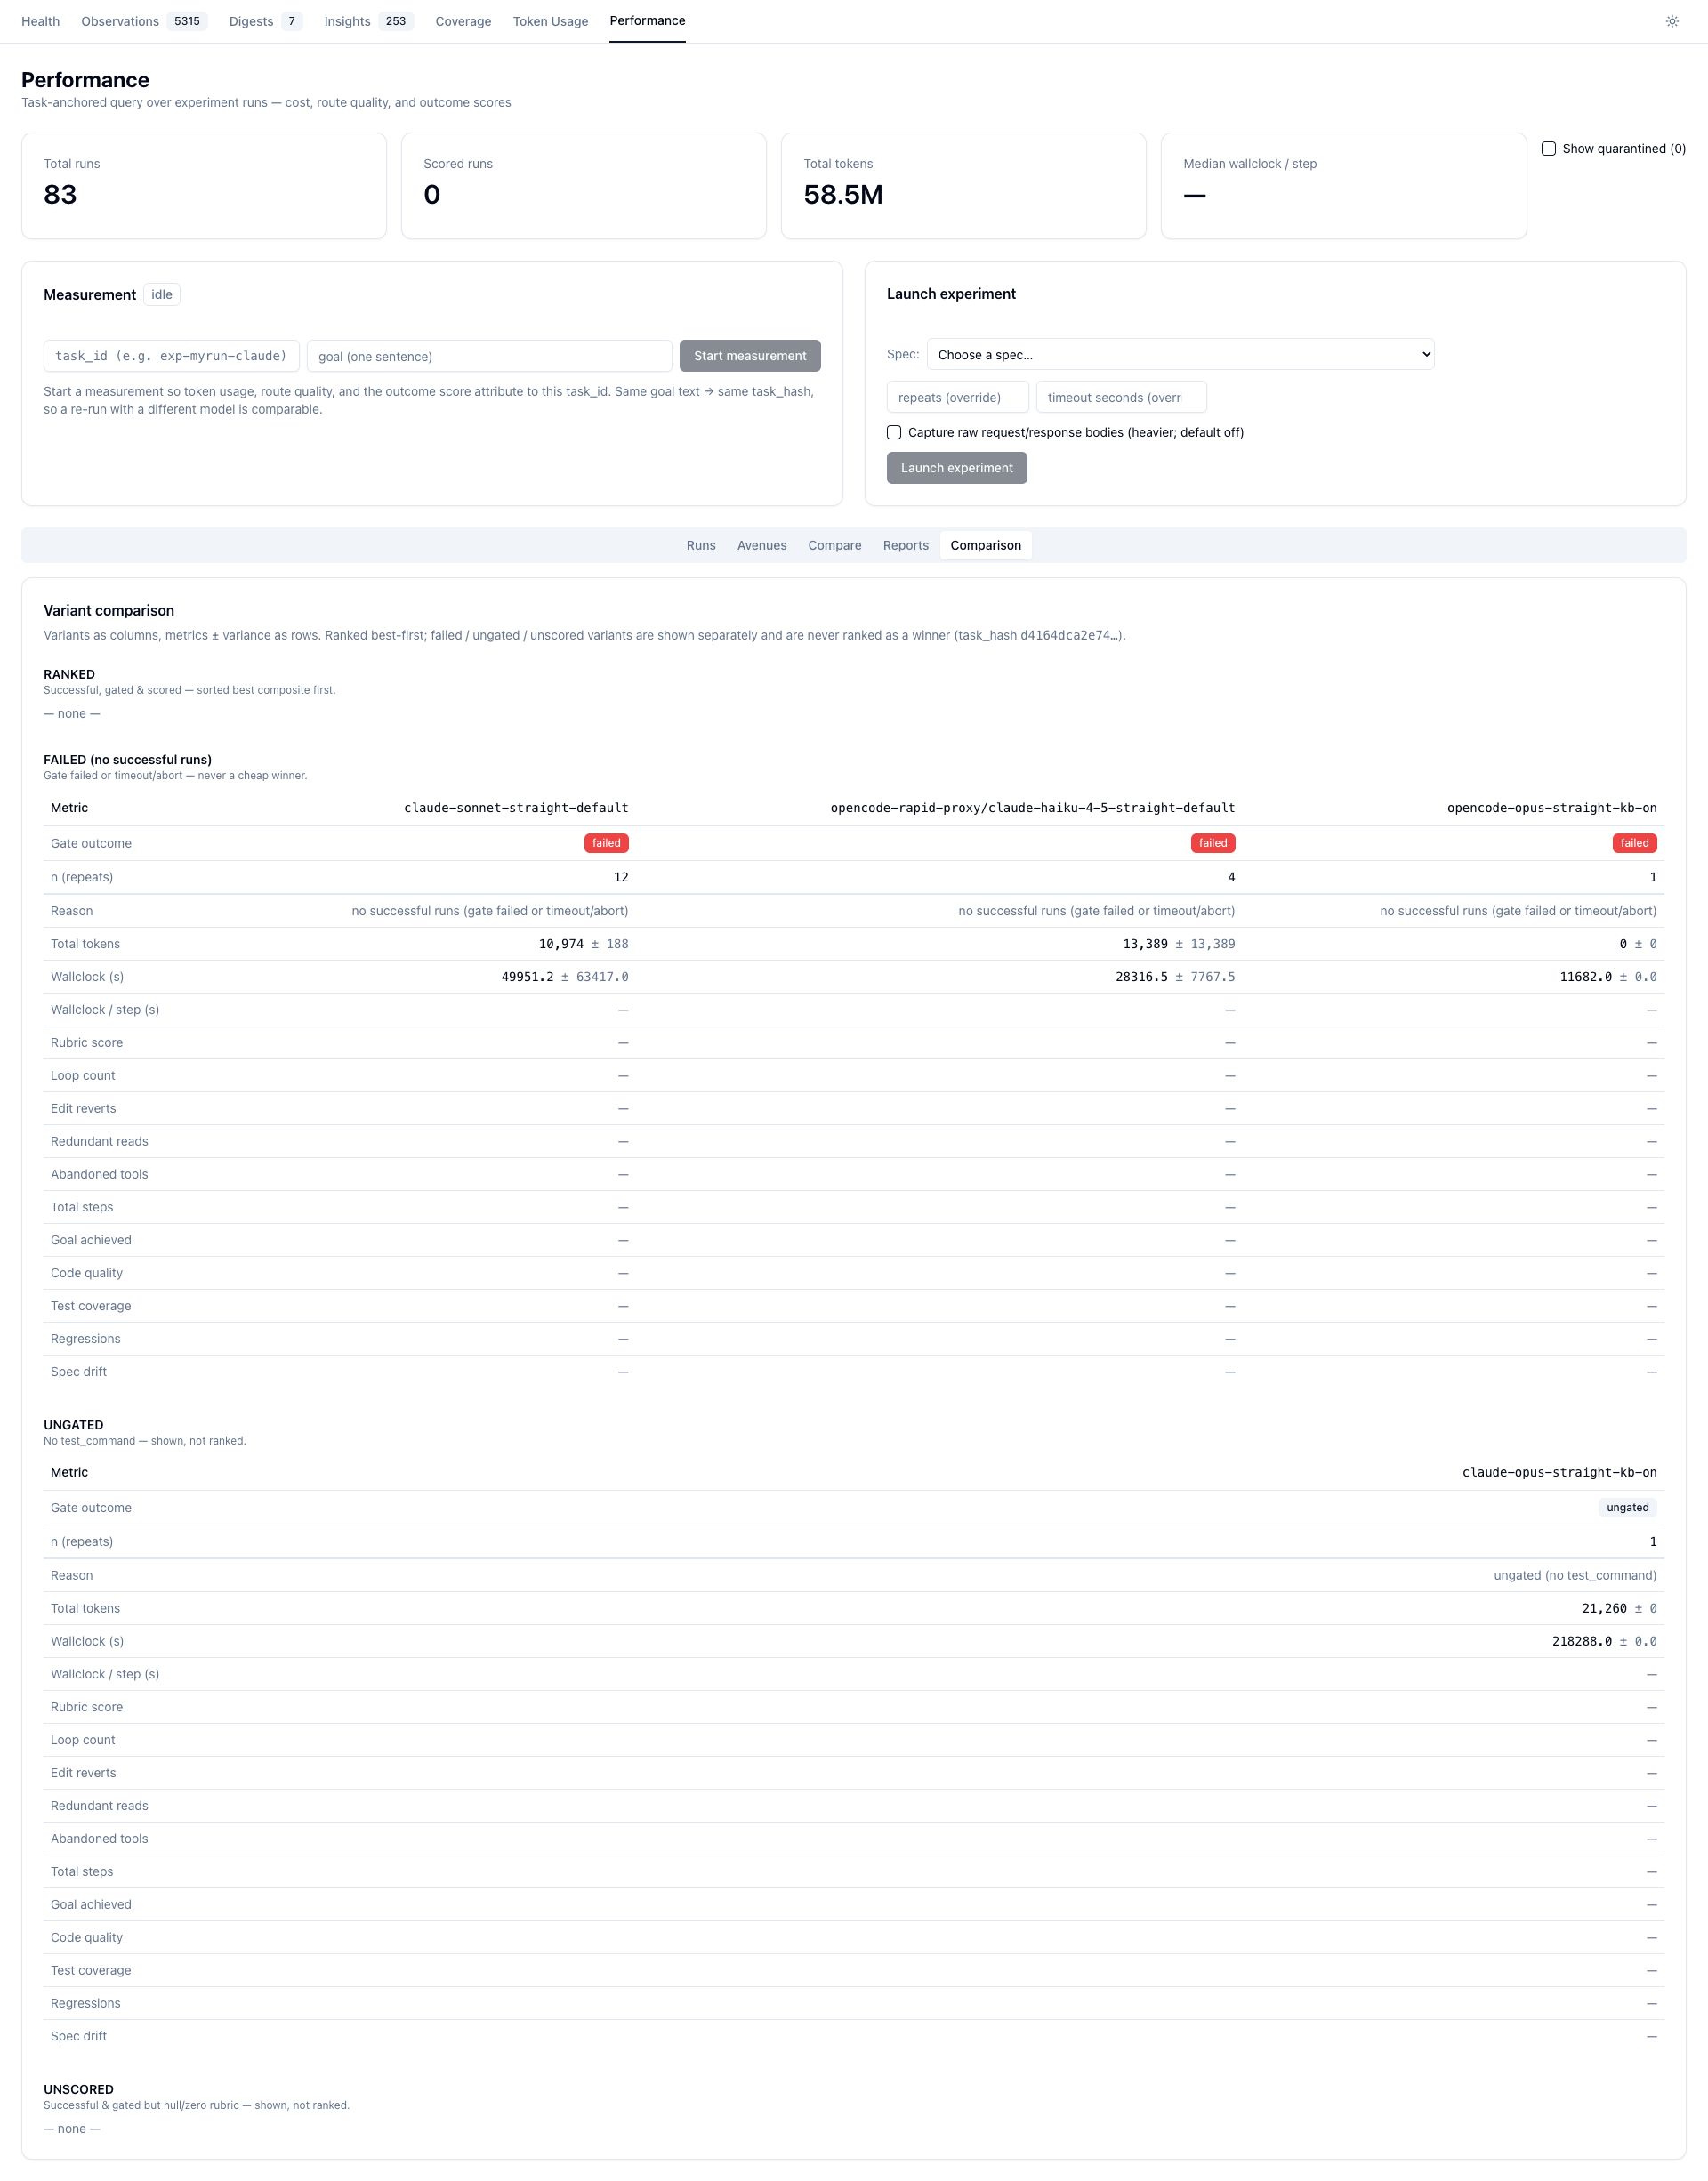
Metric rows: Total tokens, Wallclock (s), Wallclock/step (s), Rubric score, Loop count, Edit reverts, Redundant reads, Abandoned tools, Total steps, Goal achieved, Code quality, Test coverage, Regressions, Spec drift — each mean ± stddev (hover a cell for median / min·max / n).
Reports tab
Save report freezes the current facet-state + rows into a snapshot that never re-queries; Refresh snapshot re-runs it deliberately. Use it to pin a comparison you want to cite later.
Timeline
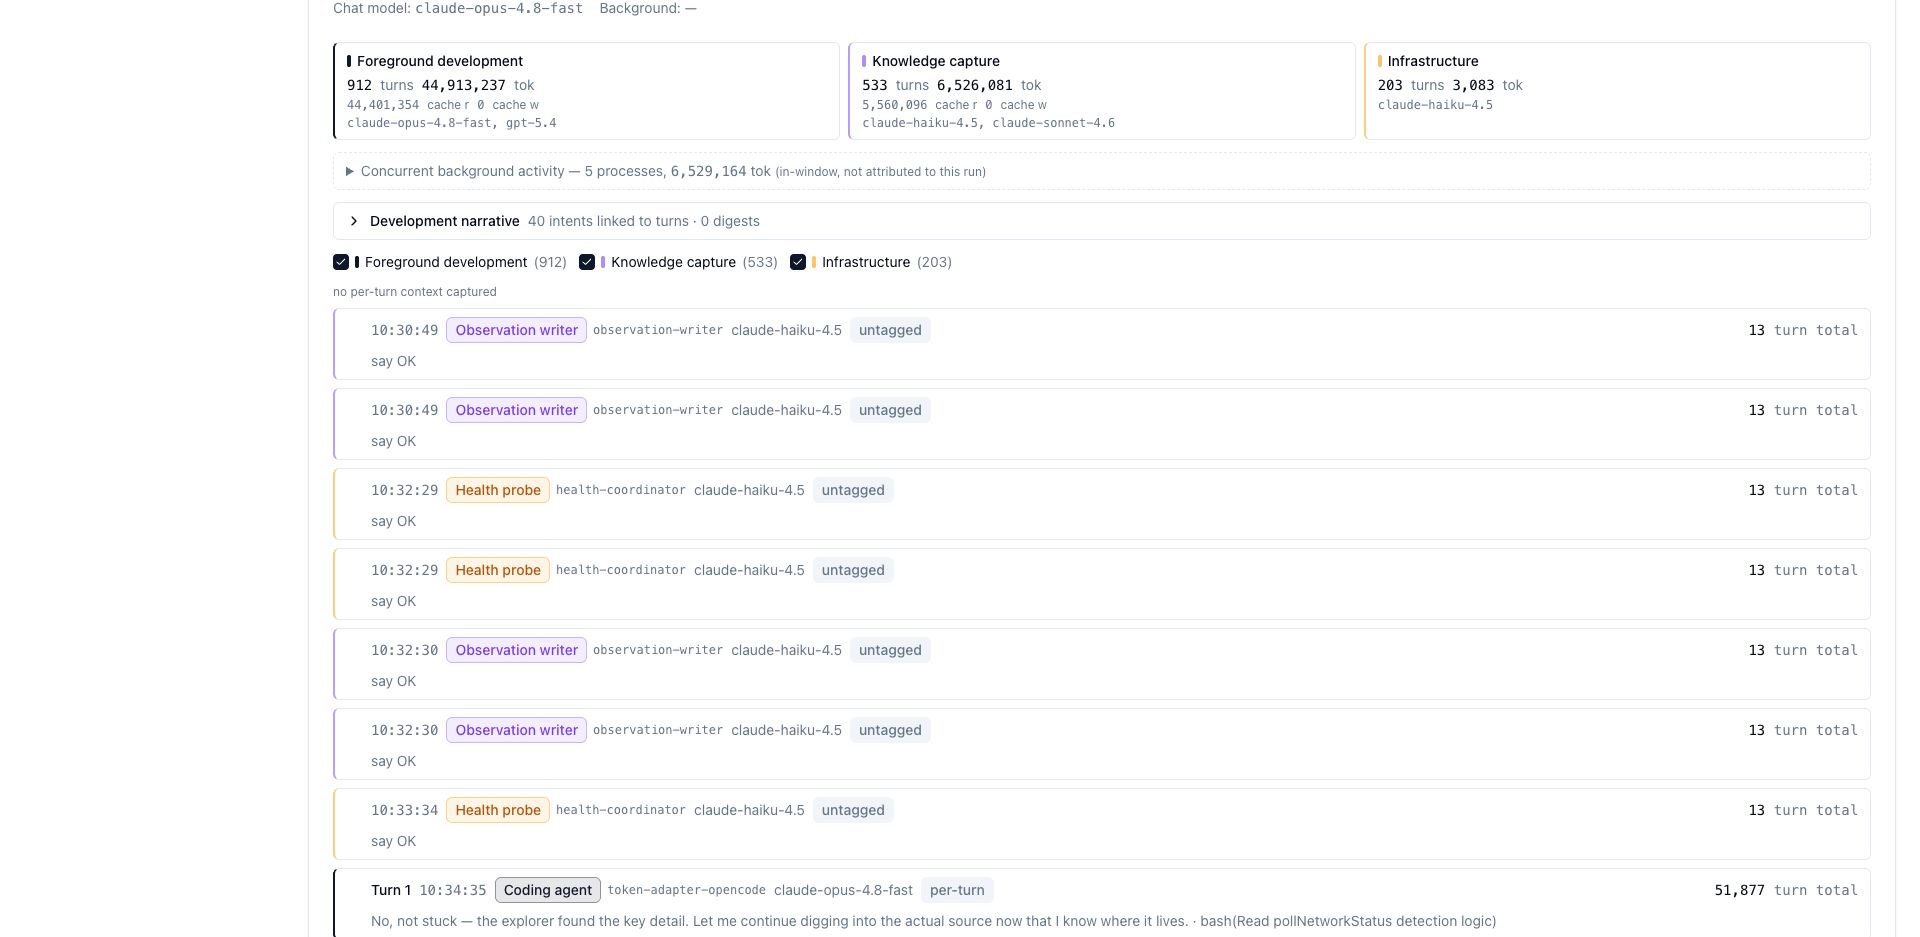
Selecting a run loads its per-turn timeline below the Runs table. Turns are chronological and colored by role — foreground development, knowledge capture, infrastructure — with role-filter chips to isolate a lane. Each turn shows its fresh in/out tokens and a cache split (cache-read hatched); process pills carry a glossary on hover.
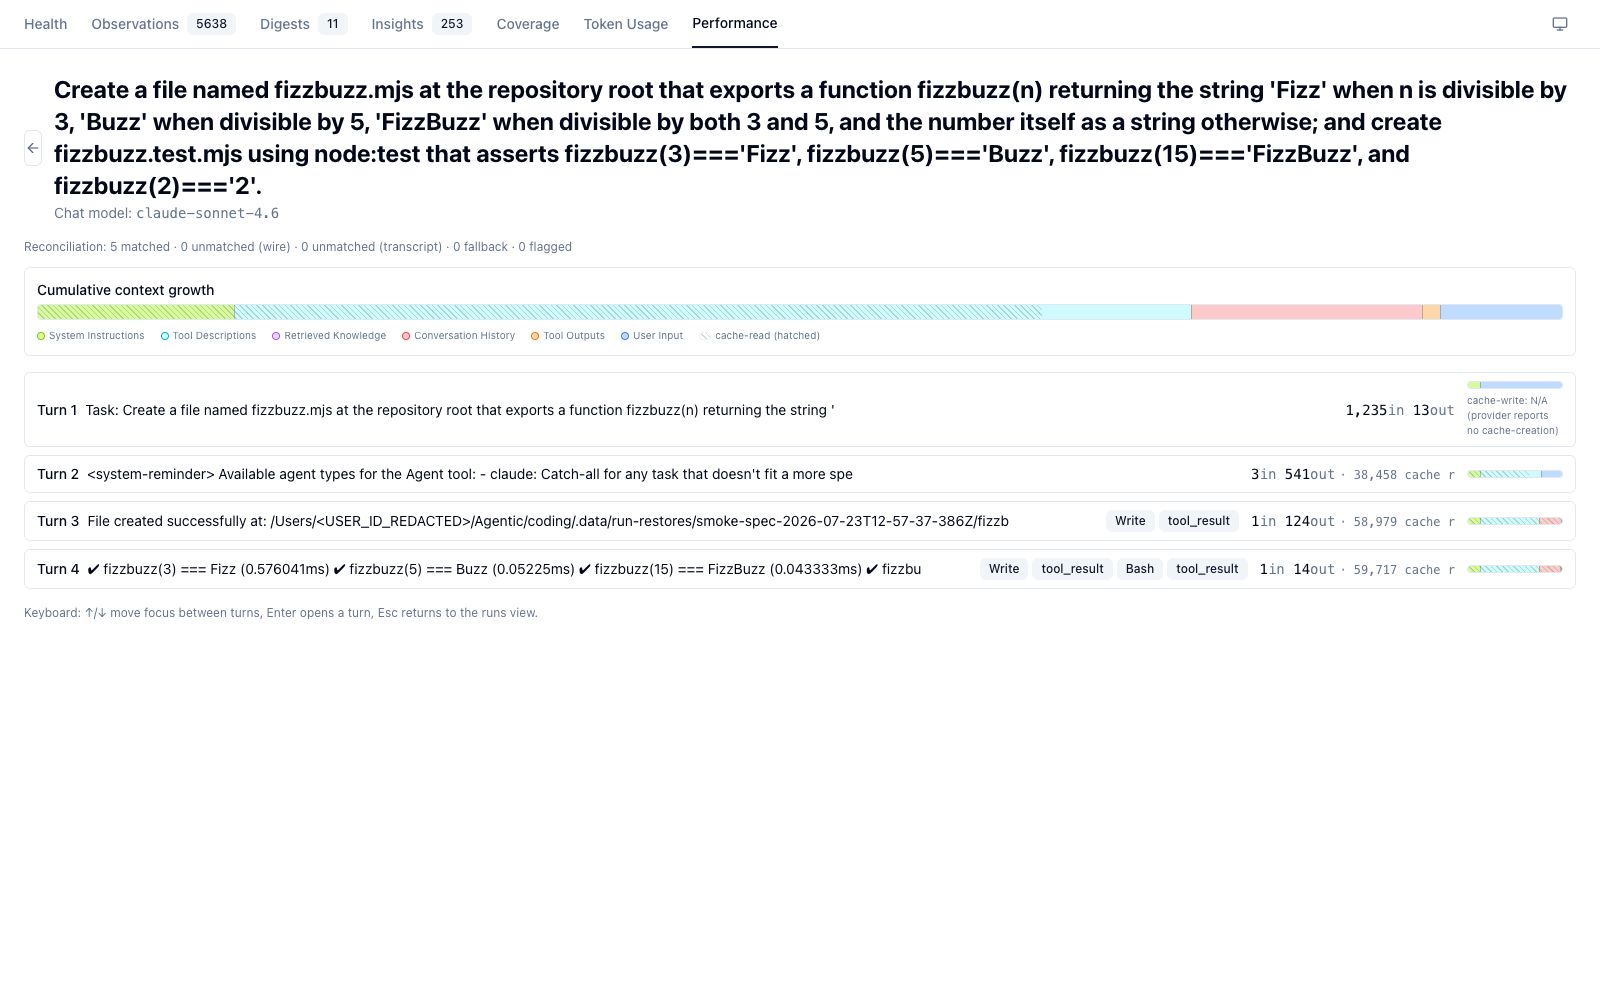
The fullscreen timeline (/performance/timeline/:taskId) adds the reconciliation summary and a Cumulative context growth band with the full category legend:
Reasoning tokens are estimated
"Claude does not report reasoning tokens natively (thinking is folded into output tokens); this value is estimated from the thinking text" — and is "a subset already counted in the turn's output, not additive."
Context & Caching explainer
Explain on any run opens "Context & caching — what actually gets sent to the LLM" — the anatomy of the context window measured from real wire bytes.
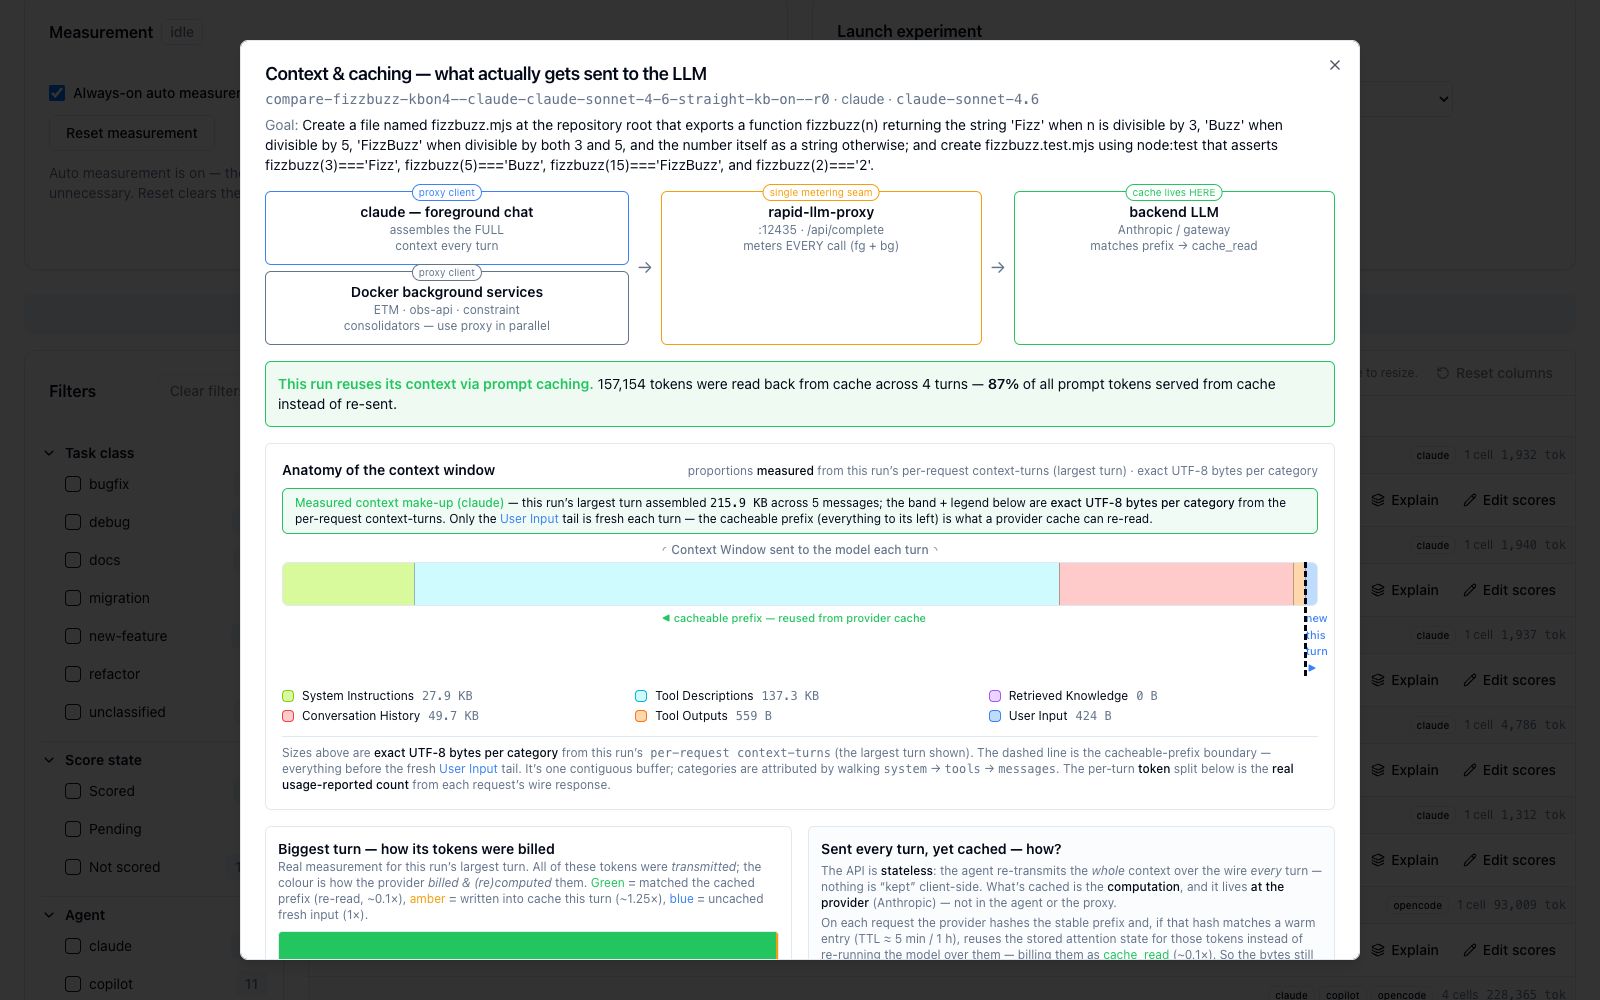
- Topology strip —
agent foreground chat→rapid-llm-proxy (:12435, single metering seam)→backend LLM (cache lives HERE), plus Docker background services. - Anatomy band — one turn's full context window as exact UTF-8 bytes per category: System Instructions, Tool Descriptions, Retrieved Knowledge, Conversation History, Tool Outputs, User Input. The dashed line is the cacheable-prefix boundary; only the User Input tail is fresh each turn.
The lower half is the caching detail — how the biggest turn was billed, the explicit-vs-implicit wire explanation, and the per-turn stacked bar chart:
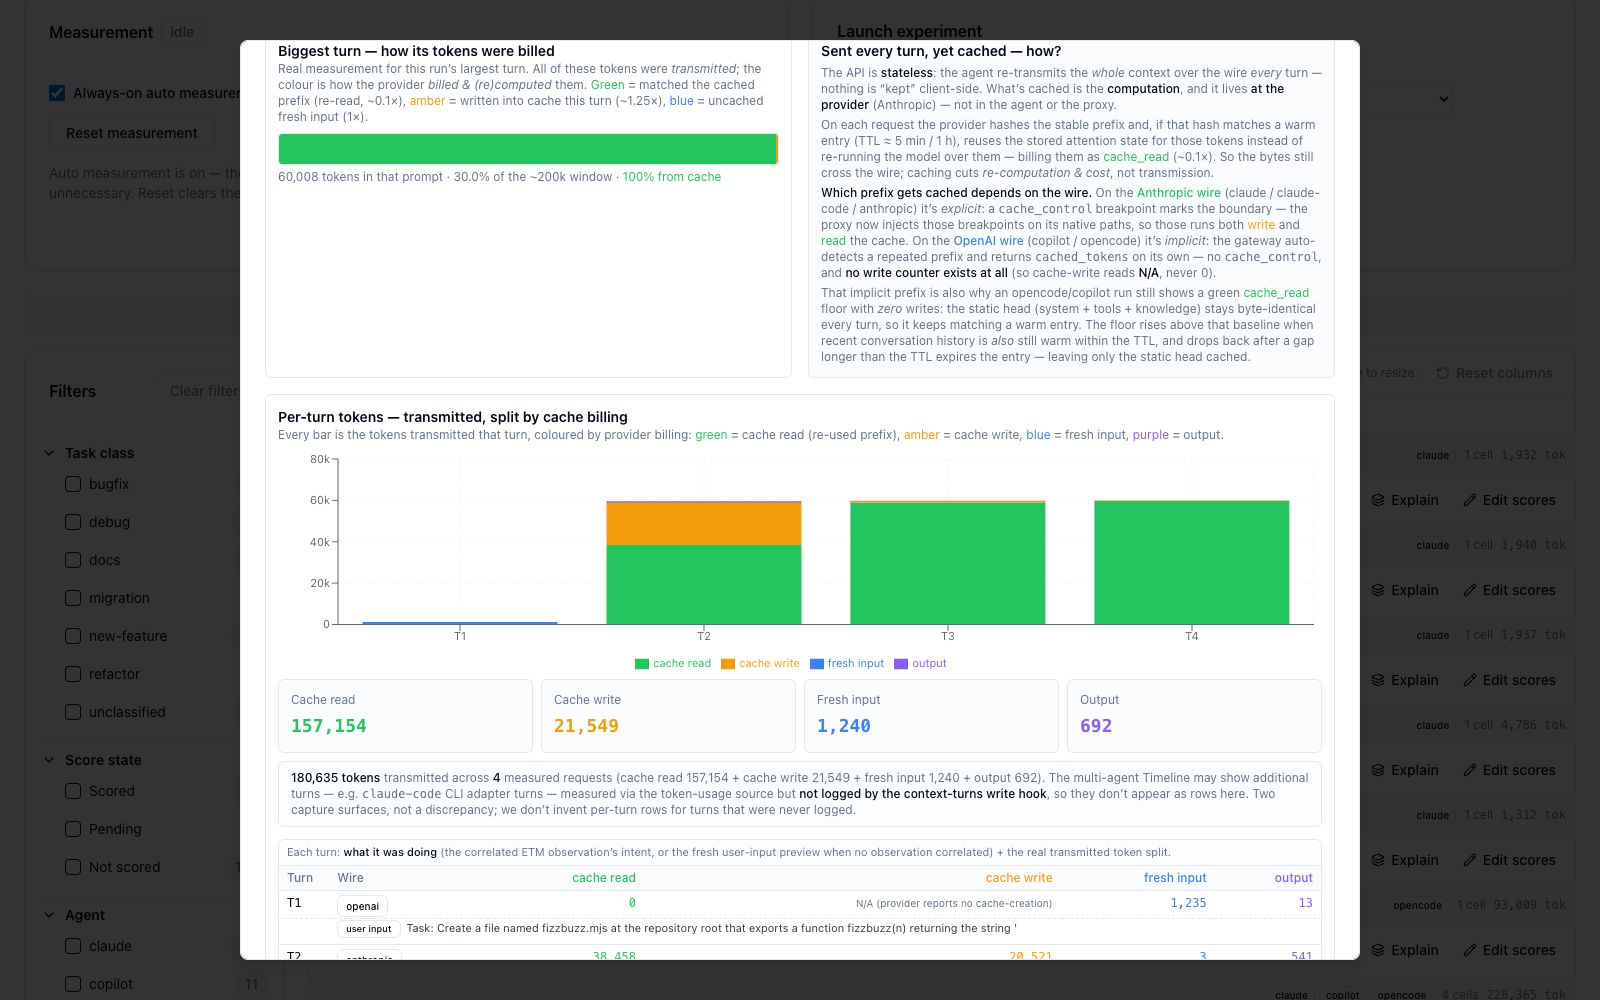
- Per-turn tokens — green = cache read, amber = cache write, blue = fresh input, purple = output.
- Cache-write N/A — "This provider's wire protocol doesn't report cache creation; we show N/A rather than a fabricated 0." (OpenAI-wire providers like copilot/opencode report
cached_tokensbut no write counter.)
Retrieved Knowledge detail
Clicking the Retrieved Knowledge segment opens the injected-context breakdown:
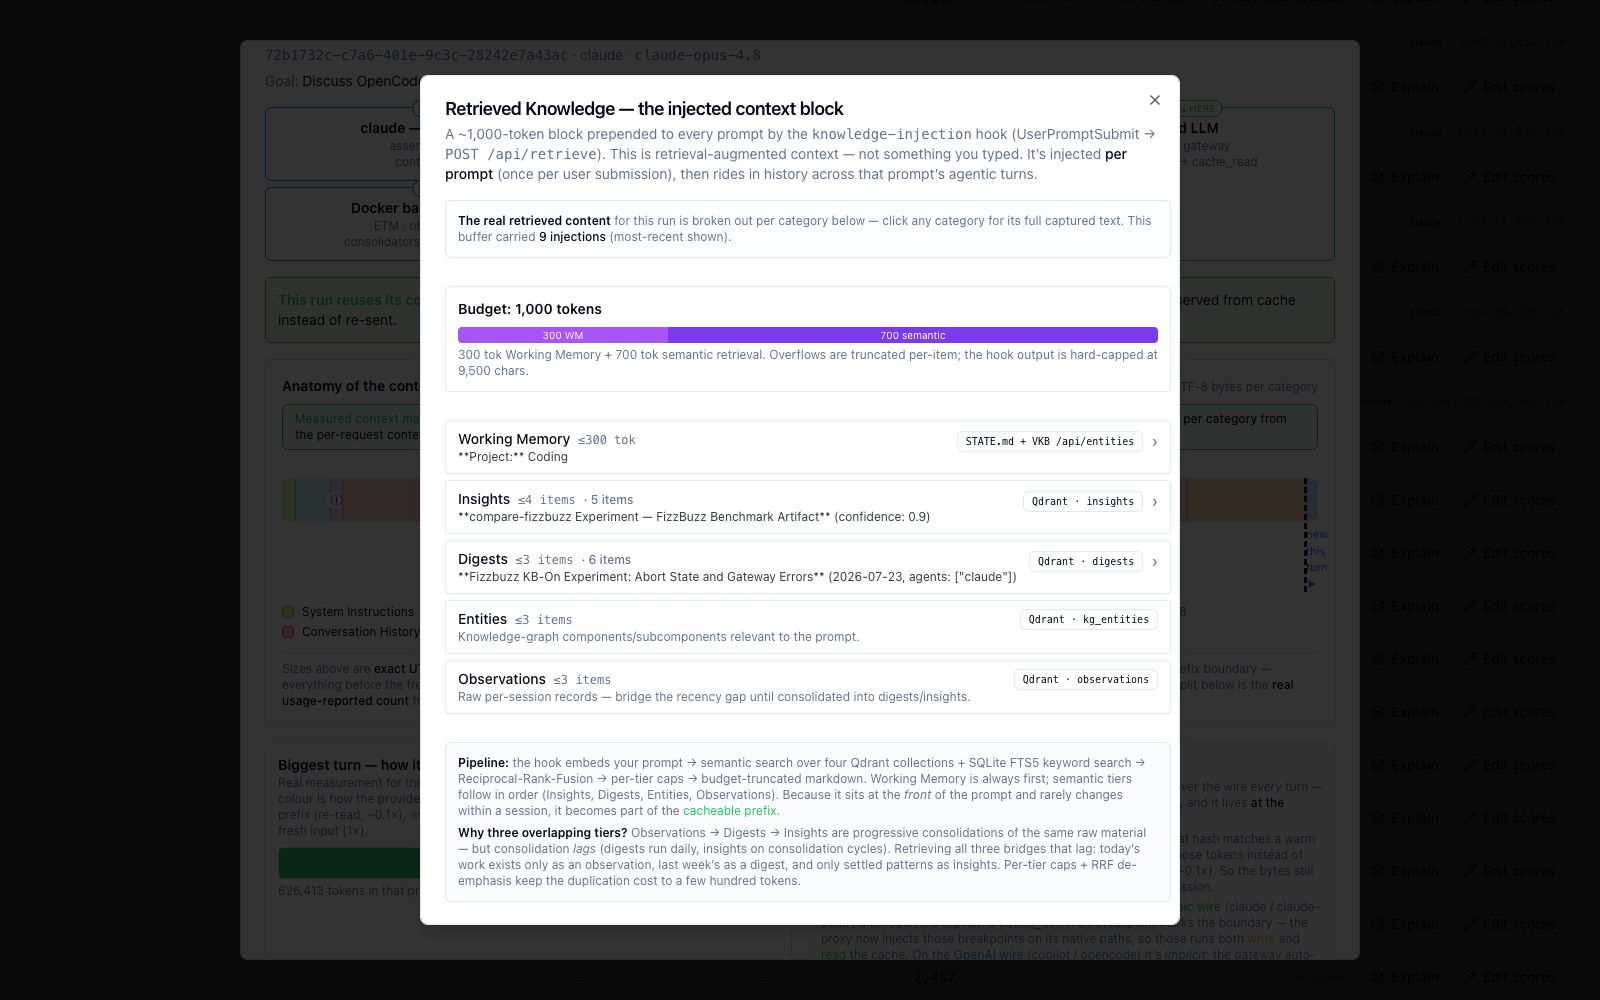
"A ~1,000-token block prepended to every prompt by the knowledge-injection hook (UserPromptSubmit → POST /api/retrieve)." Budget = 300 Working Memory + 700 semantic, retrieved via Qdrant RRF + SQLite FTS5 over four collections (Insights ≤4 · Digests ≤3 · Entities ≤3 · Observations ≤3), per-tier capped and budget-truncated. Per-item badges: cos = "Raw embedding similarity between the query and this item (Qdrant cosine)"; rel = "Final fused rank score: RRF over semantic + keyword + recency lists, × tier weight, × project/topic-overlap boosts."
A 0 B Retrieved-Knowledge block is a feature
For a trivial task (fizzbuzz) on a kb-on cell, the quality gate's LLM relevance judge rejects the topical-but-useless matches, so Retrieved Knowledge = 0 B. That empty block is the gate working, not a bug — see Knowledge-injection axis.
Badges & status glossary
| Badge | Meaning |
|---|---|
| Measurement active / idle | Whether a measurement span is currently open |
| "edited" (amber) | Operator score override present; hover for the judged value |
| Reconciliation | ✓ reconciled (wire ↔ transcript agree) · transcript-fallback (no wire rows) · ⚠ Δ discrepancy (disagree — treat with caution) |
| Merge status | merged · unmerged · conflicts · none (never fabricated) |
| Gate outcome | passed · failed · ungated · unscored |
| Cell state | complete · running / restoring / scoring · timeout / abort · pending / skipped |
| Role pill | foreground (primary) · knowledge (violet) · infrastructure (amber) |
| wire | anthropic / openai / unknown — which wire the turn was billed on |
| "possible loop" | Advisory: this turn repeats a recent tool signature (fuzzy, non-adjacent — distinct from the backend loop_count) |
| kb-on / kb-off | Knowledge-injection axis value for the cell |
Concepts glossary
- Composite
task_id—<experiment_id>[-<salt>]--<agent>-<model>-<framework>-<env>--r<N>. The--delimiter is how both the dashboard and the KB-injection gate detect an experiment cell (/--/.test(task_id)). A bare session UUID never contains--. task_hash—sha256(goal_sentence), shared by ALL cells and re-runs of one goal; the experiment identity and the Compare-tab key. Re-derive withprintf '%s' "$GOAL" | shasum -a 256— do not scrape it from runner stdout.- experiment-RUN id — the
task_idprefix before the first--; the Runs-table grouping key, sov9/v10/ re-runs don't collapse into one giant parent. - cell / matrix — a cell is one
{agent, model, framework, env, test_command}combo restored into an isolated sandbox; the matrix runs every cell. - kb-on / kb-off — values on the
envaxis.kb-off/default→CODING_KNOWLEDGE_INJECTION=0;kb-on→ real gated injection (see Architecture). - avenue — a forked exploration branch grouped by
origin_span_id; normal/experimentcells have noorigin_span_id, so they appear in neither the Avenues cards nor a grouped Runs list. - foreground vs background — foreground = user-driven work (file adapters cladpt/copadt/opnadt; proxy processes opencode/pi); background = consolidator / health-coordinator / observation-writer / backfill / route-judge. Denylist wins.
- honesty spine — ranked / failed / ungated / unscored (an ungated variant has no
test_commandand is compared on tokens/wallclock only, never cost-ranked). - curated tiers — for cells, only
insights+kg_entitiesare injected; episodicdigests/observationsare excluded, and the task-agnostic Working-Memory scaffold is suppressed. - closed-6
task_class—refactor · bugfix · new-feature · migration · debug · docs(keyword-derived; anything else quarantines). - score states —
scored·not_scored:"trivial"(< 1 consequential event) ·pending(locator miss / trace unresolved, re-scorable).
Ports & endpoints
| Port | Service | Key routes |
|---|---|---|
| 12435 | rapid-llm-proxy / token tap | /api/complete, /api/token-usage/recent, /v1/copilot/…, /api/llm/settings |
| 12436 | obs-api / retrieval | /api/retrieve |
| 8080 | vkb-server / experiments API | /api/experiments/* |
| 3032 | dashboard | Performance page |
| 3034 | health coordinator | /health/state |
| 3033 | Health API | — |
See the Tutorial for the guided walkthrough, the /experiment skill reference for authoring experiments, or the Architecture for how capture, injection, and scoring work under the hood.