Measurement Architecture
Overview
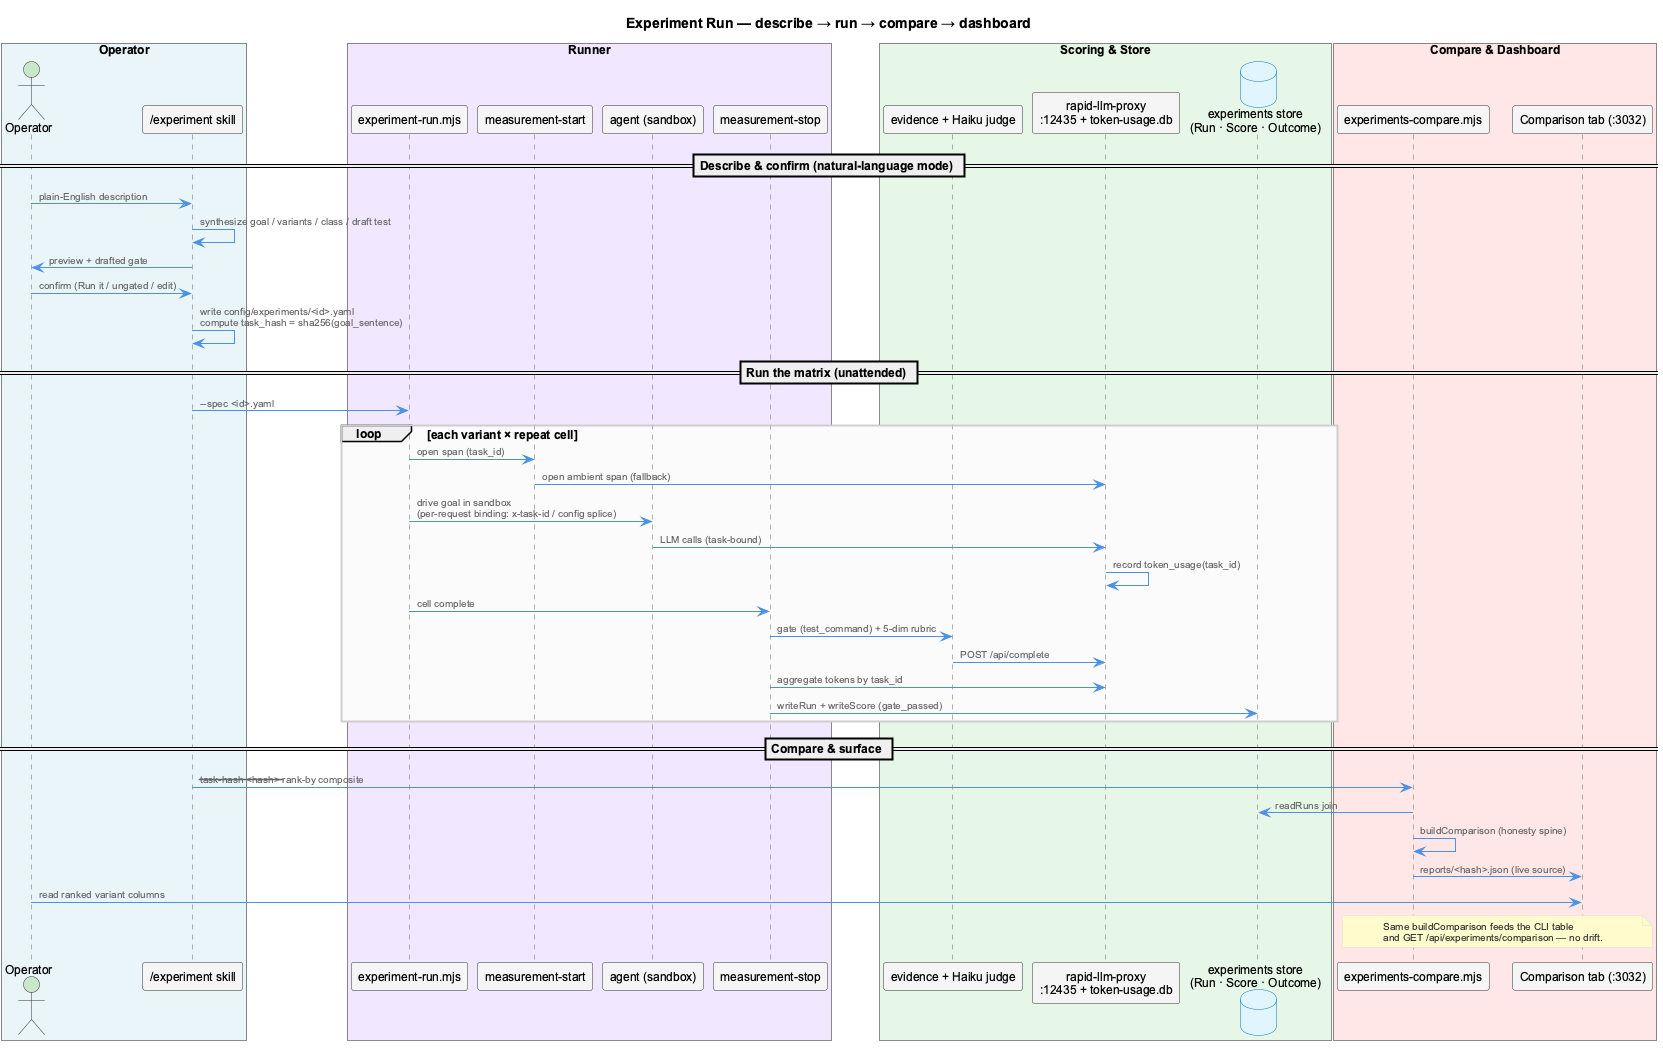
This page explains how a single experiment is measured end-to-end — from a plain-English description to a ranked comparison the dashboard reads live. The pipeline is a thin skill wrapper over two CLIs (experiment-run.mjs, experiments-compare.mjs); all the measurement logic lives in lib/experiments/ and is shared by both the CLI and the dashboard API so the two can never drift.
The measurement span
Each run is wrapped in a measurement span keyed by a task_id:
measurement-start.mjsopens the span and writes.data/active-measurement.json. On top of that span, every cell also binds its tokens per-request so capture is robust even when the cell isn't the only thing routing through the proxy (Phase 84):- claude carries an
x-task-idheader on each call; - opencode splices an
OPENCODE_CONFIG_CONTENTprovider config that binds both of its wires — the anthropic provider via/v1+x-task-id, the openai/copilot providers via a task-scoped/v1/opencode/t/<taskId>base-URL path; - pi routes via its own
models.jsoncustom provider (rapid-proxy-pi), which carries anx-task-id: $TASK_IDheader; copilot uses the BYOK task-scoped seam. The sharedrapid-llm-proxy(port 12435) stamps everytoken_usagerow with thattask_id; the ambientactive-measurement.jsonspan is the fallback for any call that doesn't carry its own binding. Wire rows are the primary token source for all agents — thecladpt/copadttranscript adapters no longer capture here; at close they run in reconcile mode (verify wire rows, fill gaps: reasoning tokens, cache split).
- claude carries an
- Before launch,
preflightAgentruns one bounded/api/completeround-trip to confirm the proxy is reachable and the cell's resolved model round-trips a token — a failed preflight records a cleanskipped:<reason>Run instead of a mid-matrix abort. - The agent then drives the goal inside a restored sandbox snapshot (
snapshot_id, defaultsmoke-spec) so runs are reproducible and isolated.restoreForCellbuilds an isolated git worktree + sandbox.dataunder.data/run-restores/<snapshot>-<ts>/; the live checkout and KB are never touched. Two guards keep the agent inside that sandbox:neutralizeSandboxRules()strips restored rules files (CLAUDE.md/AGENTS.md/.github/copilot-instructions.md/ …) — a restoredCLAUDE.mdhardcodes the live repo path, and opencode would otherwise ingest it and write there — and a post-cell sandbox-escape guard diffs the real repo's dirty-set (plus aPWD-pin so a$PWD-reading agent can't find the real root), surfacing any leak loudly. measurement-stop.mjscloses the span: it aggregates tokens fromtoken-usage.db WHERE task_id = ?, runs the evidence harness (the objectivetest_commandgate, over a scratch-index diffstat — see Scoring pipeline), invokes the Opus 4.8 judge for the 5-dimension rubric, and persists the results. The terminal state is the agent's exit code (complete/timeout/abort), never the test result.
Roles, foreground/background, and the ambient panel
A run's tokens are classified into three role lanes — foreground development, knowledge capture, and infrastructure — so a reader sees not just how much a run cost but what kind of work it did. token-aggregate.mjs separates the measured foreground session from concurrent background daemons (consolidator-*, health-coordinator, observation-writer, …): a daemon denylist overrides the adapter hash, so an observation-writer row carrying cladpt still classifies as background and never inflates the run's cost. The dominant foreground group becomes the run's canonical_agent / canonical_model. (This classifier is agent-agnostic — it keys on the process/role, not on a hardcoded per-agent hash.)
Agent-agnostic lane totals. Only agents that task-stamp their background work (opencode tags ~100%; claude/copilot barely tag) would otherwise show 0/0 Knowledge and Infrastructure lanes. To make the lanes meaningful for every agent, the run timeline folds time-window-matched ambient rows into the role lanes. Those rows are concurrent background traffic that ran during the run's window but is not attributed to it (empty/foreign task_id); the backend already excludes the run's own task_id, so the fold is additive, never double-counted. Sandboxed experiment cells are left untouched — no foreign window-join into a throwaway worktree.
The Ambient activity panel. Below each run's timeline, a collapsible "Concurrent background activity" panel honestly surfaces those in-window, unattributed processes (per process: role, calls, tokens, models). It is never a causation claim — just "this was happening at the same time" — and it makes the knowledge-capture + infrastructure spend that the task-exact stats deliberately exclude visible instead of hidden.
Parallel runs share their background. Sandboxed cells normally suppress this panel (a throwaway worktree has no honest background of its own). But when a matrix runs in parallel mode (execution_mode: parallel), the cells overlap in time, so the same background traffic ran concurrently with all of them. The panel is therefore shown on every parallel cell's timeline — recorded once, overlaid on each — with an explicit disclaimer that the activity is shared between the cells and cannot be attributed to any single cell.
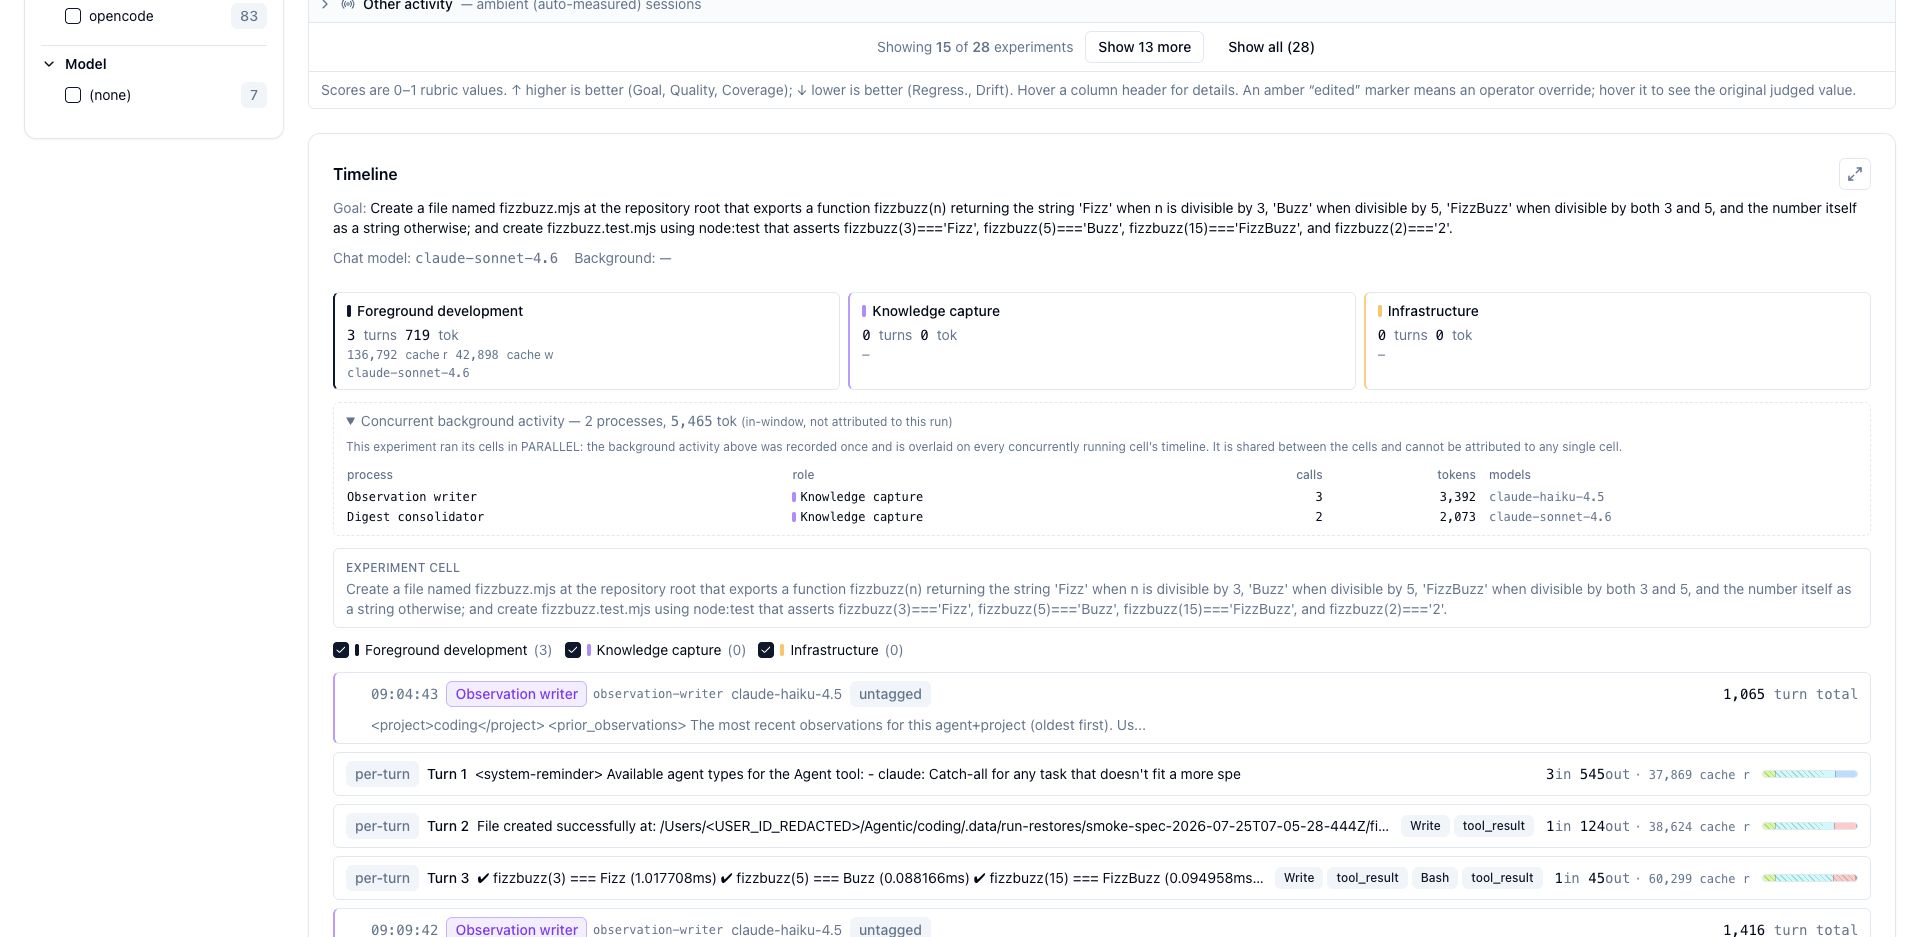
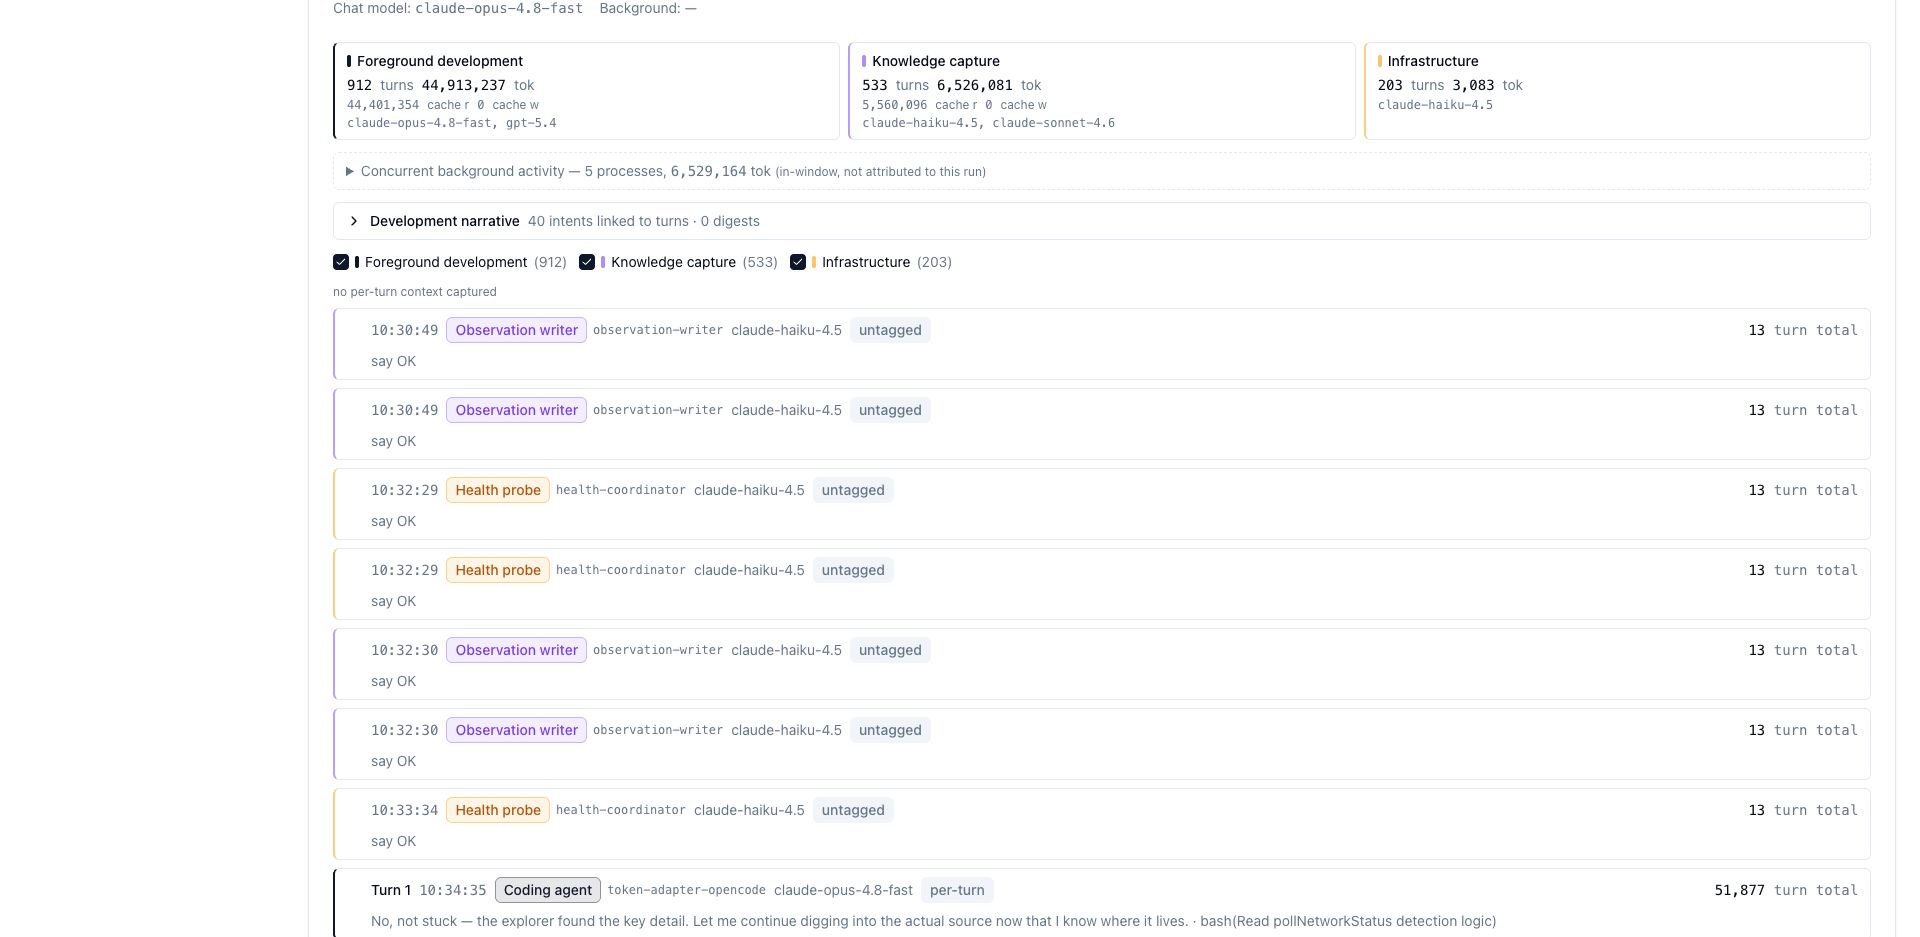
Per-turn rows for every role. The role summary cards and the Ambient panel are aggregates; the timeline itself renders individual per-turn rows for all three roles, interleaved chronologically by timestamp. Foreground turns carry their full per-request context (tool calls, prompt preview, reasoning sub-bands); the in-window background/infrastructure calls render as lean, role-coloured rows (timestamp · process pill · model · tokens) with no fabricated drill-down, since that telemetry is foreground-only. Two backend readers feed this from the same proxy token_usage window: readAmbientBackground (GROUP BY process) powers the summary card counts + the Ambient panel, while readAmbientTimeline returns the same calls individually so they can be woven into the list. Three role-filter checkboxes above the list show/hide each lane — un-checking Foreground development isolates the background timeline; the per-row counts stay consistent with the cards (e.g. foreground + knowledge + infrastructure = the full row count, never double-counted).
Knowledge-injection axis (kb-on / kb-off)
The env axis carries a with-vs-without knowledge comparison. Default is injection off for every cell; only env: kb-on turns it on. This is a genuine axis because the runner launches raw agent binaries (bypassing the interactive _inject_knowledge_context seam) and claude -p never fires the UserPromptSubmit hook — so without the cell-injection path, a cell gets no injection at all.
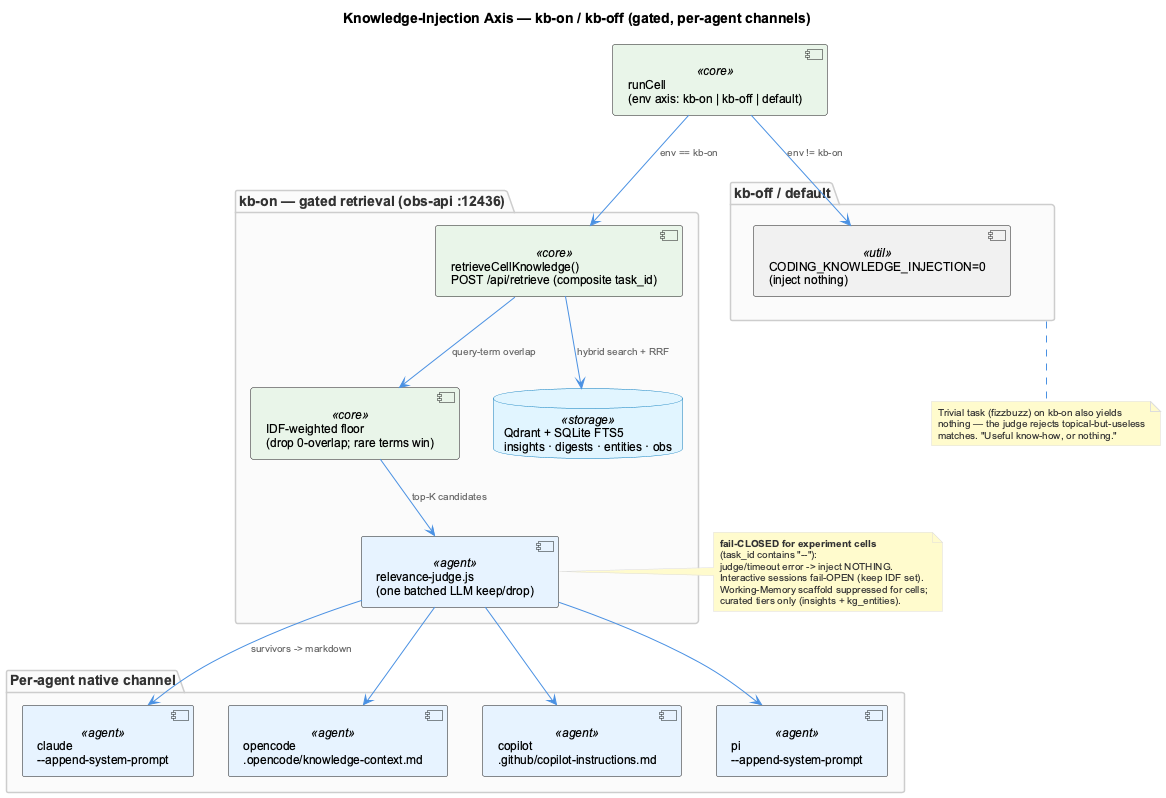
For a kb-on cell, runCell calls cell-injection.mjs, which fetches gated knowledge from obs-api POST /api/retrieve (keyed by the composite task_id) and injects it via each agent's native channel:
| Agent | Channel |
|---|---|
| claude | --append-system-prompt "<knowledge>" (launch argv) |
| opencode | <worktree>/.opencode/knowledge-context.md |
| copilot | <worktree>/.github/copilot-instructions.md |
| pi | --append-system-prompt "<knowledge>" (launch argv, same channel as claude) |
The gate (src/retrieval/retrieval-service.js + relevance-judge.js) applies an IDF-weighted floor (generic query terms score ≈ 0; rare terms like fizzbuzz/ETM dominate) and a batched LLM relevance judge that keeps only genuinely-useful items. For an experiment cell (task_id contains --) it fails CLOSED — a judge/timeout error injects nothing ("useful know-how, or nothing"); interactive sessions fail open. The task-agnostic Working-Memory scaffold is suppressed for cells; only curated insights + kg_entities are eligible. A trivial task therefore injects 0 bytes — visible as Retrieved Knowledge 0 B in the Explain modal.
Scoring pipeline
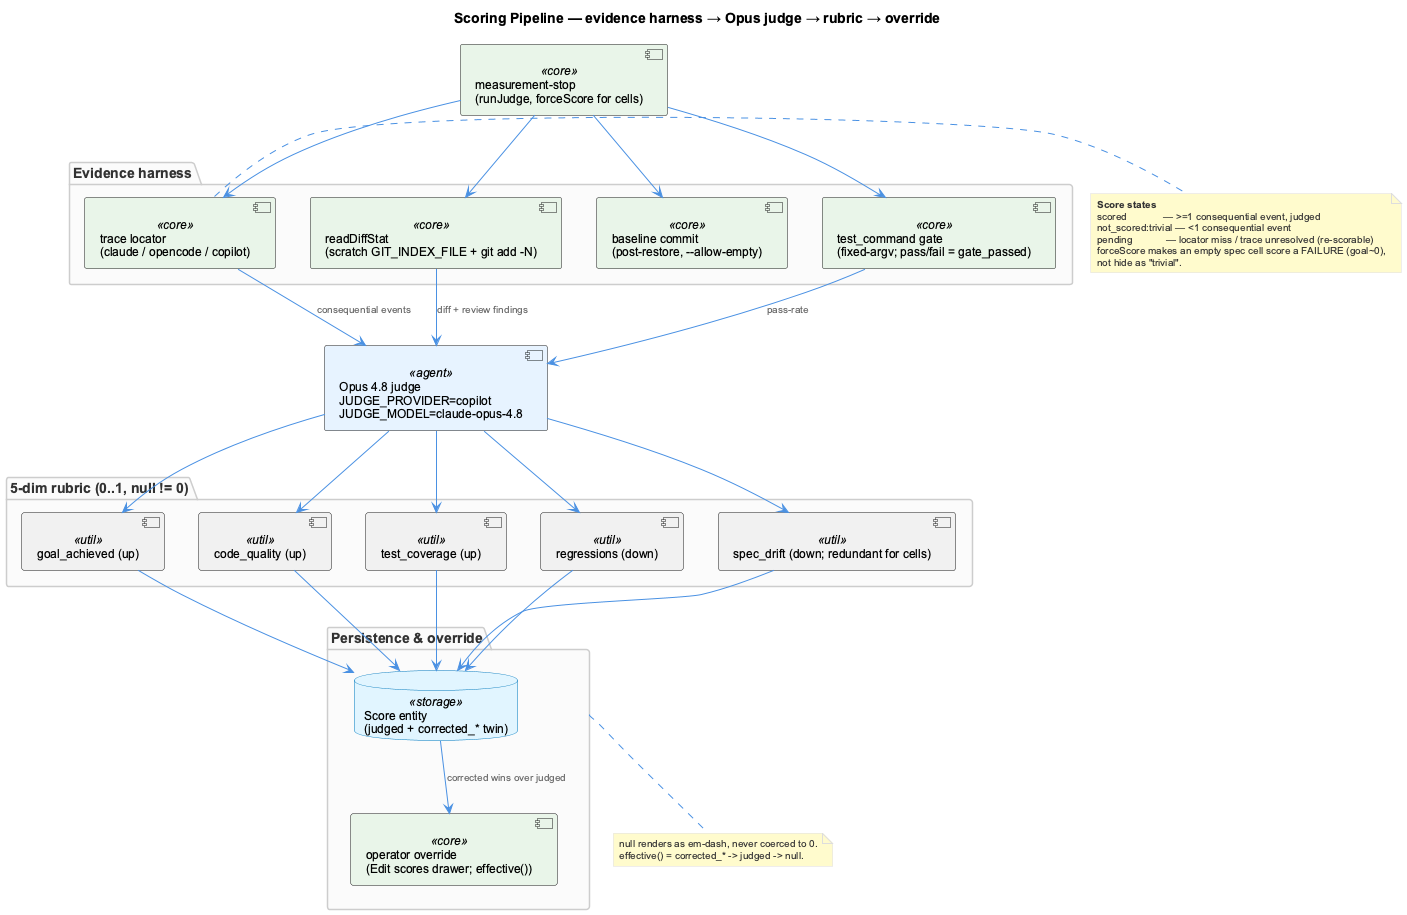
The evidence harness makes new-file deliverables scoreable and keeps the diff honest:
- Scratch-index diffstat —
readDiffStatrunsgit add -Nthrough a scratchGIT_INDEX_FILE, so untracked new files appear ingit diff --statwithout touching the real index. Without this, a "write fizzbuzz.mjs" task showed an empty diffstat → a starvedcode_quality. - Post-restore baseline commit — the restore reconstruction is folded into the sandbox HEAD before the agent runs, so the score-time diff reflects only the agent's edits, not tens of thousands of restored lines.
runJudge({forceScore})— a spec-driven cell that produced no events is judged a failure (goal ≈ 0), not hidden asnot_scored:"trivial".- Judge model — pinned to
JUDGE_PROVIDER='copilot',JUDGE_MODEL='claude-opus-4.8'(env-overridable). Haiku previously fabricated wrong-direction scores (e.g.quality 0.12for a clean 4/4 run).
Score states: scored (≥ 1 consequential event, judged) · not_scored:"trivial" (< 1 consequential event) · pending (trace locator miss / unresolved — re-scorable). Trace locators are agent-specific and sandbox-fragile; the claude transcript survives at ~/.claude/projects/<encoded-cwd>/*.jsonl even after the worktree is deleted (which is why the cwd dot-encoding fix matters at backfill).
Experiment identity
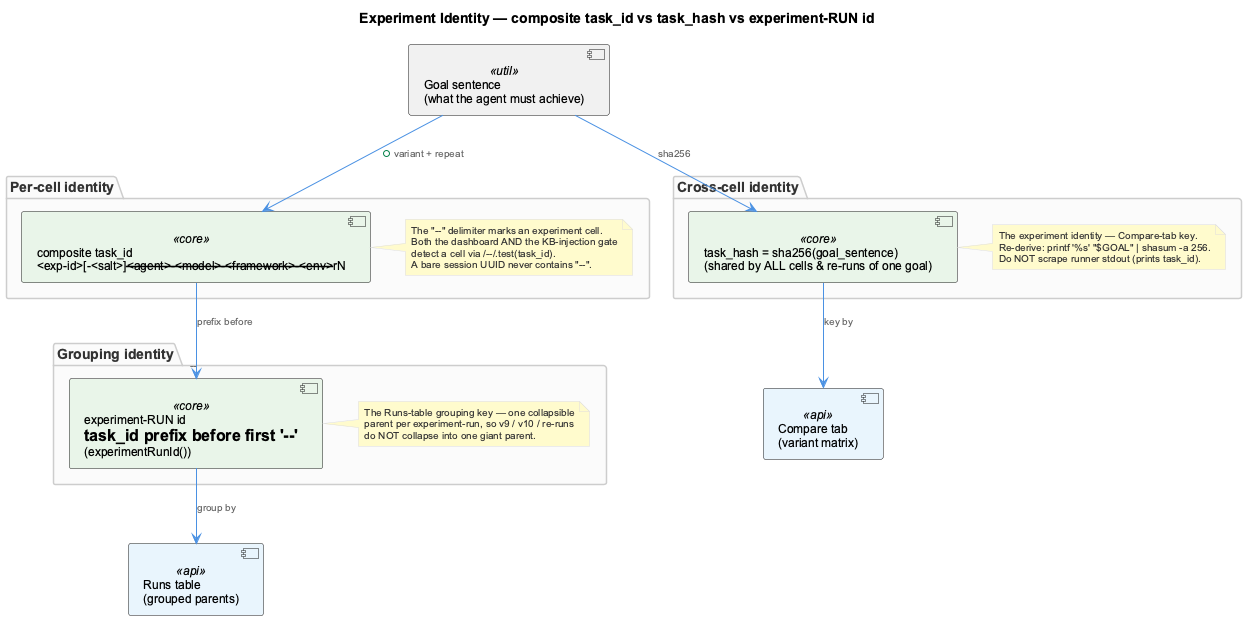
Three ids do three jobs: the composite task_id (…--<agent>-<model>-<framework>-<env>--rN) identifies one cell and — via its -- delimiter — is how both the dashboard and the injection gate detect an experiment cell; task_hash = sha256(goal) is the cross-cell identity keying the Compare tab; the experiment-RUN id (prefix before the first --) is the Runs-table grouping key so re-runs don't collapse together.
Per-agent model dialects matter here: the same model needs three spellings — claude CLI --model claude-sonnet-4-6 (hyphenated; the dotted form 404s), the rapid-proxy catalog rapid-proxy/claude-sonnet-4.6 (dotted), and the copilot catalog claude-sonnet-4.6 (dotted). resolveCellModel normalizes each at launch while keeping the recorded variant identity byte-stable.
Always-on per-agent measurement
Historically, a real context-window breakdown required someone to click Start measurement first — an interactive session that never opened a span routed through the proxy with an empty task_id, so the dashboard could only show an illustrative context band. The measurement reconciler removes that manual step: it keeps a live measurement span bound for each foreground agent session automatically, so claude / opencode / copilot sessions get a real, proportional context-window breakdown with zero manual action.
Capture requires proxy-routed traffic
The per-category context-window breakdown is produced only by the proxy wire-tap at localhost:12435, which parses the actual request buffer. A session gets a real band only if its traffic flows through the proxy — i.e. it uses the rapid-proxy provider (http://localhost:12435/v1). Sessions on a provider that talks to the upstream API directly (e.g. opencode's built-in github-copilot/* models, or Claude Code before its /v1/messages calls are routed through the proxy) bypass the tap: the reconciler still binds a slot and token totals are backfilled by the token-adapter-* reconcilers, but there is no wire buffer to split, so the dashboard correctly falls back to the illustrative band. To capture an opencode session, point it at a rapid-proxy/<model> model rather than github-copilot/<model>.
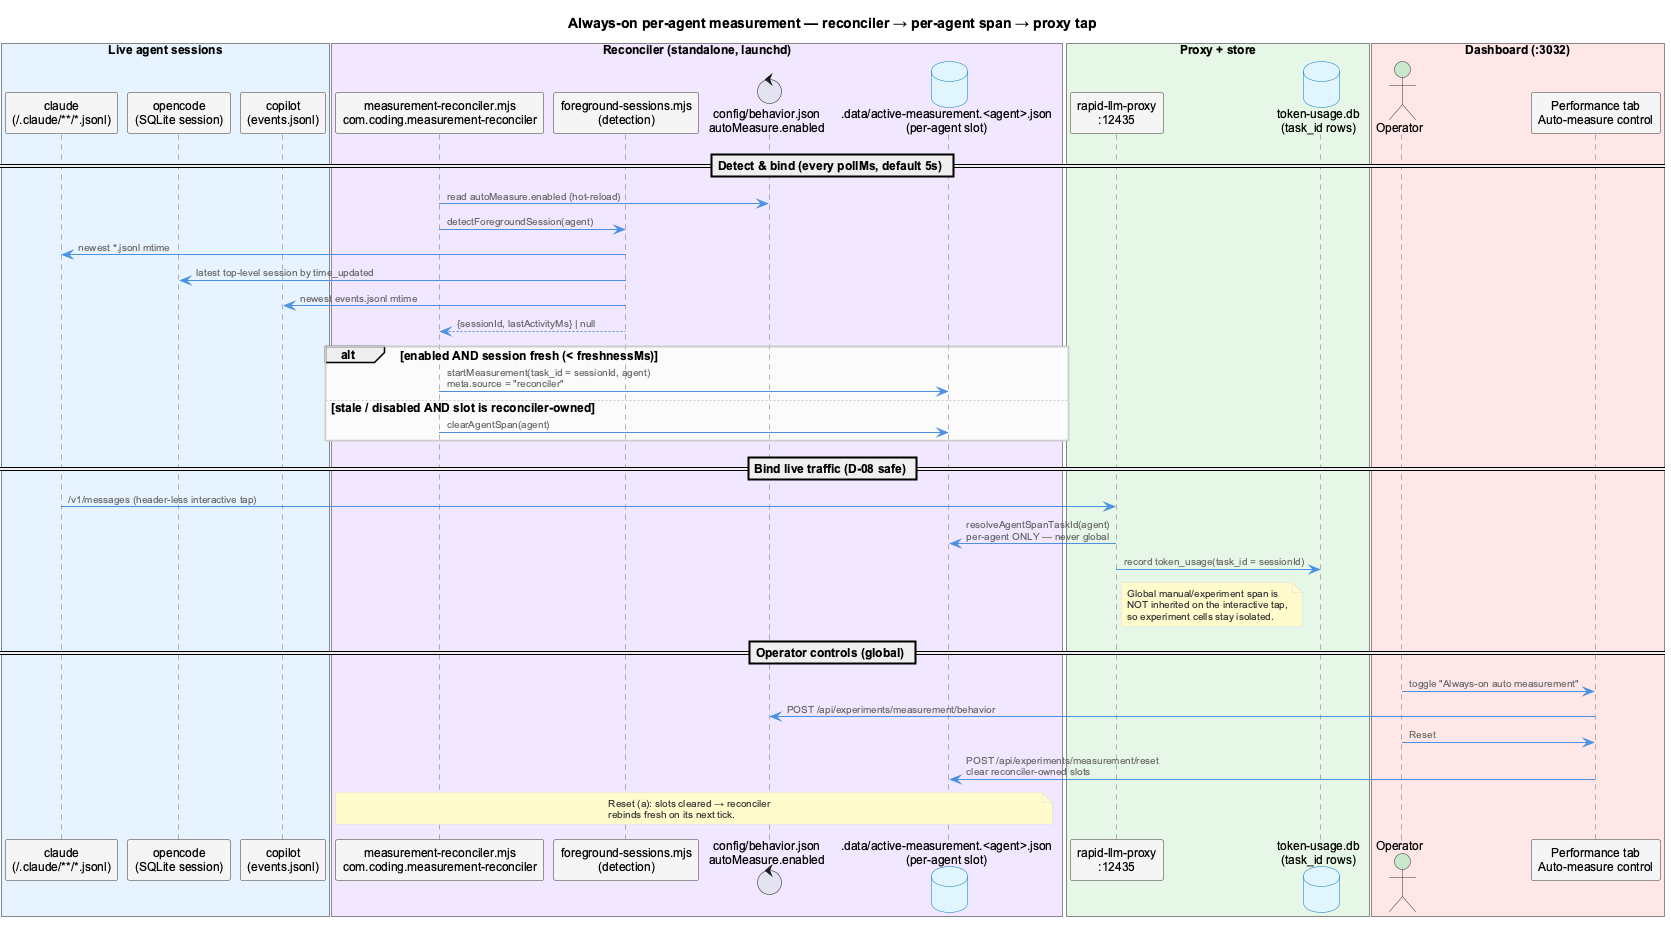
How it works. A standalone, launchd-supervised loop (scripts/measurement-reconciler.mjs, com.coding.measurement-reconciler) ticks every pollMs (default 5s):
- Detect each agent's live foreground session (
lib/measurement/foreground-sessions.mjs) — claude via the newest*.jsonltranscript mtime, opencode via the most-recent top-level session in its SQLite store, copilot via the newestevents.jsonlmtime. Locations come fromgetAgentSearchPaths(), the single source of truth. (pi is stubbed — it returnsnullpending removal.) - Bind a fresh session (activity within
freshnessMs, default 120s) by writing a per-agent span slot.data/active-measurement.<agent>.jsonwithtask_id = session_id— the same key the wire-tap Run reconstruction uses, so proxy traffic and the reconstructed Run correlate. - Clear its own slot when a session goes stale, or rebind when the session rotates.
Isolation (D-08 preserved). The proxy binds the header-less interactive /v1/messages tap to the per-agent slot only (resolveAgentSpanTaskId) — it never inherits the global active-measurement.json span. So a concurrent experiment or a manual measurement can never leak into an ambient interactive session, and vice versa. The global manual/experiment slot and any operator-pinned per-agent slot are left untouched by the reconciler.
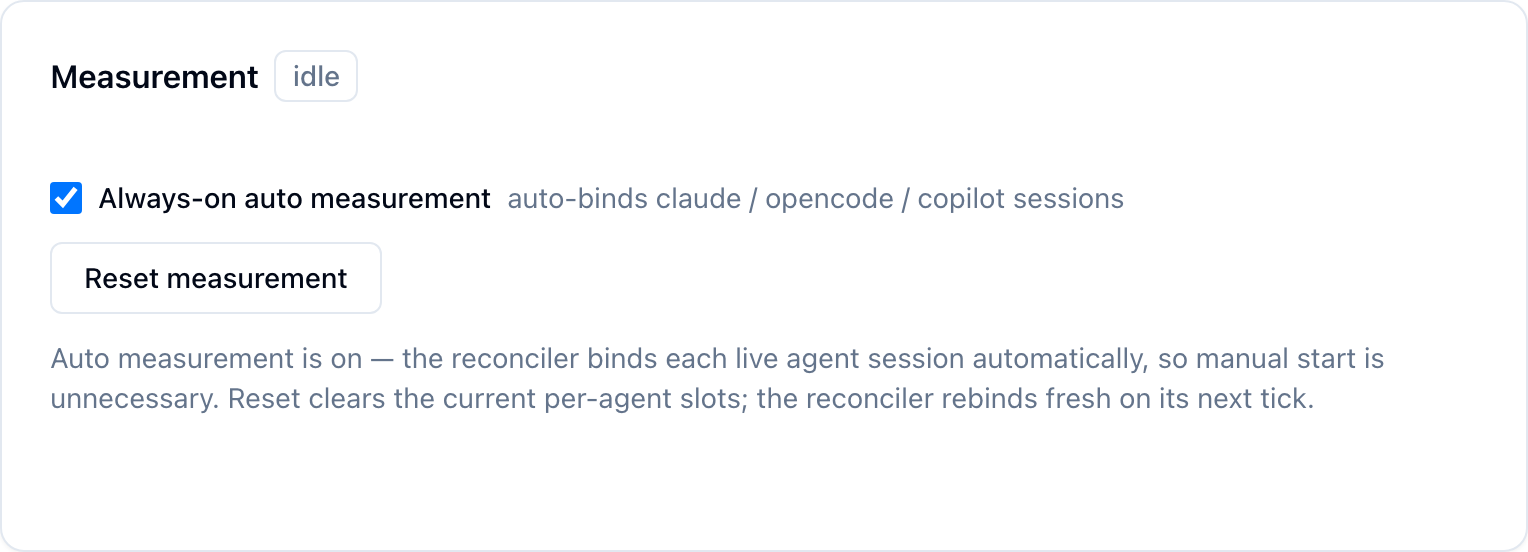
Control (config/behavior.json → autoMeasure). A single global checkbox in the dashboard's Measurement card toggles always-on binding; the reconciler hot-reloads the config each tick. When always-on is enabled, the manual Start form is replaced by a Reset button — Reset clears the reconciler-owned per-agent slots (POST /api/experiments/measurement/reset) so each live session rebinds fresh on the next tick.
| Always-on enabled | Always-on disabled |
|---|---|
 | 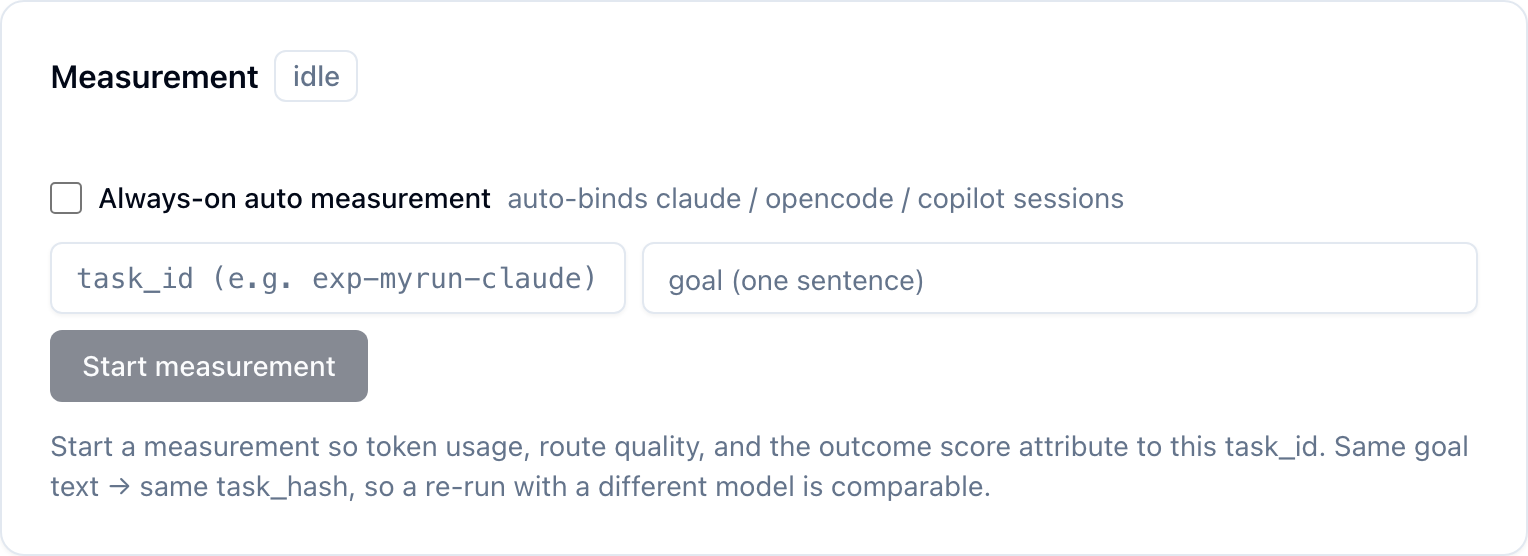 |
Endpoints: GET/POST /api/experiments/measurement/behavior (read/merge autoMeasure) · POST /api/experiments/measurement/reset (clear-and-rebind).
The data model
Three linked entities are written to the dedicated experiment store (.data/experiments/leveldb, kept separate from the knowledge graph to avoid churn):
| Entity | Key fields | Purpose |
|---|---|---|
| Run | task_id, task_hash, task_class, agent/model/framework/env, variant, repeat, terminal_state, 6 route heuristics | one execution of the goal by one variant |
| Score | gate_passed (true/false/null), 5-dim rubric (goal_achieved, code_quality, test_coverage, regressions, spec_drift), goal_aligned_ratio | objective gate + quality signal |
| Outcome | totalTokens, inputTokens, outputTokens, reasoningTokens | the cost totals |
Key discipline — null is not zero (D-09): a metric that could not be computed is stored null and excluded from stats, never coerced to 0. This keeps means honest and prevents a missing rubric from dividing the composite by zero (such a variant routes to unscored instead).
task_hash closes the loop
The runner derives task_hash = sha256(goal_sentence) at close. The /experiment skill re-derives the same hash (it owns the goal sentence) and passes it straight to the compare step — so run → compare → dashboard is mechanically closed with no stdout scraping.
Comparison & the dashboard
experiments-compare.mjs calls buildComparison(rows, {taskHash, rankBy}) from lib/experiments/compare.mjs:
- read all runs for the
task_hash(join Run → Score → Outcome), - classify each variant into the honesty-spine group (ranked/failed/ungated/unscored),
- aggregate each ranked variant's successful runs into
{mean, stddev, median, min, max, n}, - rank by
--rank-by(compositedefault, ortokens/wallclock/score), - write
.data/experiments/reports/<task_hash>.json.
That exact JSON is what the dashboard's Compare tab reads via GET /api/experiments/comparison — and the endpoint calls the same buildComparison, guarded by a deep-equality test, so the CLI table and the dashboard can never disagree.
Avenues — forking a span
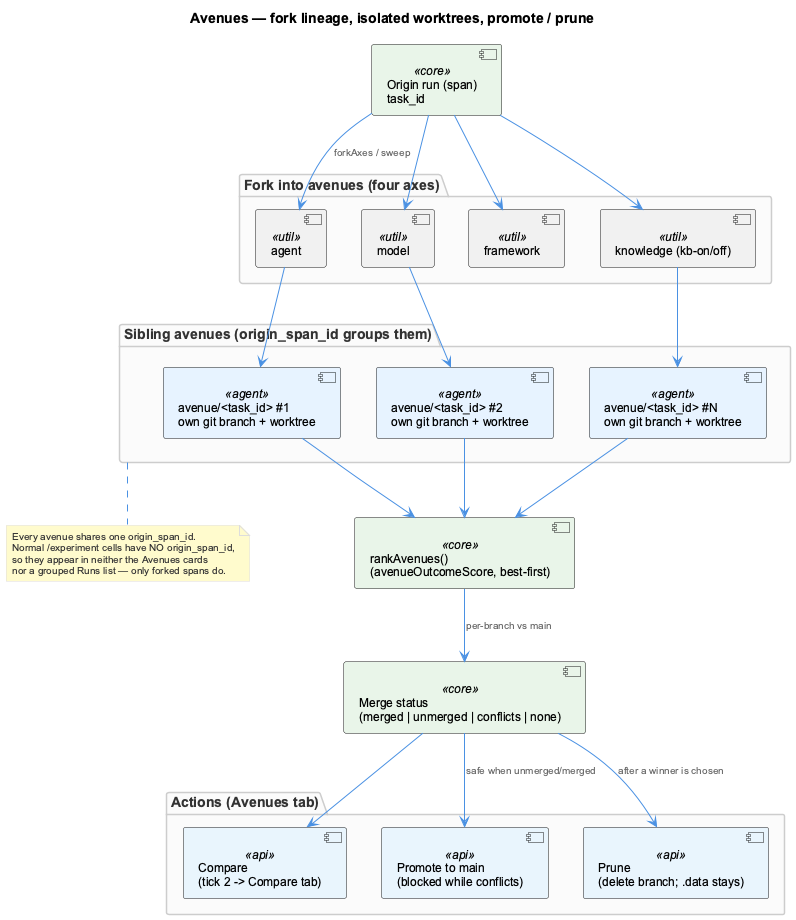
A completed run can be forked into avenues: the same prompt swept across the agent / model / framework / knowledge axes, each avenue restored onto its own named avenue/<task_id> branch (a real worktree that accumulates the avenue's edits as commits). Sibling avenues share one origin_span_id, which is how the Avenues tab groups and ranks them; a winner can be promoted to main (blocked while its git status shows conflicts) and the losers pruned.
Service ports involved: dashboard :3032 · dashboard API :3033 · vkb / experiments API :8080 · llm-proxy :12435 · obs-api / retrieval :12436. The proxy, obs-api, and ETM run as auto-respawning launchd daemons (com.coding.*).
See the Dashboard Reference for every tab, column, badge, and tooltip.