Reading the Graph Bottom-Up
A walkthrough of the Unified Viewer's two summarization controls, followed end to end on one real node: how a single Detail row at the bottom of the ontology turns into CollectiveKnowledge at the top, and how the Detail level control applies that same fold to the whole canvas at once.
Viewer: vkb → http://127.0.0.1:12436/viewer/coding · Data: obs-api on :12436 · Corpus measured: 2026-09-25 16:34Z, 2,801 entities / 18,696 edges
The store is live — the ETM writes to it continuously, so the header counts in the screenshots drift by a few nodes between captures (2,793 → 2,801 over this session). Every derived figure in this document comes from one replay at 16:34Z so the tables cannot disagree with each other.
Overview
The viewer has two ways to ask for less detail, and they are the same movement seen from two ends.
| Control | Question it answers | |
|---|---|---|
| Vertical | Walking up a node's parents | "What stands for this row?" |
| Horizontal | The Detail level segmented control | "Apply that fold to everything." |
Neither one aggregates anything at read time. Both are filters over structure that already exists in the graph — the parent edges (contains, parent-child, includes) and the roll-up markers (metadata.rollUpOf, metadata.rolledUpInto) written by the knowledge pipeline. That matters for trust: nothing you see at Summary was invented for the view.
The five ontology levels
HIERARCHY_LEVEL in integrations/unified-viewer/src/graph/hierarchy-parents.ts is the whole ladder:
graph TD
    S["System · level 0<br/>CollectiveKnowledge"]
    P["Project · level 1<br/>Coding"]
    C["Component · level 2<br/>LiveLoggingSystem"]
    SC["SubComponent · level 3<br/>SpecstoryAdapter"]
    D["Detail · level 4<br/>SpecstoryApiClient"]
    I["Insight · level 4<br/>online-learning rows"]

    S -->|includes| P
    P -->|parent-child| C
    C -->|contains| SC
    SC -->|contains| D
    SC -->|metadata.parentId| I
    P -.->|has_insight| I
Insight sits at Detail's level rather than below it — an Insight is a SubComponent's child, not a Detail's. It was absent from this table until 2026-09-21, which is why the entire online-learning population (975 Insights, 742 of them under Coding) could not participate in the hierarchy at all.
The dashed edge is the fallback. Only 147 Insights carry an explicit metadata.parentId naming a SubComponent; the other 828 have nothing but has_insight from their Project. That edge is ranked below every containment edge, so it never displaces a real placement — it just means an unplaced Insight hangs off its Project instead of falling out of the tree and rendering as an unattributable dot.
Part 1 — one node, walked upward
The subject: SpecstoryAdapterInterface, a Detail row describing one class in one file.
Stop 1 — SpecstoryAdapterInterface (Detail)
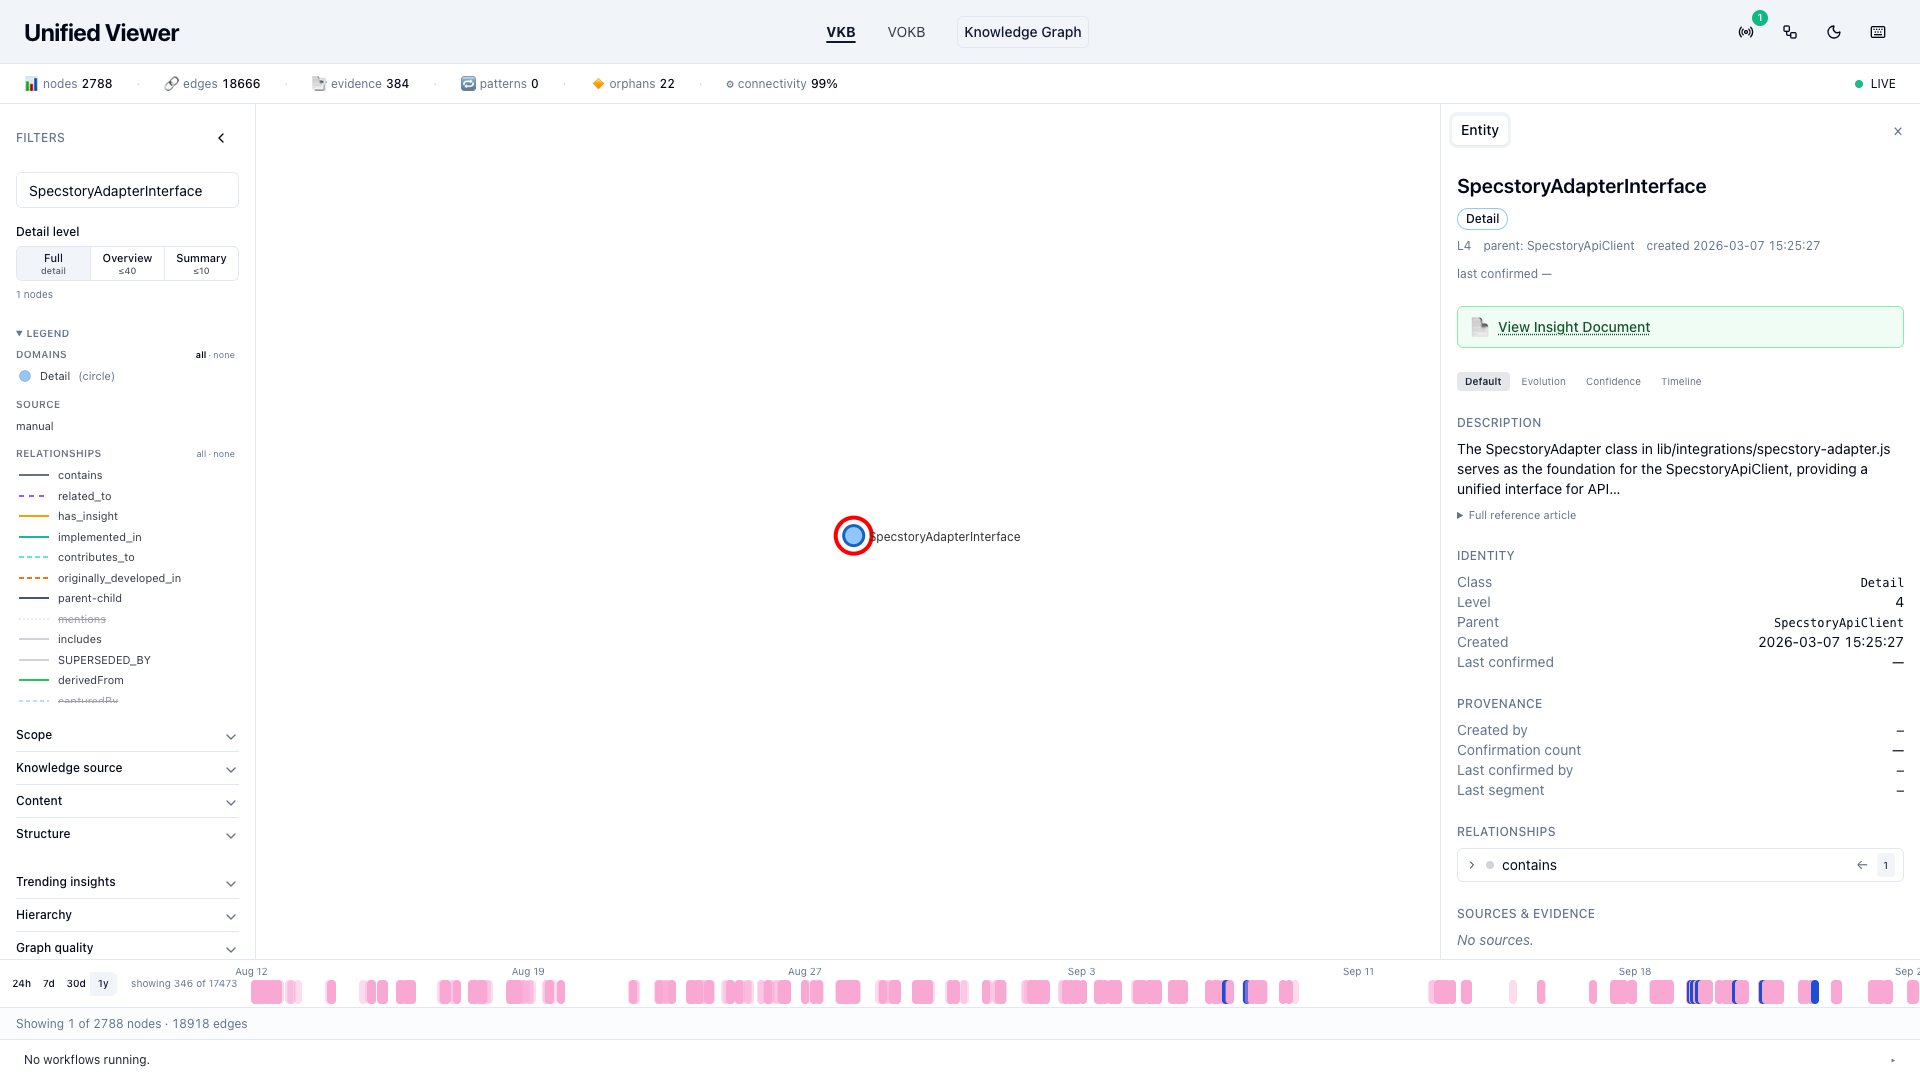
Search narrows the canvas to a single circle. The panel describes one class in one file, and the RELATIONSHIPS block has a single entry: contains ← 1. The rail's legend has collapsed to Detail (circle) and source manual, because the legend is driven by what is drawn, not by what the store holds.
The header reads L4 · parent: SpecstoryApiClient — depth 4, the bottom of the ladder, and the one hop this walk is about to take. (Both of those values were — until the defect described at the end of this page was fixed.)
This is the bottom of the ladder: nothing is folded into this row, and it stands for nothing but itself.
Stop 2, SpecstoryApiClient, is not shown separately — it is another Detail, one hop up, with a subtree of exactly one (this node). Its description is visibly hedged: "…although specific implementation details are not available. The lack of direct source code access limits the ability [to…]". Two Detail rows in a row is the ladder marking time; the interesting change is the next hop.
Stop 3 — SpecstoryAdapter (SubComponent)
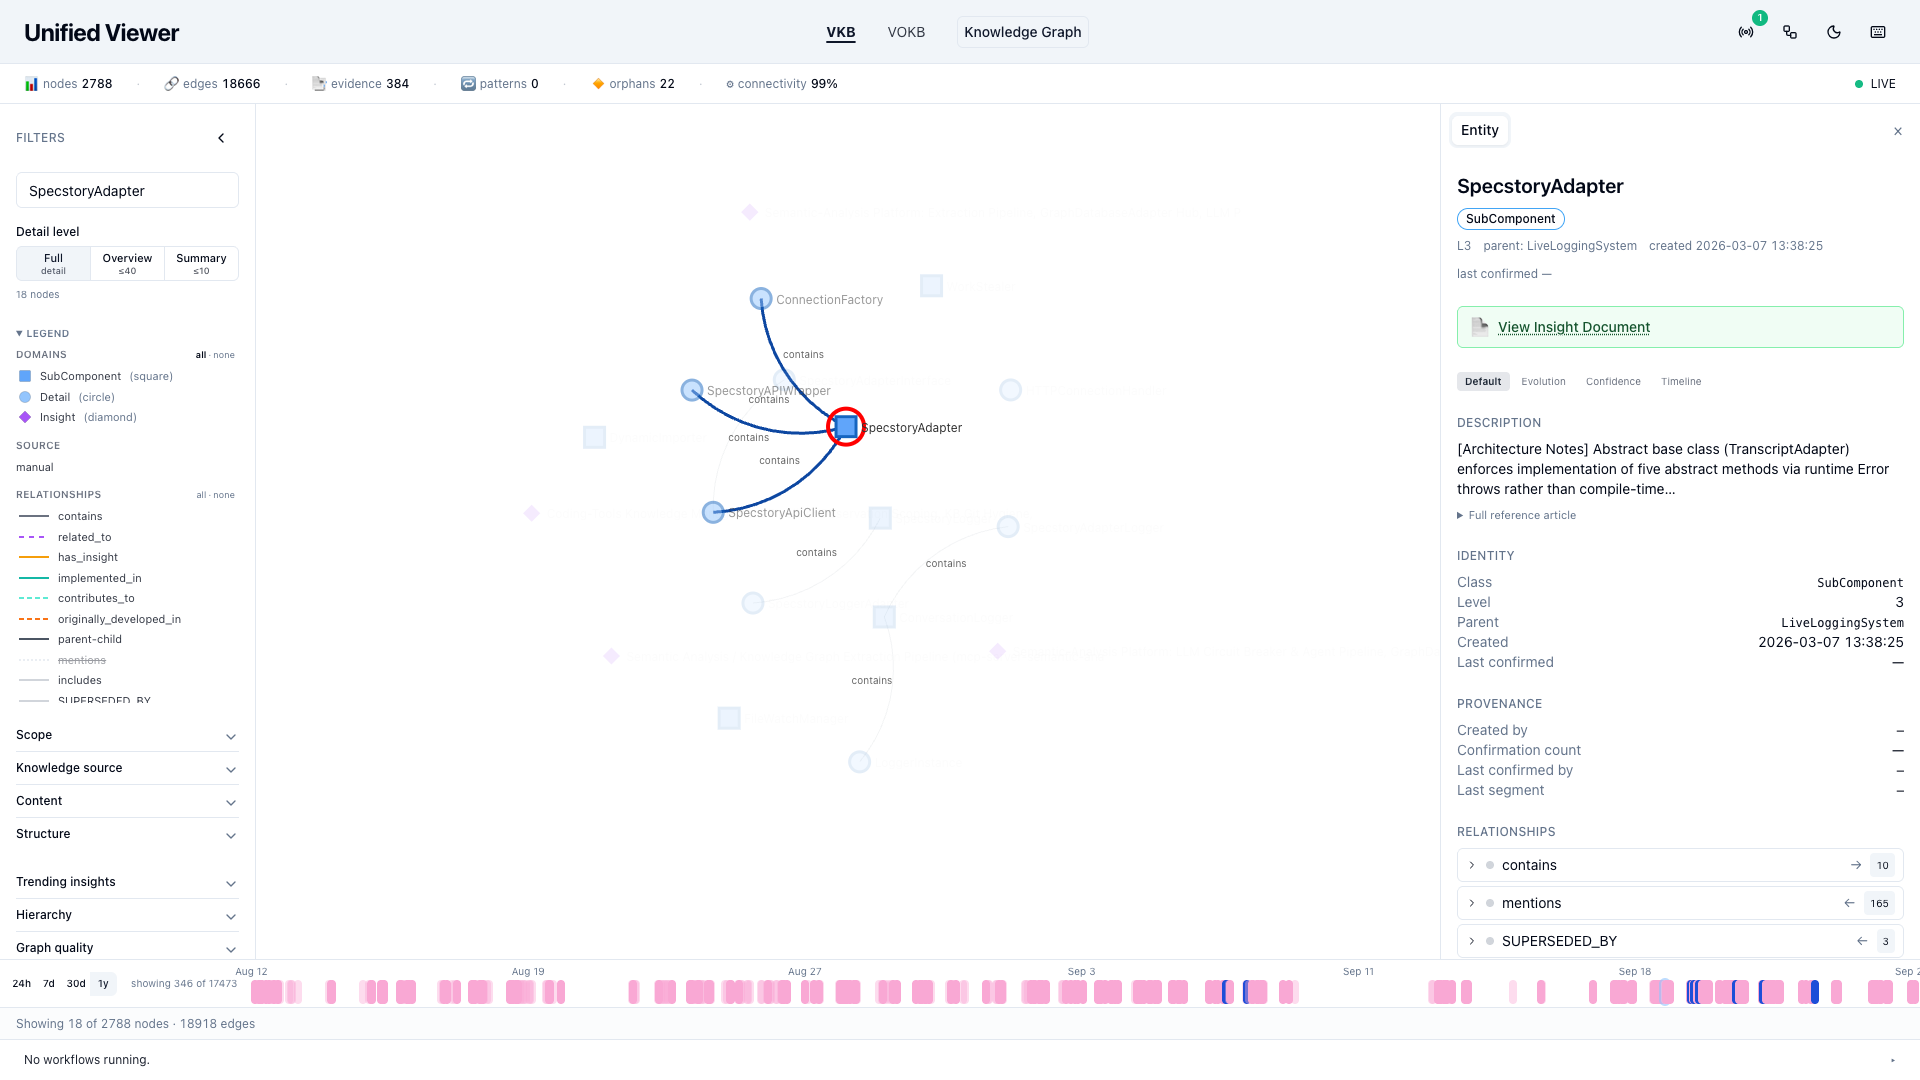
Two hops up, the register changes from file to contract: an abstract base class enforcing five methods, and a mandatory classification/redaction gate every adapter must route through. The relationship block is now contains → 10, mentions ← 165, SUPERSEDED_BY ← 3.
Stop 4 — LiveLoggingSystem (Component)
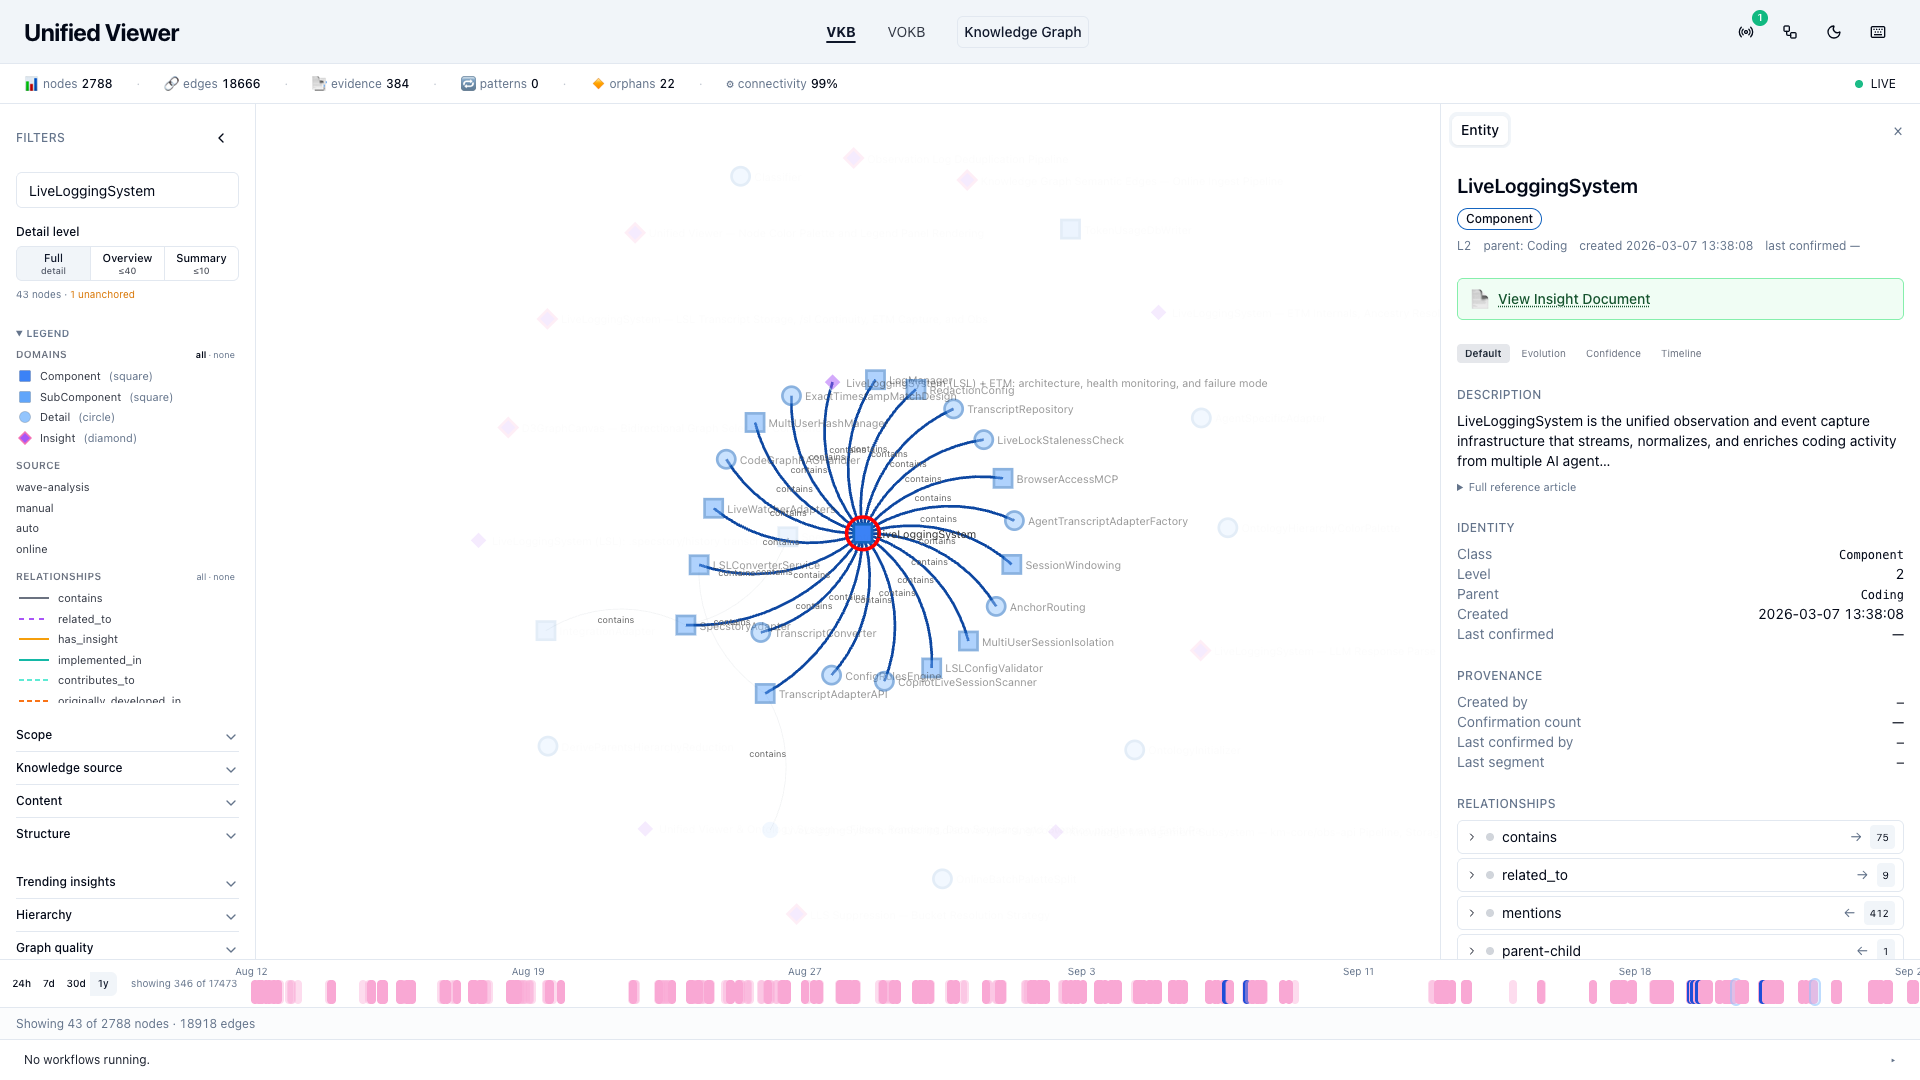
This is the ×30 step, and it is the one you can see. The node sits at the centre of a starburst of contains edges — contains → 75, mentions ← 412 — and the description has stopped naming classes altogether: it describes a pipeline, the four agent backends feeding it, and what it does to their output. Its subtree is 274 entities: 120 Insights, 100 Details, 54 SubComponents.
Stop 5 — Coding (Project)
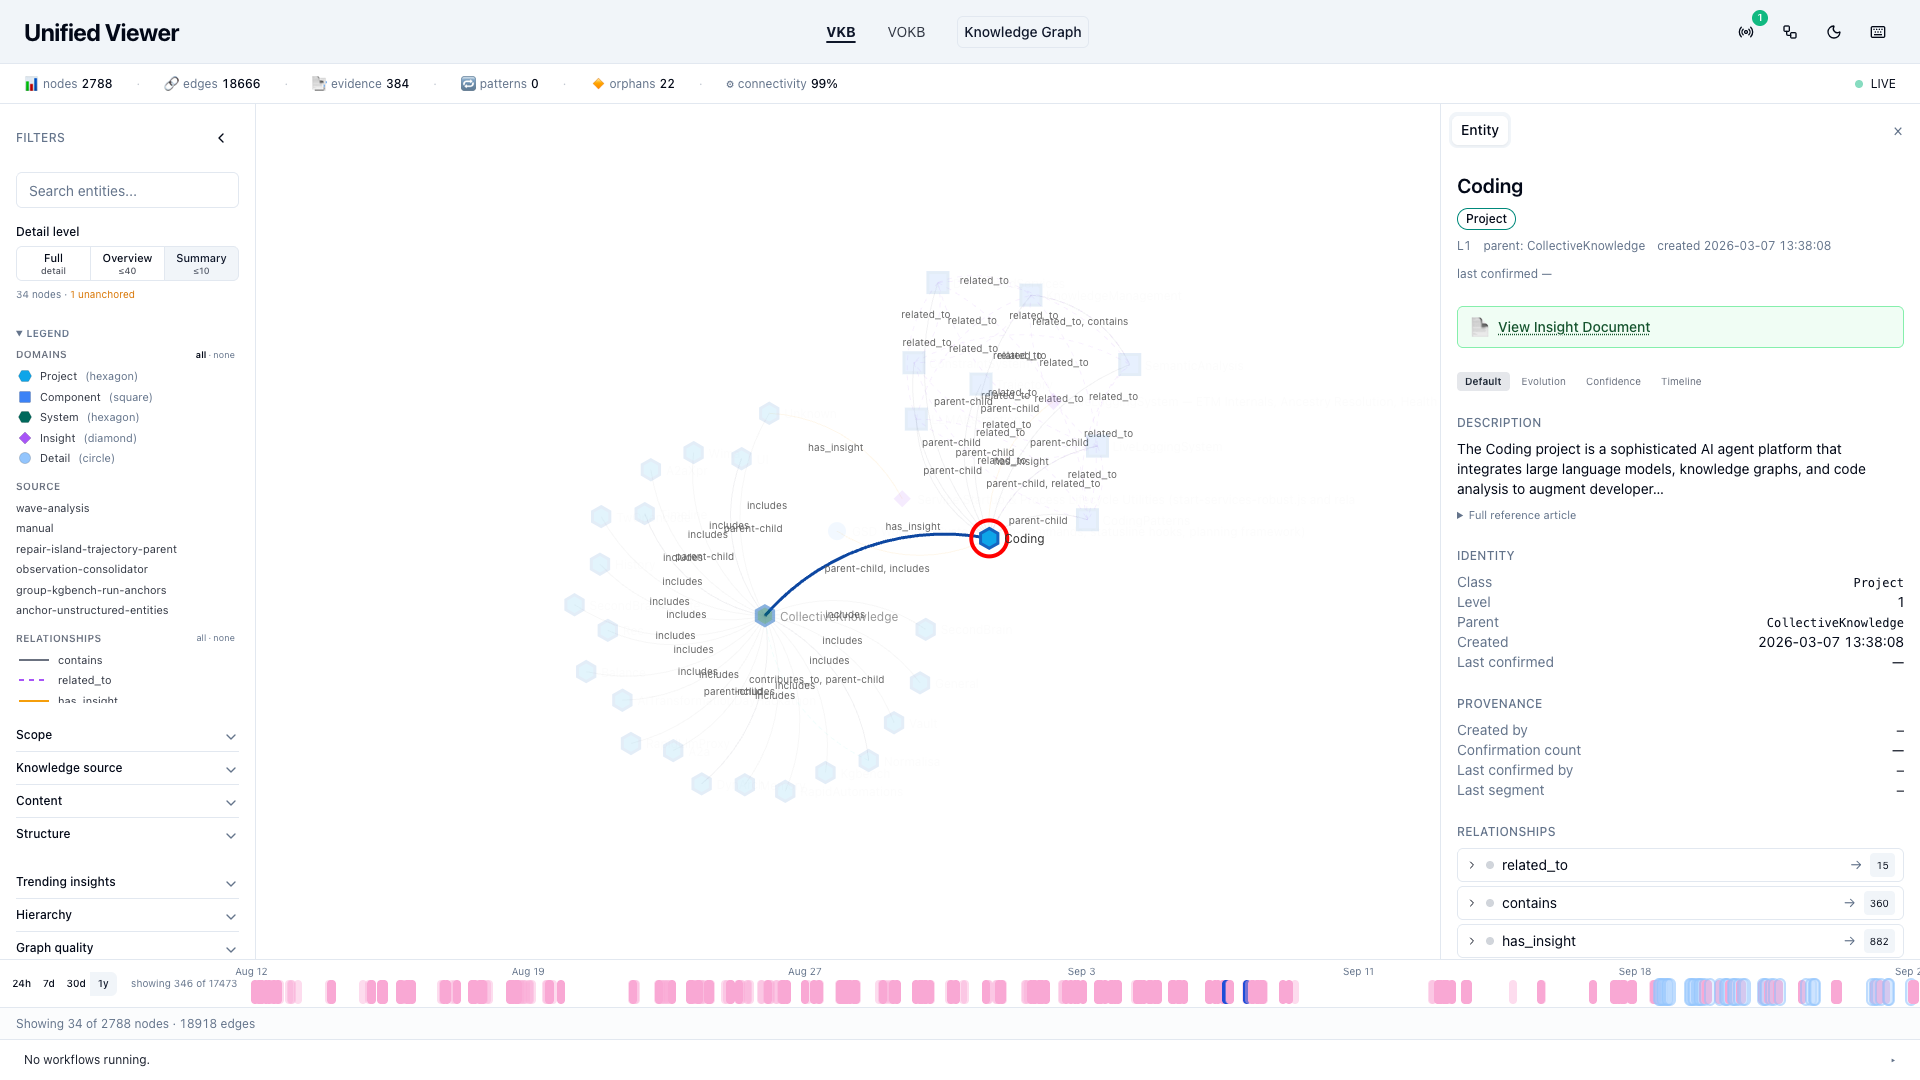
At the top of the useful range, Coding carries contains → 373, has_insight → 882, parent-child → 9. The screenshot is taken at Summary, which is why the canvas behind it is the bare backbone — CollectiveKnowledge with its includes spokes and the highlighted edge down to Coding.
Note on the two counts. The
contains → Nfigure in the panel is an edge count; the "direct children" column above is a hierarchy count. They differ becausederiveParents()gives each child exactly one parent — of the ~129 nodes with more than one candidate, only the winning edge becomes a tree child — and becausecontainsalso points at entities outside the hierarchy classes.
Each step up is one hop along the parent pointer that deriveParents() chose for it. The scope column is the number of entities in that node's subtree — everything it stands for once the levels below it are folded away.
| Stop | Node | Class | Direct children | Scope (subtree) | Description length |
|---|---|---|---|---|---|
| 1 | SpecstoryAdapterInterface | Detail | 0 | 0 | 498 ch |
| 2 | SpecstoryApiClient | Detail | 1 | 1 | 517 ch |
| 3 | SpecstoryAdapter | SubComponent | 6 | 9 | 1,075 ch |
| 4 | LiveLoggingSystem | Component | 90 | 274 | 1,364 ch |
| 5 | Coding | Project | 230 | 2,002 | 1,516 ch |
| 6 | CollectiveKnowledge | System | 24 | 2,105 | 201 ch |
Two things are worth reading off that table.
Scope grows by roughly an order of magnitude per hop — 0 → 1 → 9 → 274 → 2,002 → 2,105. The jump from SubComponent to Component is the steep one (9 → 274, ×30): that is where the viewer stops describing code and starts describing a subsystem.
Text does not shrink on the way up — it shrinks per thing covered. Summarization here is not "fewer words", it is a wider referent for the same number of words:
| Node | Class | Characters per entity covered |
|---|---|---|
SpecstoryApiClient | Detail | 517 |
SpecstoryAdapter | SubComponent | 119 |
LiveLoggingSystem | Component | 5.0 |
Coding | Project | 0.76 |
CollectiveKnowledge | System | 0.10 |
The System row is the giveaway: 201 characters standing for 2,105 entities. It has stopped describing the corpus and started declaring a policy for it.
What the descriptions actually say
The register changes at every hop — file, then class contract, then subsystem, then platform, then charter.
Detail — SpecstoryAdapterInterface, about one file and one coupling:
The SpecstoryAdapter class in
lib/integrations/specstory-adapter.jsserves as the foundation for the SpecstoryApiClient, providing a unified interface for API interactions. […] The use of the SpecstoryAdapterInterface enables loose coupling between the SpecstoryApiClient and […]
SubComponent — SpecstoryAdapter, about a contract its children must satisfy:
[Architecture Notes] Abstract base class (
TranscriptAdapter) enforces implementation of five abstract methods via runtimeErrorthrows rather than compile-time interfaces, since the codebase is plain JS with JSDoc typing; Mandatory classification/redaction schema gate […]
Component — LiveLoggingSystem, about a pipeline and the agents feeding it:
LiveLoggingSystem is the unified observation and event capture infrastructure that streams, normalizes, and enriches coding activity from multiple AI agent backends (Claude, Copilot, OpenCode, Pi) into a persistent knowledge graph. […]
Project — Coding, about the platform:
The Coding project is a sophisticated AI agent platform that integrates large language models, knowledge graphs, and code analysis to augment developer workflows […]
System — CollectiveKnowledge, about what is allowed in at all:
Central hub for high-value, transferable programming patterns. Contains only proven solutions applicable across multiple projects. Focus: architectural decisions, performance patterns, reusable designs.
Part 2 — the same fold, applied to the whole canvas
Walking one node upward answers "what stands for this row?" once. The Detail level control in the filter rail answers it for every row at once. It is a segmented control, not a slider: the three positions are named, discrete and non-linear — Summary is not "more Overview".
Behind it are three boolean flags that already existed in the store. The control composes them; it does not run a second roll-up pass.
| Level | hideRolledUp | collapseSubComponents | aggregatesOnly | Nodes drawn |
|---|---|---|---|---|
| Full — every row, nothing folded | – | – | – | 2,165 |
| Overview ≤40 — the default | ✓ | ✓ | – | 73 |
| Summary ≤10 | ✓ | ✓ | ✓ | 34 |
showStale is false at all three levels — rows archived by the ratio-0 sweep ("code claims no longer exist") are out of the default view everywhere, and reachable in one click from Advanced → Content. This distinction is load-bearing: a rolled-up row has a parent standing in for it, so hiding it loses nothing; a stale row has nothing standing in for it, so hiding it under a checkbox labelled "rolled-up" is how a row disappears and nobody goes looking for it.
Full — every row, nothing folded
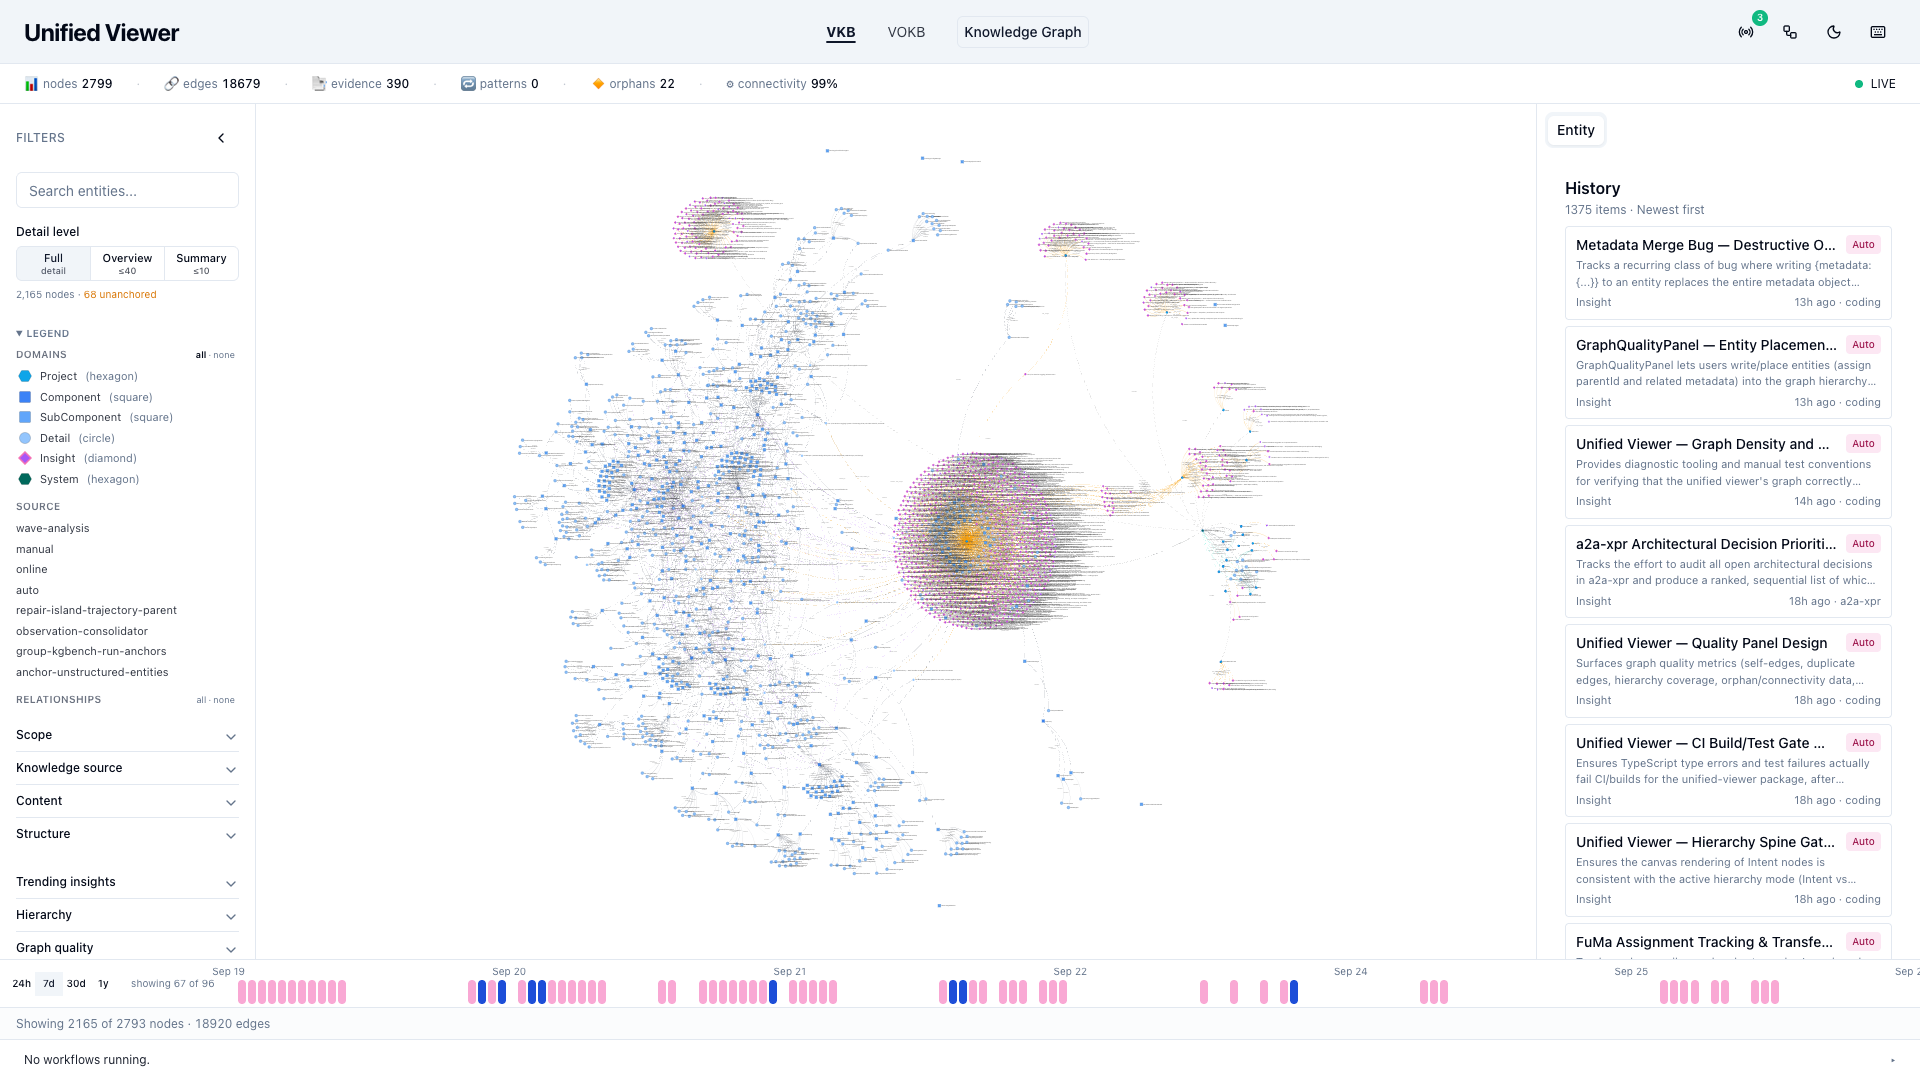
2,165 nodes · 68 unanchored. This is the audit view, and it is the picture that motivated the control: complete, correct, and unreadable. Note the legend — SubComponent (square) appears here and is absent at the other two levels, because all 405 of them are folded away the moment you leave Full.
Overview — where you land
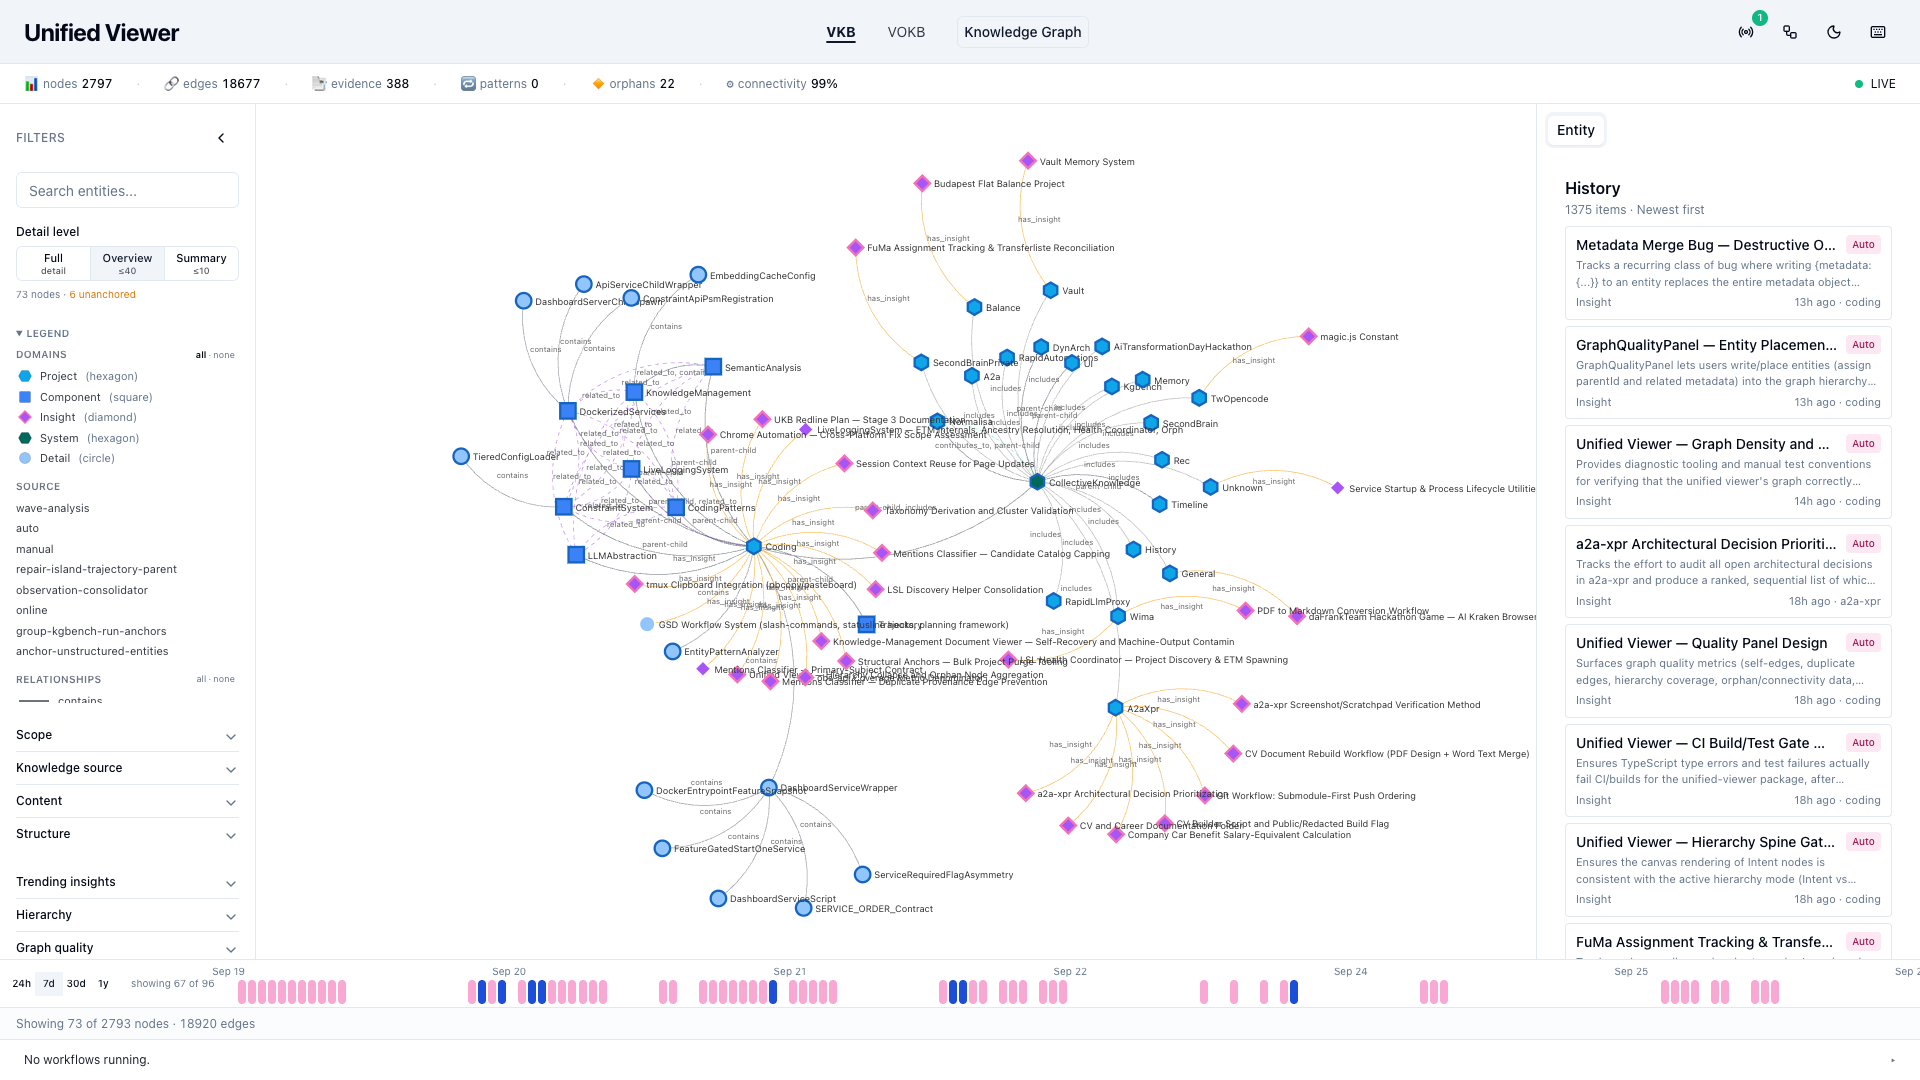
The readout under the control reads 73 nodes · 6 unanchored. CollectiveKnowledge sits at the centre, every Project hangs off it by includes, and the eight Component squares cluster around Coding. At the bottom edge, SERVICE_ORDER_Contract is drawn attached to DashboardServiceWrapper — one of the eleven rows placed on 2026-09-25.
What each flag removes
hideRolledUp— hides rows carrying botharchivedAtandrolledUpInto. Their roll-up parent is on the canvas in their place.collapseSubComponents— a SubComponent is drawn only while its Component is expanded, and the check is transitive: a row is hidden when any ancestor is a collapsed SubComponent, not only its immediate parent. A row whose ancestors contain nothing openable stays visible — hiding it would make it invisible because nobody placed it, which is the failure this whole view exists to surface.aggregatesOnly— keeps only rows that are themselves roll-up parents (non-emptymetadata.rollUpOf), withSystem/Project/Componentexempt so the survivors hang off the architecture instead of floating.
What survives, by class
| Ontology class | Full | Overview | Summary |
|---|---|---|---|
| Insight | 1,021 | 29 | 2 |
| Detail | 708 | 13 | 1 |
| SubComponent | 405 | 0 | 0 |
| Component | 8 | 8 | 8 |
| Project | 22 | 22 | 22 |
| System | 1 | 1 | 1 |
| Total | 2,165 | 73 | 34 |
The backbone — 31 rows of System + Project + Component — is identical at all three levels. Every node the control removes is an Insight, a Detail or a SubComponent. That is the whole mechanism in one table: detail levels fold the contents, never the skeleton, so the shape of the graph you learn at Summary is the shape you keep when you zoom in.
That also explains the ≤40 target: at Overview the backbone alone costs 31 of the 40, which is why the budget is checked per project against the worst one rather than store-wide.
Summary — the skeleton alone
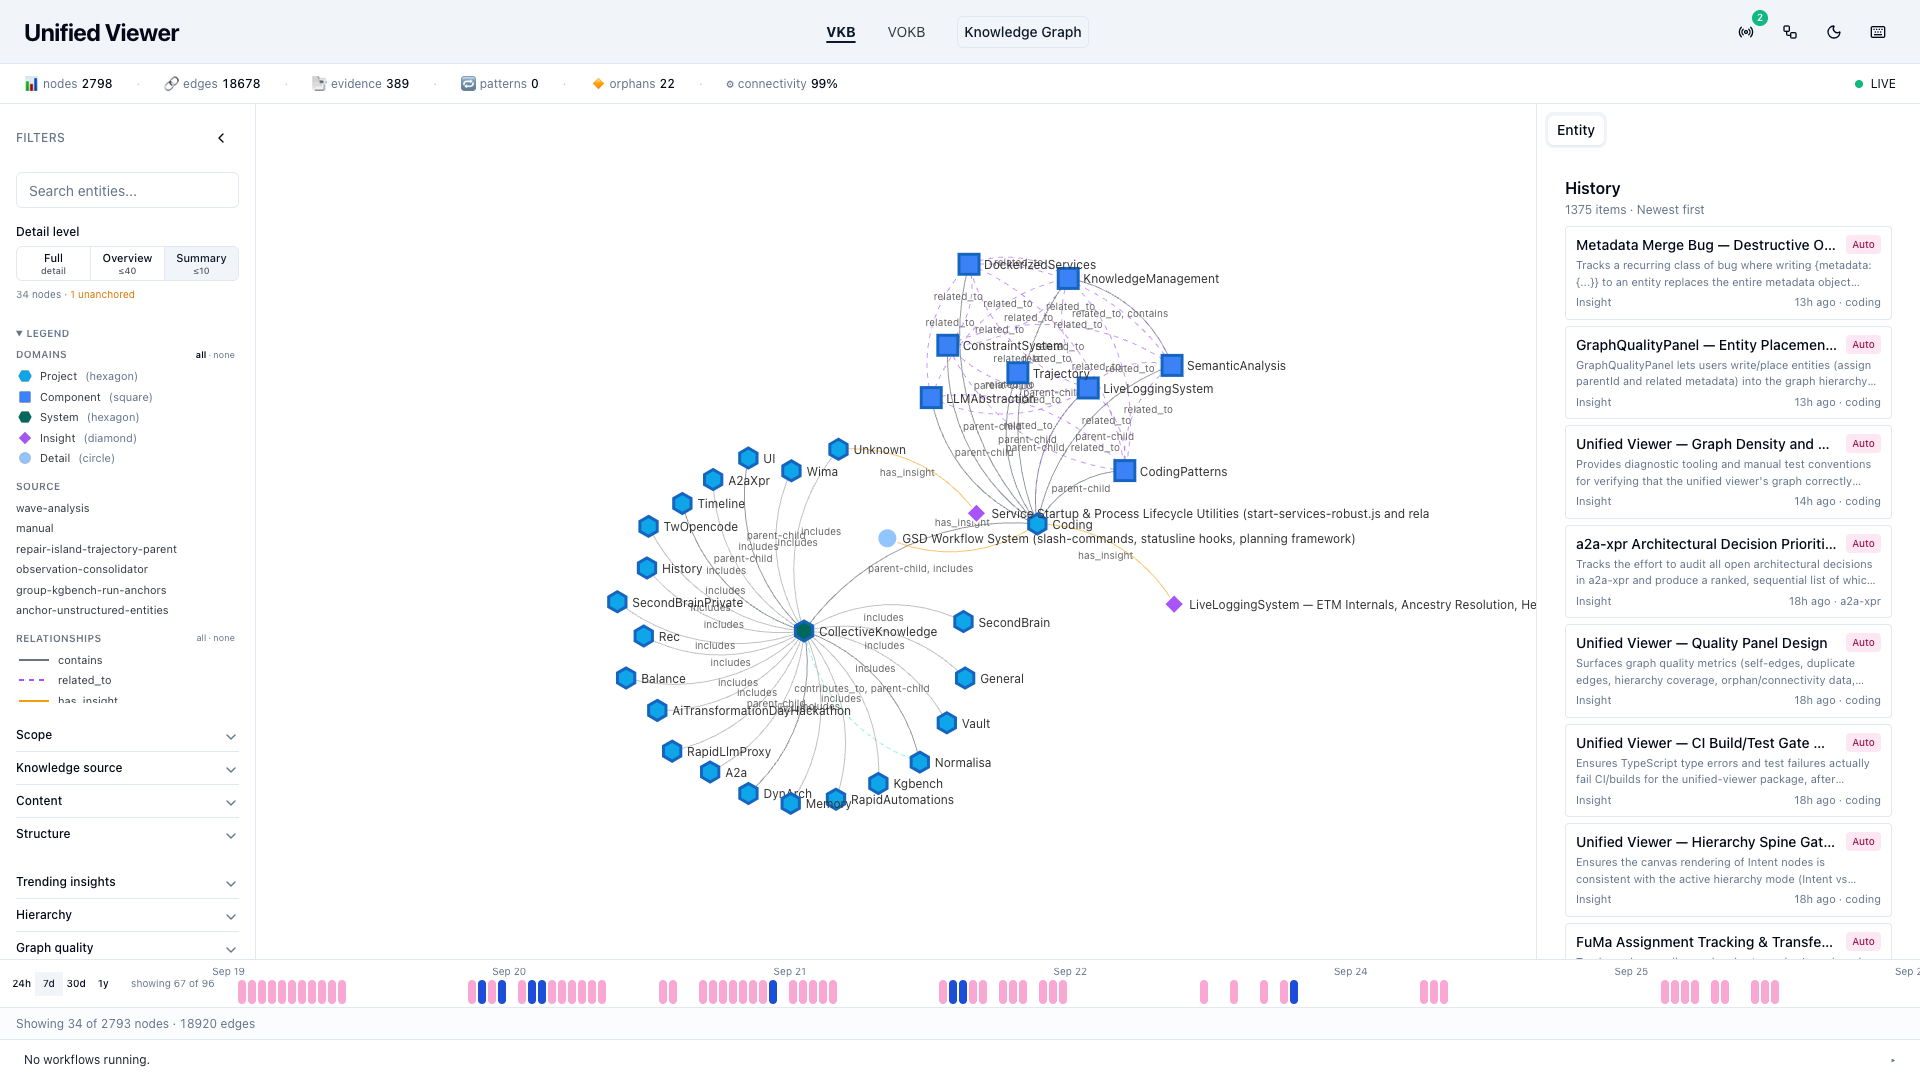
34 nodes · 1 unanchored. What is left is almost exactly the backbone: CollectiveKnowledge with every Project on includes spokes, and the Component squares above Coding on parent-child. Three non-structural rows survive — the two Insights and one Detail that are themselves roll-up parents, which is precisely what aggregatesOnly asks for.
Note that unanchored fell from 6 to 1: five of the six unanchored rows were folded away by the same filters, which is why the count is reported next to the level and not as a fixed store statistic.
Part 3 — what refuses to fold
Under the node readout sits a second number in amber: unanchored. Those are rendered rows with no Project or System anywhere above them — and they are the one population no detail level can help with, because folding is a walk up the parent pointers and these rows have none.
Live figures for the same snapshot:
rendered      73 nodes · 85 edges        worst project: Coding 30 / 40
unanchored     6
  wrongClass   1   a Project claims it via has_insight, but it is not classed
                   Insight, so the tree refuses the edge — an ontology decision
  danglingRef  5   the edge that should place it points at an entity not in the
                   store; placing the child would hide the break
  recordedParent 0 (was 11 — see below)
  unclaimed    0
The density gate fails on worst.nodes > 40 || unrooted > 0 — note the or — so this snapshot reports overBudget: true with overBy: 0 — every project is comfortably inside 40 and the failure is entirely the six unanchored rows. That asymmetry is deliberate: an unanchored row is invisible in the tree at every detail level, so it would otherwise fail silently.
Graph quality in the filter rail names each category and, for the one category that is safely automatable, offers a single action. On 2026-09-25 the recordedParent bucket held 11 rows whose writer had named a parent in metadata.parentId that nothing read; one click placed all 11 and the unanchored count went 17 → 6. The two remaining categories are deliberately not auto-fixable — one needs an ontology decision, the other would hide a broken reference.
Found while writing this walkthrough: the panel's Parent row was dead
The first draft of this page was illustrated with screenshots showing Parent: — and Level: — in the entity panel's IDENTITY block — for the Detail leaf, for the SubComponent, for the Component, and for Coding itself. That was not a property of those four rows. EntityDetailPanel.tsx rendered entity.parent and EntityIdentityHeader.tsx rendered entity.level, and measured against the live store:
| Field | Entities carrying it (of 2,801) | Who read it |
|---|---|---|
entity.parent | 0 | the panel's Parent row, the header's parent: chip |
entity.level | 0 | the panel's Level row, the header's L{n} chip |
metadata.parent | 0 | nobody (was HierarchyNavigator, fixed earlier) |
metadata.parentId | 845 | deriveParents(), the tree, the canvas |
So those slots could only ever print —, for every row, in every session. It is the same bug already fixed once in HierarchyNavigator — which read metadata.parent, set on 0 of 2,441 entities, and therefore rendered the project tree as ~1,341 siblings. The fix there was to stop reading a stored field and derive the parent from edges; the two panels were never migrated with it.
Fixed on 2026-09-26. Both render sites now fall back to graph/hierarchy-identity.ts, which reads the store's hierarchyParents map — the one deriveParents() writes and the canvas collapses by, so the panel cannot name a parent the canvas draws no edge to. Level became ontology depth (System 0 … Detail/Insight 4) rather than the dead 0–3 layer field. The screenshots above are the post-fix ones: the Detail leaf reads L4 · parent: SpecstoryApiClient, the SubComponent L3 · parent: LiveLoggingSystem, and Coding L1 · parent: CollectiveKnowledge.
Two details worth keeping:
- A stored field still wins, so a row that one day carries a real
parentis not overridden by the derived one. Today nothing does. - A parent the store does not hold renders as its id, not as
—. "Broken reference" and "is a root" are different facts, and there are 5danglingRefrows where confusing them would hide the break.
The regression test is the shape no earlier test used: an entity with neither field set. Every pre-existing case passed a synthetic entity that did carry level and parent, which is exactly why a suite of 1,043 green tests never saw this.
Reproducing these numbers
The node counts in this document are not read off a screenshot — they come from the same predicate the canvas draws with, replayed over the live store:
cd integrations/unified-viewer

# The default (Overview) view, as JSON
npx vite-node scripts/assert-graph-density.ts --json

# Any other level
GRAPH_DETAIL_LEVEL=full    npx vite-node scripts/assert-graph-density.ts
GRAPH_DETAIL_LEVEL=summary npx vite-node scripts/assert-graph-density.ts
The script imports isEntityVisible and deriveParents rather than reimplementing them, so it can only disagree with the canvas if the canvas itself changed. It seeds the store's own DETAIL_LEVEL_FLAGS table and hierarchySpine: 'code' — the rail's default tree. Omitting that last field is what once made the replay report 75 nodes against a canvas showing 73.
It exits non-zero when worst project > 40 || unrooted > 0, so a density regression fails a check instead of waiting to be noticed on a screenshot.
Source map
Paths are relative to integrations/unified-viewer/.
| Concern | File |
|---|---|
The ladder (System…Insight) and parent ranking | src/graph/hierarchy-parents.ts |
| The three flags and what each removes | src/graph/visibility-predicate.ts |
Preset table + deriveDetailLevel() | src/store/viewer-store.ts |
| The segmented control and its copy | src/panels/filters/DetailLevel.tsx |
| Unanchored categories | src/graph/attribution.ts |
| The panel that names and fixes them | src/panels/GraphQualityPanel.tsx |
| Replayable node count | scripts/assert-graph-density.ts |
See also
- Ontology — what each class is allowed to mean
- UKB & VKB — where the entities this view folds come from
- Knowledge Workflows — the pipeline that writes them