Status Line
The tmux bar is on screen the whole time you work. Learning to read it turns most "is something broken?" questions into a glance.
What a badge is telling you
The emoji is the label; the dot is the state. The leading emoji says what the badge is about and never changes; the tinted ● after it says how that thing is doing.
[🏥●] [AX●C●] [🔒72%●7] [📚●] [N:OPEN P:AUTO] [🧠●] ███░░░░░ 47% [📋8-9] 08:20
| Segment | Means |
|---|---|
[🏥●] | Overall system health |
[AX●C●] | Active sessions per project — your pane's project is underlined |
[🔒72%●7] | Constraint compliance; ●N in amber appears when there are violations |
[📚●] | Knowledge pipeline freshness |
[N:OPEN P:AUTO] | Where this machine is, and how it gets out — one bracket, because you read them together |
[🧠●] | Proxy semantic readiness |
███░░░░░ 47% | How full this pane's conversation context is |
[📋8-9] | Session logging time window |
Each badge belongs to a feature, and a feature you have switched off contributes no badge at all — see Composing What Runs.
The badges are clickable
Clicking a badge opens the thing it describes. Two kinds of target: a page, which reuses the browser tab you already have open, and a popup over your pane, dismissed with any key.
| Click | Opens |
|---|---|
[🏥●] | The health dashboard |
| one project bubble | that project's repository page — not the underlined one |
[🔒72%●7] | The constraint dashboard |
[📚●] | The observations tab |
[N:OPEN P:AUTO] | Popup: where your traffic goes right now |
[🧠●] | Popup: why the semantic badge is the colour it is |
| the gauge | Popup: context in tokens, not just a percentage |
[📋8-9] | The sessions tab |
The clock is deliberately inert. Every action is read-only — a stray click cannot restart, toggle or write anything.
Two absences that are good news
[LSL●] appears only when session logging for this pane is unhealthy — no badge means it is fine. [L:n] and [D:n] (local executions, prompt downgrades) are hidden at zero.
The gauge is the odd one out
The context gauge has no brackets and no emoji — it carries a tinted background instead, which is what separates it. It describes the agent in this pane, not the system.
A pane that has just started shows the gauge's zero position — an empty trough at 0% — until its agent first reports. That is a new session, not a fault. A gauge that is absent altogether means the agent has no readable context store at all, which is a different thing and looks different.
Colours
Red is reserved. Knowledge-pipeline staleness fades through a green ramp rather than going red, so "getting old" and "actually broken" never look the same.
How it gets rendered
status-right invokes a small CommonJS fast-path reader that serves a per-pane pre-rendered cache in roughly 60 ms, and only spawns the full renderer when that cache is stale. The full renderer pulls live state from the health coordinator on :3034 — the single source of truth — and every coordinator-derived badge shares one memoized probe per render, so a bar with eight badges still makes one call.
That two-stage design is why the bar can update every five seconds without the cost showing up anywhere.
Reading state
Every badge follows the same convention: a fixed emoji identifying the subject, then a glyph carrying the state. Where the state is purely a severity it is a tinted dot on a shared four-colour scale, so you learn one scale rather than one vocabulary per badge.
Session activity uses a graduated green ramp rather than a binary, which is how an idle session is distinguishable from an active one without a second glyph.
The context gauge
The gauge shows how full the conversation in this pane is — not a system metric, and not shared between panes. It is deliberately the only segment without brackets or a leading emoji, using a tinted background as its delimiter instead, so it reads as a different kind of thing at a glance.
Why some badges are missing
Several segments are hidden in their healthy or zero state, on the principle that a bar full of "everything is fine" is harder to scan than one that only speaks up when it has something to say:
| Segment | Hidden when |
|---|---|
[LSL●] | Session logging for this pane is healthy |
[L:n] | No completions served locally |
[D:n] | The prompt classifier is off, or nothing was downgraded |
●N in the constraint badge | No violations |
Clicking a badge
tmux can make a span of the status line a mouse target, so each field is wrapped in a range carrying its own tag; a click reports that tag to a binding, which hands it to a small dispatcher. The clock carries no range, which is why it does nothing.
Pages reuse a tab. A status line is clicked often, so opening a new tab each time would bury the browser in duplicates. The dispatcher looks for a tab already showing the dashboard and navigates that one to the route you asked for — which is also how the sub-tab gets selected. A tab already on the target is focused without reloading, so scroll position and filters survive.
Only the top-level tabs are routes and therefore addressable this way. The nested tabs inside Token Usage and Performance are component state, not URLs, so a click lands on the page and not on the inner tab.
Popups answer the question the badge raises. A two-cell badge can say that something is wrong but never what, so the three fields whose subject has no page of its own open a report instead.
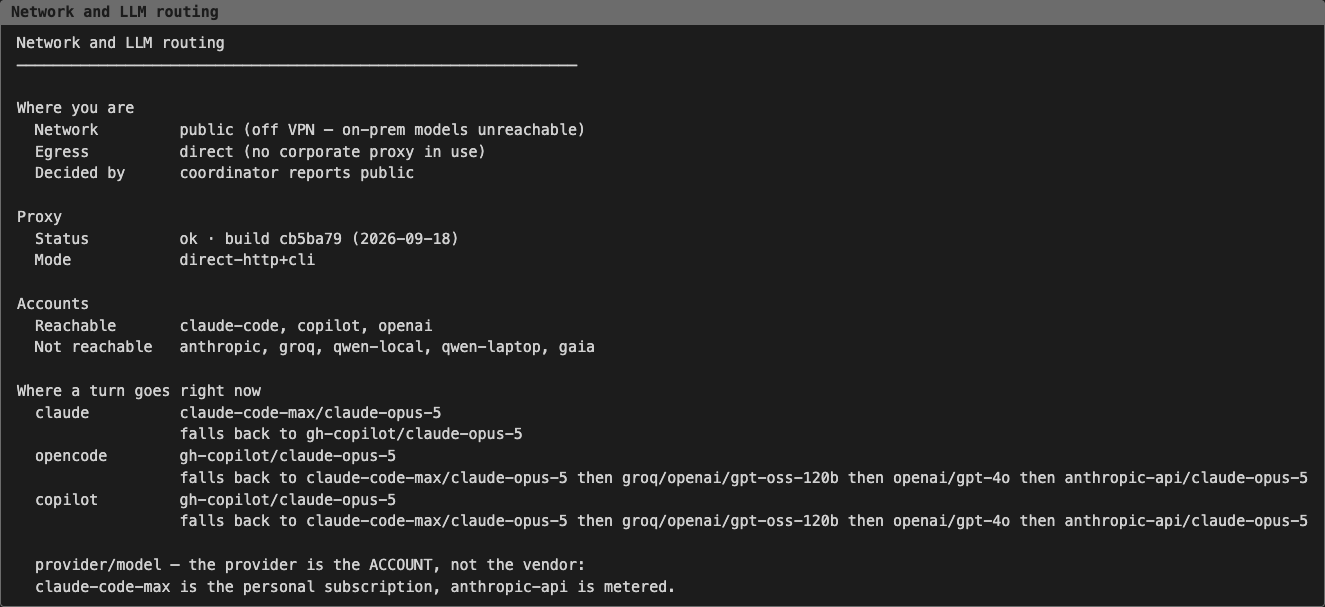
The network badge answers where your traffic actually goes — which is not obvious from [N:OPEN P:ON], and changes with the network:
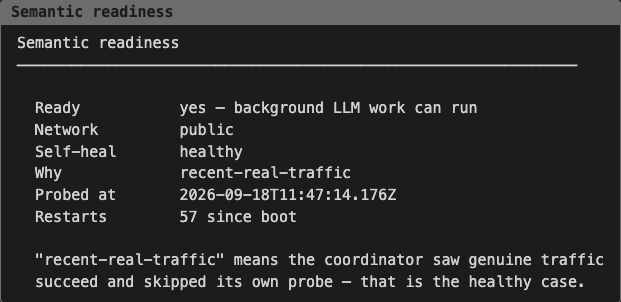
The semantic badge explains its own colour. recent-real-traffic is the healthy case — the coordinator saw genuine traffic succeed and skipped its probe — which reads like a fault until something says so:
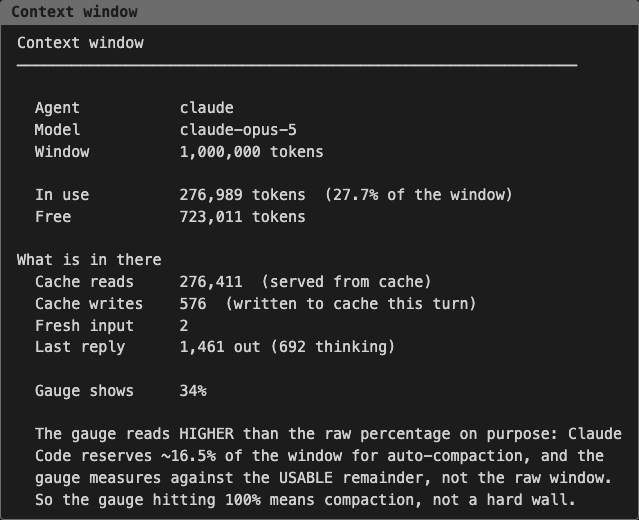
The gauge popup gives the context in tokens against the real window, and explains why it reads higher than the raw percentage: Claude Code reserves ~16.5% of the window for auto-compaction, and the gauge measures against the usable remainder:
When the bar itself is wrong
The status line is a reader. A grey or stale health badge means the thing it reads from has stopped, not that the services it describes have — check the coordinator first.
A project missing from the session list means that project has no session monitor running, which is different from its monitor being unhealthy. And a stale bar after a code change is usually a long-lived tmux session still executing an older binary; check what is actually on disk before chasing the rendering.
Changing it
The bar is configured per project and rendered by a shared script, so a change affects every agent's session. Because sessions can override global tmux settings, read the live environment of the running session rather than the config file when a setting appears not to apply.
Real-time visual indicators of system health and development activity rendered via the unified tmux status bar. All coding agents (Claude, CoPilot, etc.) are wrapped in tmux sessions; status-right invokes status-line-fast.cjs, a CommonJS fast-path reader that serves a per-pane pre-rendered cache (~60 ms) and spawns the full combined-status-line.js (CSL) renderer only when the cache is stale. The renderer pulls live state from the health coordinator at :3034 (Phase 33 single source of truth, replacing the retired host-side health-verifier daemon and .health/verification-status.json file). All coordinator-derived badges share a single memoized probe per render — see Architecture → Shared coordinator probe.

Reading the Status Line
Example Display
[🏥●] [RA●C●] [🔒77% ⚙️IMP] [📚●] [N:VPN P:ON] ███░░░░░ 42% [📋18-19] 18:34
The current pane's project is rendered with an underline (#[underscore]…#[nounderscore]) so each parallel tmux window highlights its own project.
Component Breakdown
| Component | Example | Description |
|---|---|---|
| System Health | [🏥●] green | Coordinator-derived health rollup (services + databases + container) |
| Active Sessions | [RA●C●] | Per-project abbreviations with a graduated green activity ramp |
| LSL Health | [LSL●] | Live-session-logging monitor for THIS pane — hidden when healthy |
| Constraint | [🔒77%] | Code quality % (with optional ●N (amber) violations sub-segment when non-zero) |
| Knowledge Pipeline | [📚●] green | Observation/digest/insight pipeline freshness |
| Network + egress | [N:VPN P:ON] | Where the machine is (VPN / CN / OPEN / ??) and how it gets out (ON / AUTO / OFF), in one bracket |
| Prompt Downgrades | [D:12] | Turns the prompt classifier moved to a cheaper band since proxy start — absent when the classifier is off |
| Local Execution | [L:3] | Completions served by hardware we own — absent at zero |
| Context Window | ███░░░░░ 42% | How full THIS pane's agent conversation is — see Context Window Gauge |
| LSL Time Window | [📋18-19] | Session time range (HHMM-HHMM) |
| Time | 18:34 | Local HH:MM, anchored to the right edge |
The context gauge is the one segment with no […] brackets and no leading emoji: it carries a tinted background instead, which delimits it on its own.
Complete Glyph Reference
Every badge follows one rule: the emoji is the label, the dot is the state.
The leading emoji (🏥 🔒 📚 🧠) says what the badge is about and never changes. The glyph after it says how that thing is doing, and when the answer is purely a severity it is a tinted ● on a shared four-colour scale:
| Dot | Meaning | tmux colour |
|---|---|---|
| ● green | Healthy | colour41 — the same green as an Active project, so "green means fine" reads identically everywhere on the bar |
| ● amber | Warning — degraded, or violations present | colour214 |
| ● red | Critical — downed service, unreachable API | colour196 |
| ● grey | Idle or offline | colour238 |
Some states are not severities, and those keep a pictogram, because a dot scale can only say how bad — never what happened:
| Glyph | Meaning |
|---|---|
| ⏰ | Stale — the data itself is too old to trust |
| ⏳ | Pending / aging |
| 🔇 | Suppressed (idle-quiesced, not broken) |
| ❓ | Unknown — probe returned nothing usable |
| 🚫 | Blocked |
System Health Indicators
The badge is derived live from the coordinator at :3034/health/state. There is no longer a host-side health-verifier daemon; the badge reflects the coordinator's rollup of probed services, database checks, and container healthcheck.
| Display | Meaning | Action |
|---|---|---|
[🏥●] green | All systems healthy | None needed |
[🏥●] amber | Non-critical issue (e.g. degraded service or GCM warning) | Check dashboard for details |
[🏥⏰] | Stale — coordinator's generated_at >3 minutes old | Coordinator may be down; check container |
[🏥●] red | Critical issue (downed service, unhealthy DB, container probe fail) | Immediate attention required |
[🏥●] grey | Coordinator unreachable | Verify dashboard service is running |
Session Activity Indicators
Sessions use a graduated green ramp based on time since last activity. All sessions are always displayed — sleeping sessions show as a grey dot, never hidden. Sessions are only removed when the agent process exits.
The "time since last activity" signal is the newest timestamped record in the project's Claude .jsonl transcript — i.e. the time of the last prompt boundary.
It is deliberately not the file's mtime
Claude Code rewrites four trailing bookkeeping records — last-prompt, ai-title, mode, permission-mode — on a session that is merely open, and none of them carry a timestamp. A transcript last spoken to days ago therefore has an mtime from minutes ago. Bucketing on mtime pinned every live session near the top of the ramp and made the Fading / Inactive / Sleeping rungs unreachable; only timestamped records mean somebody actually said something.
A long-running agent turn (one prompt that takes 25 minutes) writes nothing to the transcript while it's in flight, so a project actively being worked on by an agent looks idle by timestamp alone. To capture that, a heartbeat promotion rule overrides the transcript-derived band: if the project's ETM heartbeat (state.lsl[*].lastBeat) is fresh (< 5 min) and there is genuine recent content activity, a non-Active band is promoted to Active. The heartbeat alone is not sufficient — it also fires after laptop wake — which is why the second condition exists. The promotion also handles non-Claude sessions (OpenCode / Copilot) whose transcriptPath is not a real file.
| Shade | Band | Age since last activity | Meaning |
|---|---|---|---|
● bright green (colour41) | Active | < 5 minutes | Someone is working here now |
● mid green (colour34) | Cooling | 5 – 30 minutes | Just stepped away |
● dark green (colour28) | Fading | 30 min – 6 hours | Idle, still tracked |
● very dark green (colour22) | Inactive | 6 – 24 hours | Dormant but open |
● grey (colour238) | Sleeping | > 24 hours | Long-term dormant |
| ❌ | Error | Any | Health check failed or service crash |
Visual progression: one glyph, five shades — the dot darkens through green as the signal ages, then drops to grey once the session has been idle over a day. Unicode has only one green circle emoji, so the ramp is a 1-cell ● tinted with tmux colours rather than an emoji sequence.
● Active → ● Cooling → ● Fading → ● Inactive → ● Sleeping
(colour41 → colour34 → colour28 → colour22 → colour238)
   <5min      5-30min     30m-6hr     6-24hr       >24hr
Color choice rationale
The lifecycle stays inside a single green ramp so that "older" is a smooth luminance change rather than a hue jump. Project-level alarms (warning / critical, emitted when the ETM itself is degraded or stopped) are ALARM_DOTS — the same one-cell ●, rendered bold on the brightest amber (colour214) or red (colour196).
Alarms used to stay emoji on purpose, the argument being that an alarm must break the pattern rather than read as one more point on the fade scale. That requirement still holds; bold is what now satisfies it. Every ramp shade is dim and un-bolded, so a bold pure-red ● is the only high-intensity mark on the line — it breaks the pattern in one cell instead of two, and needs no codepoint-widths override.
ALARM_DOTS is kept distinct from STATE_DOTS.WARN/CRIT (used by [🔒] and [🏥]): those mark a badge's own severity, where the dot stands alone and is salient for free. ALARM_DOTS sit inside a row of other dots — the per-project session list — where salience has to be won.
The ramp used to detour through 🟠 (orange) and 🟤 (brown) for its middle rungs, because Unicode contains exactly one green circle emoji (🟢 U+1F7E2) — a green fade is simply not expressible in emoji. Those hue swings read as distinct states rather than as a fading signal. Switching to a tmux-tinted ● gives a real luminance ramp, and as a side benefit removes the emoji-width hazard: ● (U+25CF) is one cell in both tmux and the terminal, so it needs no codepoint-widths override to stay aligned.
Agent Age Cap
When an agent process (Claude, Copilot, OpenCode) is running, the displayed age is capped at the transcript monitor's uptime. This prevents a freshly started session in a project with old transcripts from immediately showing as dormant — the session starts green and naturally progresses through the cooling scheme based on how long the current session has been idle.
Not-Found Transcript Guard
Agents that don't produce Claude-compatible transcripts (e.g., OpenCode) have transcriptInfo.status: 'not_found'. The age cap logic skips these sessions — they correctly display as the Inactive shade instead of falsely showing as Active.
Network & Proxy Indicators
Two ASCII-only badges reflect the network environment detected by the coordinator every 15 seconds. They avoid emoji to prevent cell-width issues in tmux.
| Display | Meaning | Action |
|---|---|---|
N:VPN | Connected via corporate VPN (Cisco CLI or utun interface detected) | Normal remote-work state |
N:CN | On the physical corporate network (BMW DNS resolves via dig, TCP latency <100 ms, no VPN interface) | Normal on-site state |
N:OPEN | Home / public network — no VPN, no corporate LAN | Expected off-VPN |
N:?? | Network location unknown (coordinator just started or probe failed) | Transient — clears within 15s |
| Display | Meaning | Action |
|---|---|---|
P:ON | Daemon running + functional AND user toggled px on | Normal on VPN/CN |
P:AUTO | Daemon running + functional, px toggle off — adaptive --direct-fallback mode; pinned sessions still routed | Normal off-CN state |
P:OFF | Daemon down or not functional | Problem on VPN/CN (bar turns yellow); investigate proxydetox |
P: is three-state since 2026-07-26
Since the always-on proxy redesign (2026-07-25), the proxydetox daemon stays loaded on :3128 regardless of the px toggle — agent sessions are pinned to it and its --direct-fallback adapts routing per request. A daemon-truth-only badge would therefore read ON nearly always. The badge now combines daemon truth with user intent (proxy_enabled_by_user from the coordinator): ON (daemon healthy + px on), AUTO (daemon healthy, px off), OFF (daemon down/not functional — the only broken state). The former P:ERR state remains removed.
Proxy toggle via px
The px alias toggles proxydetox via launchctl unload/launchctl load (not stop/start, which was ineffective due to launchd socket activation). After toggling, px invalidates all status line caches and triggers an immediate coordinator re-probe via POST /health/refresh. The P: badge updates within ≤5 seconds (one tmux refresh cycle). See Network Configuration → Proxy Management for details.
VPN / network detection logic (3-signal approach)
The coordinator determines location using three independent signals. N never depends on proxy state.
Signal 1 — Cisco VPN CLI: runs /opt/cisco/secureclient/bin/vpn state. If the output contains "Connected" → vpn.
Signal 2 — utun interface detection: parses ifconfig for any utun* interface with an inet address. If found → vpn.
Signal 3 — BMW internal DNS: spawns dig +short muc.proxy-pac.bmwgroup.net (fresh subprocess — always uses current OS DNS servers, never stale). If resolution succeeds, measures TCP latency to the resolved address: latency <100 ms → corporate (on-site LAN); latency ≥100 ms → vpn (tunnelled). If resolution fails entirely → open (home / public network).
Signals are evaluated in order; the first match wins.
Routing & Execution Indicators
Two ASCII-only counters describing what the LLM proxy did with the traffic it was given. Both are read from the coordinator, which polls rapid-llm-proxy (:12435) on its own cheap GETs — /api/llm/classifier/stats and /api/llm/execution/stats — every coordinator tick. Neither costs a model call.
Both count since the proxy started. A proxy restart resets them at the source, so the one non-monotonic transition you will see is the number going down; that is a restart, not a bug.
| Display | Meaning | Action |
|---|---|---|
[D:12] | The prompt classifier has moved 12 turns to a cheaper band since proxy start | Informational |
[D:0] | Classifier is on and has downgraded nothing — it may simply have seen no eligible traffic | Informational |
| (absent) | Classifier is off (enabled !== true), or the coordinator is unreachable | Expected on a machine that does not use it |
| Display | Meaning | Action |
|---|---|---|
[L:3] | 3 completions were served by hardware we run ourselves | Informational |
| (absent) | Either nothing ran locally (local === 0), or the coordinator has never successfully polled the proxy (last_poll null) | Expected off-VPN with the laptop target off |
Neither badge ever colours the bar. A classifier that has downgraded nothing and a machine that has run nothing locally are both ordinary states, usually meaning "no eligible traffic" — a badge that turned the line yellow on an absence would cry wolf every quiet hour.
[D:] is not [L:] — the two sets barely overlap
It is tempting to read the downgrade counter as "how much ran locally". It is not, and labelling it L would state something false:
- A downgrade need not be local. Off VPN with the laptop target switched off — the current default — a downgraded turn goes to
gh-copilot/claude-haiku-4.5: cheaper, still metered, still off-machine. - Local execution need not be classified. The background services that do reach a local box (
bg-observation-writer,bg-health-coordinator) declare their band in config and are never asked for a verdict, so they never appear in[D:]at all.
"How much did the classifier save" and "how much ran on our own hardware" are two real and different questions, so they get two counters. [L:] is read off the provider that answered, so an offload that timed out at 20 s and fell back to gh-copilot does not appear — that work ran on a paid account, whatever the route intended.
Why [L:] hides at zero but [D:0] renders
Off VPN with qwen-laptop disabled, zero is the correct and permanent answer for [L:], so a badge that always read [L:0] would be a line of noise on every render. [D:0], by contrast, is a live figure that can change on the next turn, and the classifier's own enabled flag already suppresses the badge entirely on machines that do not use it.
Both distinguish "measured zero" from "no data". getExecutionStatus() returns null unless execution.last_poll is set: zeroes from a coordinator that has never reached the proxy are an absence of data, not a measurement, and rendering them as one was the exact mistake [D:] was fixed for.
Diagnosing an absent [L:]
An absent badge is usually correct, not broken. Confirm the chain rather than guessing:
# 1. Is the proxy counting at all?
curl -s localhost:12435/api/llm/execution/stats
#    {"sinceBootMs":49358423,"completions":353,"local":0}

# 2. Did the coordinator read it? (last_poll present = real zero, not no-data)
curl -s localhost:3034/health/state | python3 -c \
  "import sys,json; print(json.load(sys.stdin)['execution'])"

# 3. Why did nothing offload? The proxy names the reason itself.
curl -s 'localhost:12435/api/llm/routing/resolve?job=fg-chat/opencode&complexity=small' \
  | python3 -c "import sys,json; print(json.load(sys.stdin)['route']['offloadSkipped'])"
#    no offload target for network=public
#    (targets: qwen-local[corporate/fg+bg], qwen-laptop[public/fg] (off))
The common answers: the network has no eligible target (qwen-local is corporate-only, qwen-laptop public-only), the eligible target is enabled: false (the safe default), or the work is foreground claude — which can never offload on any network, because it arrives on the Anthropic wire at /v1/messages and no local provider carries fg_transport. See LLM Routing → Semantic offload.
Knowledge Pipeline Indicators
The badge reflects the freshness of the observation → digest → insight pipeline (the obs_api service backed by km-core GraphKMStore at .data/knowledge-graph/; the legacy .observations/observations.db SQLite store was archived 2026-06-05 under Phase 44 Plan 18). Verdict is driven by observation freshness only — digest and insight cadences are intentionally slower and don't gate the badge. Source: state.knowledge_pipeline at the coordinator's /health/state (populated by pollKnowledgePipeline, which calls obs_api's /api/consolidation/status).
| Status | Icon | Meaning |
|---|---|---|
| Healthy | [📚●] green | Last observation written within 15 minutes — pipeline is ingesting |
| Fresh | [📚●] bright green | Last observation 15 min – 1 hour ago |
| Aging | [📚●] mid green | Last observation 1 – 3 hours ago |
| Fading | [📚●] dark green | Last observation 3 – 6 hours ago |
| Dormant | [📚●] very dark green | Last observation 6 – 12 hours ago |
| Sleeping | [📚●] grey | Last observation > 12 hours ago |
| Disabled | [📚🔇] | obs_api reachable but no rows in any pipeline table |
| Unknown | [📚❓] | Coordinator just started, slice not yet populated |
| Unreachable | [📚●] red | obs_api unreachable, returning non-OK, or returning unparseable JSON |
Red is reserved for pipeline failure
🔴 is shown only when obs_api is unreachable (confirmed pipeline failure). Time-based staleness uses a graduated fading scheme — a single ● tinted from bright green down to grey (colour41 → colour34 → colour28 → colour22 → colour238) — and red is never used for age alone.
Idle suppression is applied via CombinedStatusLine.isUserActive(), which checks state.lsl for any session whose lastBeat is within 5 min. When no session is heartbeating, the freshness-derived icons collapse to a single grey ● (idle, colour238). True error states (disabled, unknown, unreachable) are NOT suppressed.
Tooltip details (visible in the verbose status output) include observation/digest/insight ages, totals, and any in-flight consolidation.
LSL Health Indicators
Whether an enhanced-transcript-monitor (ETM) is actually watching this pane's project. Hidden entirely when healthy — the badge only appears when there is something to say.
| State | Badge | Meaning |
|---|---|---|
| Healthy | (hidden) | An ETM is heartbeating for this project |
| Starting | [LSL●] grey | Session is < 60 s old and its ETM has not heartbeat yet |
| Stale | [LSL●] bold amber | ETM alive but degraded — 0 exchanges in > 30 min uptime, or heartbeat > 2 min old |
| Down | [LSL●] bold red | ETM stopped, or no monitor at all for this project |
Why 'starting' exists
Closing a session makes the coordinator reap its ETM within one 5 s tick, while respawning was gated by ETM_SPAWN_INTERVAL_MS = 30_000. So every freshly opened session began with a red [LSL●] for up to thirty seconds — and it was telling the truth: nothing was logging that session yet.
Two changes fixed it. scripts/tmux-session-wrapper.sh now POSTs an etm_ensure signal to the coordinator at launch, which spawns the monitor for that one project immediately (measured: 106 ms, against up to 30 s before). And the badge distinguishes a seconds-old session from a dead monitor, so start-up reads as start-up rather than as an alarm. Grey deliberately does not drag the line's overall colour — a session three seconds old is not a degraded system.
The grace window is bounded at 60 s, and an unknown session age falls back to "old", so a genuinely broken launch still goes red. Session age comes from .data/agent-sessions/<tmux-session>.json, written by the launcher.
Context Window Gauge
How full the current pane's agent conversation is. It used to exist only inside Claude's own statusline, so only one of the four agents had it; it now lives in the tmux bar, where opencode, copilot and pi panes get the same reading.
███░░░░░ 42%
A bright fill over a duller background of the same hue — the fill reads as a watermark against a tinted trough. Thresholds are the ones the old Claude meter used:
| Used | Fill | Background | Meaning |
|---|---|---|---|
| < 50% | colour46 bright green | colour22 dark green | Comfortable |
| 50 – 64% | colour226 yellow | colour58 olive | Filling up |
| 65 – 79% | colour208 orange | colour94 brown | Getting tight |
| ≥ 80% | colour196 red, bold | colour52 dark red | Compaction is close |
██░░░░░░ 31% ████░░░░ 55% █████░░░ 71% ███████░ 93%
The zero position, and the absence
A pane whose agent has not reported yet renders the gauge's zero position — an empty trough at 0%, in the calm band:
░░░░░░░░ 0%
That window is real: on a fresh session the agent has not drawn its own status line yet, so the bridge file the gauge reads does not exist. It used to render as a 13-cell blank, which on screen is a black hole in the bar — indistinguishable from a fault, and it lasted until the first command.
The principle behind that blank is kept, because it is right: a gauge reading 0% and a gauge that cannot see its source must not look the same. It was being applied to the wrong case. A brand-new session is not a gauge that cannot see its source; it is a gauge whose source has nothing to report yet, and one tick later the agent reports exactly this — 0%.
The distinction survives where it is still real. hasContextReader() separates the two reasons there might be no number:
| situation | render |
|---|---|
| supported agent, nothing reported yet | zero position — ░░░░░░░░ 0% |
| no reader for this agent at all | no gauge, and the bar closes up around it |
The second is structural — no next tick is going to change it — so it stays absent.
Why the ≥80% band has no 💀
Claude's meter prefixed a skull at 80%. That prefix is three extra cells in one state only, and this segment is a fixed 13 cells in every band (8 bar + 1 space + 4 for the right-padded percentage) — measured against tmux, not assumed. status-line-fast.cjs substitutes a freshly rendered gauge into a line the full renderer has already truncated and left-padded, so a width that changed with severity would push the payload past the pane edge and reintroduce the trailing-residue artifact (15:322). Severity is carried by colour and bold instead, which is what every other badge on this bar already does.
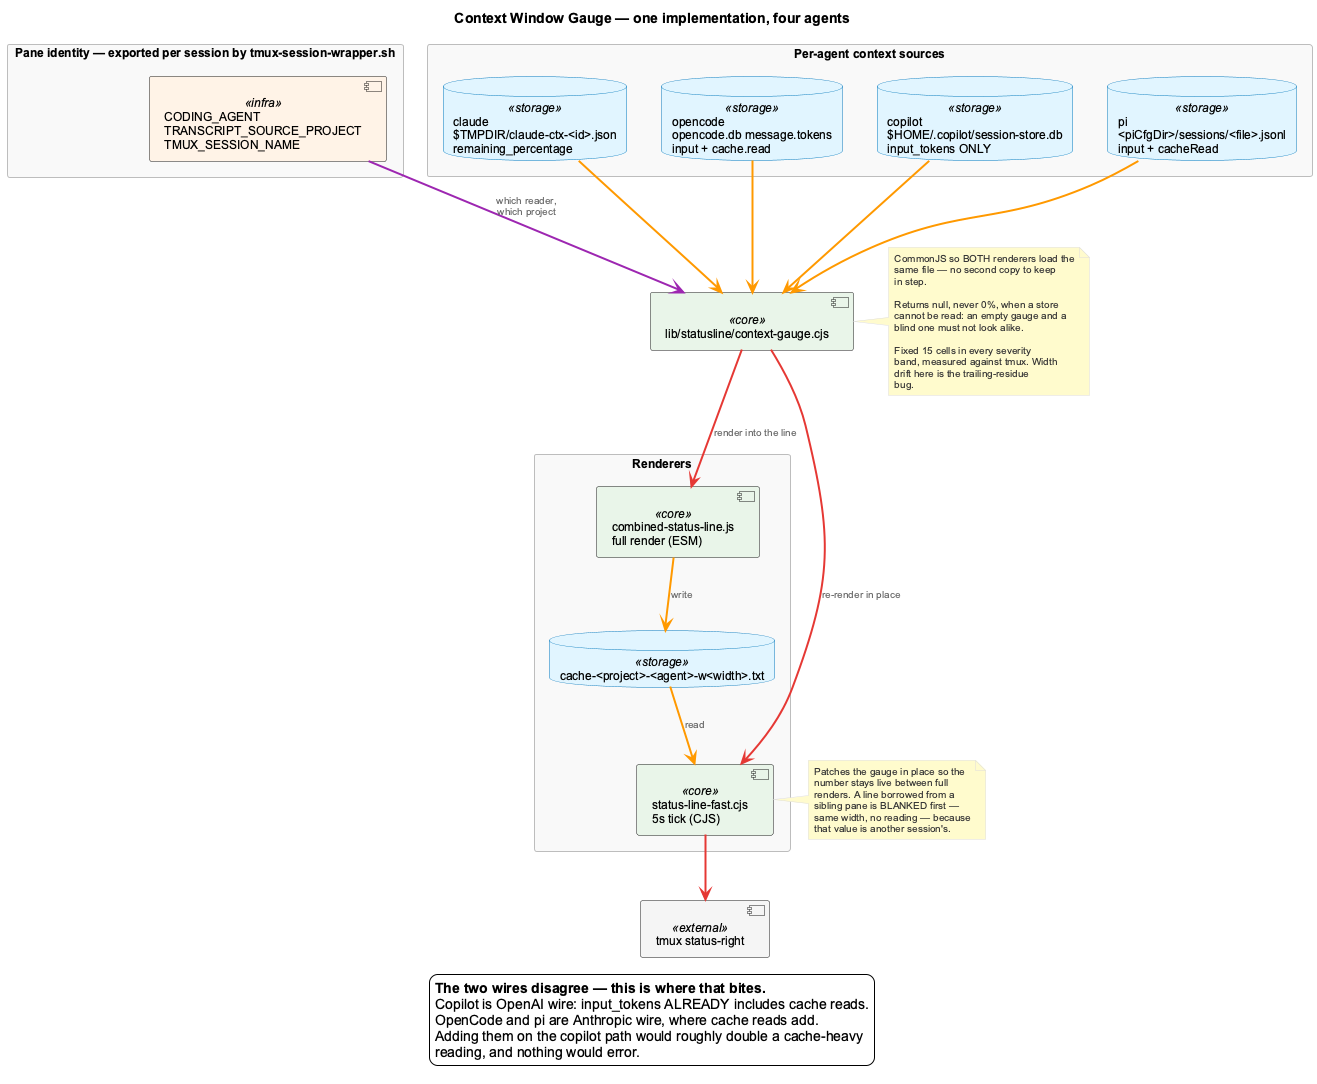
Where the number comes from, per agent. All four are exact on-disk sources — none is estimated:
| Agent | Source | Field |
|---|---|---|
claude | $TMPDIR/claude-ctx-<sessionId>.json (written by Claude's own statusline) | remaining_percentage, normalised against the autocompact reserve |
opencode | ~/.local/share/opencode/opencode.db → newest assistant message rows | tokens.input + tokens.cache.read |
copilot | ~/.copilot/session-store.db → assistant_usage_events | input_tokens only |
pi | <piCfgDir>/sessions/<encoded-cwd>/*.jsonl → last usage record | usage.input + usage.cacheRead |
The two wires disagree — copilot is the trap
Copilot reports OpenAI-style usage, where input_tokens already includes cache reads. OpenCode and pi report Anthropic-style usage, where they add. Adding cache_read_tokens on the copilot path would roughly double a cache-heavy session's reading, and nothing would error — the gauge would simply be wrong. This is the same two-wires distinction documented for token accounting in CLAUDE.md.
Also deliberately unused: opencode's session.tokens_input column. It is a cumulative spend total (measured: 91,977 on a session whose last turn was 243 tokens), not context occupancy.
Which Claude session the gauge reads. The bridge file is keyed on Claude Code's own session id, so the renderers have to know which session owns the pane before they can read anything. That id is recorded by scripts/claude-statusline.cjs, the shim Claude Code runs as its status line — the one place that sees the session id (handed to it on stdin) and the tmux session together. It writes $TMPDIR/claude-tmux-session-<tmux-session-name>.json on every render, and both renderers look the pane up there first.
The key is the tmux session name, not the pane: tmux runs status-right in the server rather than in a pane, so the renderers never receive TMUX_PANE — what the format string passes them is #{session_name} as TMUX_SESSION_NAME. It is also the right granularity, since status-right is drawn once per tmux session and these agent launches are one tmux session apiece.
Without a record the renderers fall back to their older project-keyed lookups — the newest-beating coordinator LSL entry in the full render, the single transcript path per project in the fast path's sidecar. Those name a project, not a session, so on a project that has hosted more than one they can name the wrong one, and the per-pane tie-break meant to disambiguate them never fires (coordinator entries take their pane from the ETM heartbeat, and ETMs are project singletons carrying only the launcher's pane, so tmuxPane is null in practice). The symptom was a first-turn session rendering the context of the session the user had just closed until its own ETM registered and out-beat the old one's remaining heartbeats — measured at 66%, which is exactly what the previous session's bridge file normalises to while the fresh one said 13%. The fallback is kept for panes with no record: an unwrapped claude, or the tick before the first render.
Records expire after 24 h. That is not a freshness requirement — a live session rewrites its record on every render, but an idle one may not render for hours and must keep its mapping. It bounds the one case where the name alone is ambiguous: tmux session names embed the launcher pid, and pids come round again after a reboot.
Reclaiming the temp files. Three families accumulate in the system temp directory, one per session, and until recently nothing removed them: claude-ctx-<sessionId>.json, GSD's claude-ctx-<sessionId>-warned.json companion, and the claude-tmux-session-<name>.json records above. scripts/claude-ctx-sweeper.mjs deletes them once they pass CLAUDE_CTX_RETENTION_DAYS (default 2), and is run from the agent launch path in bin/coding — backgrounded, and rate-limited via --if-older-than so a burst of launches sweeps once rather than once each. It never throws and always exits 0: a launch must not be able to fail over housekeeping.
It keys on the temp file's own mtime, not on the session transcript's. The transcript is the tempting signal and the wrong one — transcript mtimes are bulk-touched, and one session was observed with a transcript modified minutes ago whose ctx file had not moved in three days. These files are written only by the render loop, so their mtime means exactly "when this session last drew its status line". Reclaiming one wrongly costs a blank gauge in that pane until its next render, which rewrites the file.
Only those three prefixes are matched, and only with a .json extension. The temp directory is shared with the OS and with the rest of this repo (vkb-server.pid, kgbench-needles-*, the copilot KB stash), so a wildcard sweep there would be a footgun.
Windows also gets a scheduled task. macOS purges /var/folders and Linux ships systemd-tmpfiles for /tmp, so on those the launch-time sweep plus the OS is enough. Windows reclaims %TEMP% never, so install.sh offers an hourly Scheduled Task (\coding\claude-ctx-sweeper, installed by scripts/install-claude-ctx-sweeper-schtasks.sh, removed by uninstall.sh). It is the only system-scope change the sweeper makes on any platform, and declining it loses nothing but the sweeps that would have happened while no agent was running.
Absent, not zero. When a store cannot be read — an agent with no session for this project, a missing database, an unreadable file — the gauge renders nothing at all. A gauge showing 0% and a gauge that cannot see its source must not look the same.
Per-pane, not per-project. CODING_AGENT is part of the render-cache key (cache-<project>-<agent>-w<width>.txt), so a claude pane and an opencode pane on the same project at the same width cannot share a cached line and show each other's reading. When a pane borrows a sibling's cache because it has none of its own, the gauge is blanked first — a width-identical run of spaces — because that value belongs to a different session.
Claude renders it once, not twice
Claude Code's own statusline still writes the bridge file this gauge reads, but its rendering of the meter is stripped by scripts/claude-statusline.cjs, which wraps whatever status-line command is configured. The wrapper approach is deliberate: ~/.claude/hooks/gsd-statusline.js is GSD-managed, so editing it would be undone by /gsd:update, and filtering keeps the bridge file that both GSD's context-monitor hook and this gauge depend on.
It survives reinstalls. In wrapper scope the wrapper is rebuilt per launch. In global scope it is asserted by install.sh and re-asserted on every coding --claude launch, so a GSD reinstall — which rewrites statusLine back to gsd-statusline.js and would bring the second meter back — is repaired by the next launch rather than needing the installer re-run. Assertion recovers the original upstream command instead of wrapping whatever is currently there, so repeating it is a no-op rather than nesting one wrapper inside the next.
Coordinator Health Endpoint
The statusline pulls all health-related signals live from the coordinator. Inspect raw state with:
| Top-level key | Meaning |
|---|---|
container.healthcheck | Docker coding-services container probe result |
services | List of probed services with status, last_seen, latency_ms, probe_error |
databases | LevelDB / Qdrant availability + lock state and graphify graph freshness (sub-checks: leveldb_lock_check, qdrant_availability, graph_integrity — graph_integrity now checks graph.json freshness; probed every tick and mapped to passed/failed) |
network | Network environment: internet_reachable, proxy_running, location (vpn / corporate / home / unknown) |
lsl | Per-session ETM heartbeats (sessionId, projectName, transcriptPath, lastBeat) |
lsl_by_project | 3-state rollup per project: healthy / degraded / stopped |
processes | Stale-PID check (probes for orphaned consolidation heartbeat files) |
files | Disk space, log file size, services-running file freshness |
generated_at | Coordinator's last refresh — drives the [🏥⏰] staleness check |
Phase 33 retired the .logs/statusline-health-status.txt rollup and the .health/verification-status.json file; do not write or read those paths in new code.
Transcript Discovery Auto-Heal
The ETM (enhanced-transcript-monitor.js) detects broken transcript discovery — monitor running but unable to locate its project's transcript JSONL.
- Detection: ETM heartbeat reports
transcriptPath: nullwhile uptime exceeds the discovery grace period - Remediation: ETM exits with non-zero status; the launcher / supervisor restarts it
- Display: Project rolls up as
degraded, surfaces as a bold amber●(ALARM_DOTS.WARN) in the sessions block - Path encoding: Claude Code replaces both
/and_with-(e.g./_work/→--work-)
Clickable Fields
Every field except the clock is a mouse target. The chain is: a range marker in the rendered string → a tmux key binding → a dispatcher script.
Ranges
lib/statusline/clickable.cjs wraps each field in #[range=user|TAG] … #[norange]. tmux reports TAG in #{mouse_status_range} when the span is clicked. Ranges emitted from a #(...) command are honoured — range parsing happens at draw time, on the final expanded string — so the fields work despite the bar being produced by a script.
Tagging happens in one pass at the join, driven by a rule table keyed on each field's leading badge glyph, rather than at the ~30 push sites. The context gauge and the UKB counter are the exceptions: the gauge has no fixed leading glyph, and the UKB counter opens with the same [🧠 as the proxy badge, so both are tagged where they are pushed.
Two constraints that are easy to violate silently:
TAGis capped at 15 bytes. tmux drops a longer range with no error anywhere — the field simply stops responding. Project tags are thereforep:plus a possibly-truncated project name, resolved by prefix against the coordinator's project list.- Tags must be lowercase. The fast path re-applies the underline and repaints lifecycle icons by matching UPPERCASE abbreviations, guarded by lookaround on both sides so that an abbreviation only matches as a whole token — no uppercase letter immediately before or after it. An uppercase letter inside a range tag would sit in those guards' blind spot and could be rewritten as if it were a project bubble.
Range markers cost zero cells: visibleCellWidth() strips #[...] before counting, so the padding maths is unchanged and the right-edge residue bug stays shut.
Binding
Key tables are server-wide — there is no per-session binding — so MouseDown1Status is rebound once during session setup and must preserve the default window behaviour explicitly:
bind -n MouseDown1Status \
  if-shell -F '#{==:#{mouse_status_range},window}' \
    'switch-client -t =' \
    'run-shell -b "<repo>/bin/statusline-click #{mouse_status_range} #{pane_id}"'
set-option does not expand formats in a value, so the tag cannot be stashed in a user option and read back; run-shell does expand them, which is why the tag travels as an argument. The pane id travels with it because display-popup reached from a shell has no client context of its own.
Dispatcher
bin/statusline-click maps a tag to an action. Every action is read-only, because a status line is glanced at far more often than it is deliberately clicked.
| Tag | Action |
|---|---|
health | Dashboard root |
lsl | Dashboard /sessions |
obs | Dashboard /observations |
ukb | Dashboard /performance |
constraints | Constraint dashboard on :3030 |
p:<project> | That project's origin remote, converted to a browsable URL |
net, semantic, ctx | A report in a display-popup |
Two things do not reach the dispatcher and have to be recovered:
- The pane's environment.
run-shellexecutes in the tmux server's environment, soCODING_AGENT/TMUX_SESSION_NAMEare unset however they were exported at launch. They are read back from the session name plus.data/agent-sessions/<session>.json— the same record the context gauge already uses, so this cannot drift from what the bar displays. - Silence.
run-shellrenders any stdout in a view the user must dismiss with ESC, and AppleScript prints its handler's return value. Both stdout and stderr are discarded, or a successful click interrupts the session it was meant to serve.
Tab reuse
Pages are opened through AppleScript rather than open, matching an existing tab by URL prefix — the origin for dashboards, the full URL for a repository. A matching tab is navigated to the requested route (this is what selects the sub-tab); a tab already on the target is focused without reloading, preserving scroll position and filters. Any scripting failure falls through to a plain open, so a refused automation prompt still gets the page.
Only top-level routes are addressable. Nested tabs inside Token Usage and Performance are component state with no URL, so deep-linking them would require adding URL state to the dashboard.
When a click does nothing
| Symptom | Cause |
|---|---|
| No field responds | mouse is off for the session, or the binding was never installed |
| One field stopped responding | Its tag exceeded 15 bytes |
| A click opens a duplicate tab | Chrome automation was refused — the fallback open ran |
| Text appears and needs ESC | Something on the dispatcher path wrote to stdout |
| Fields respond but the bar looks stale | A long-lived session is serving an older cache; ranges arrive with the next full render |
Architecture
6-Layer Health System
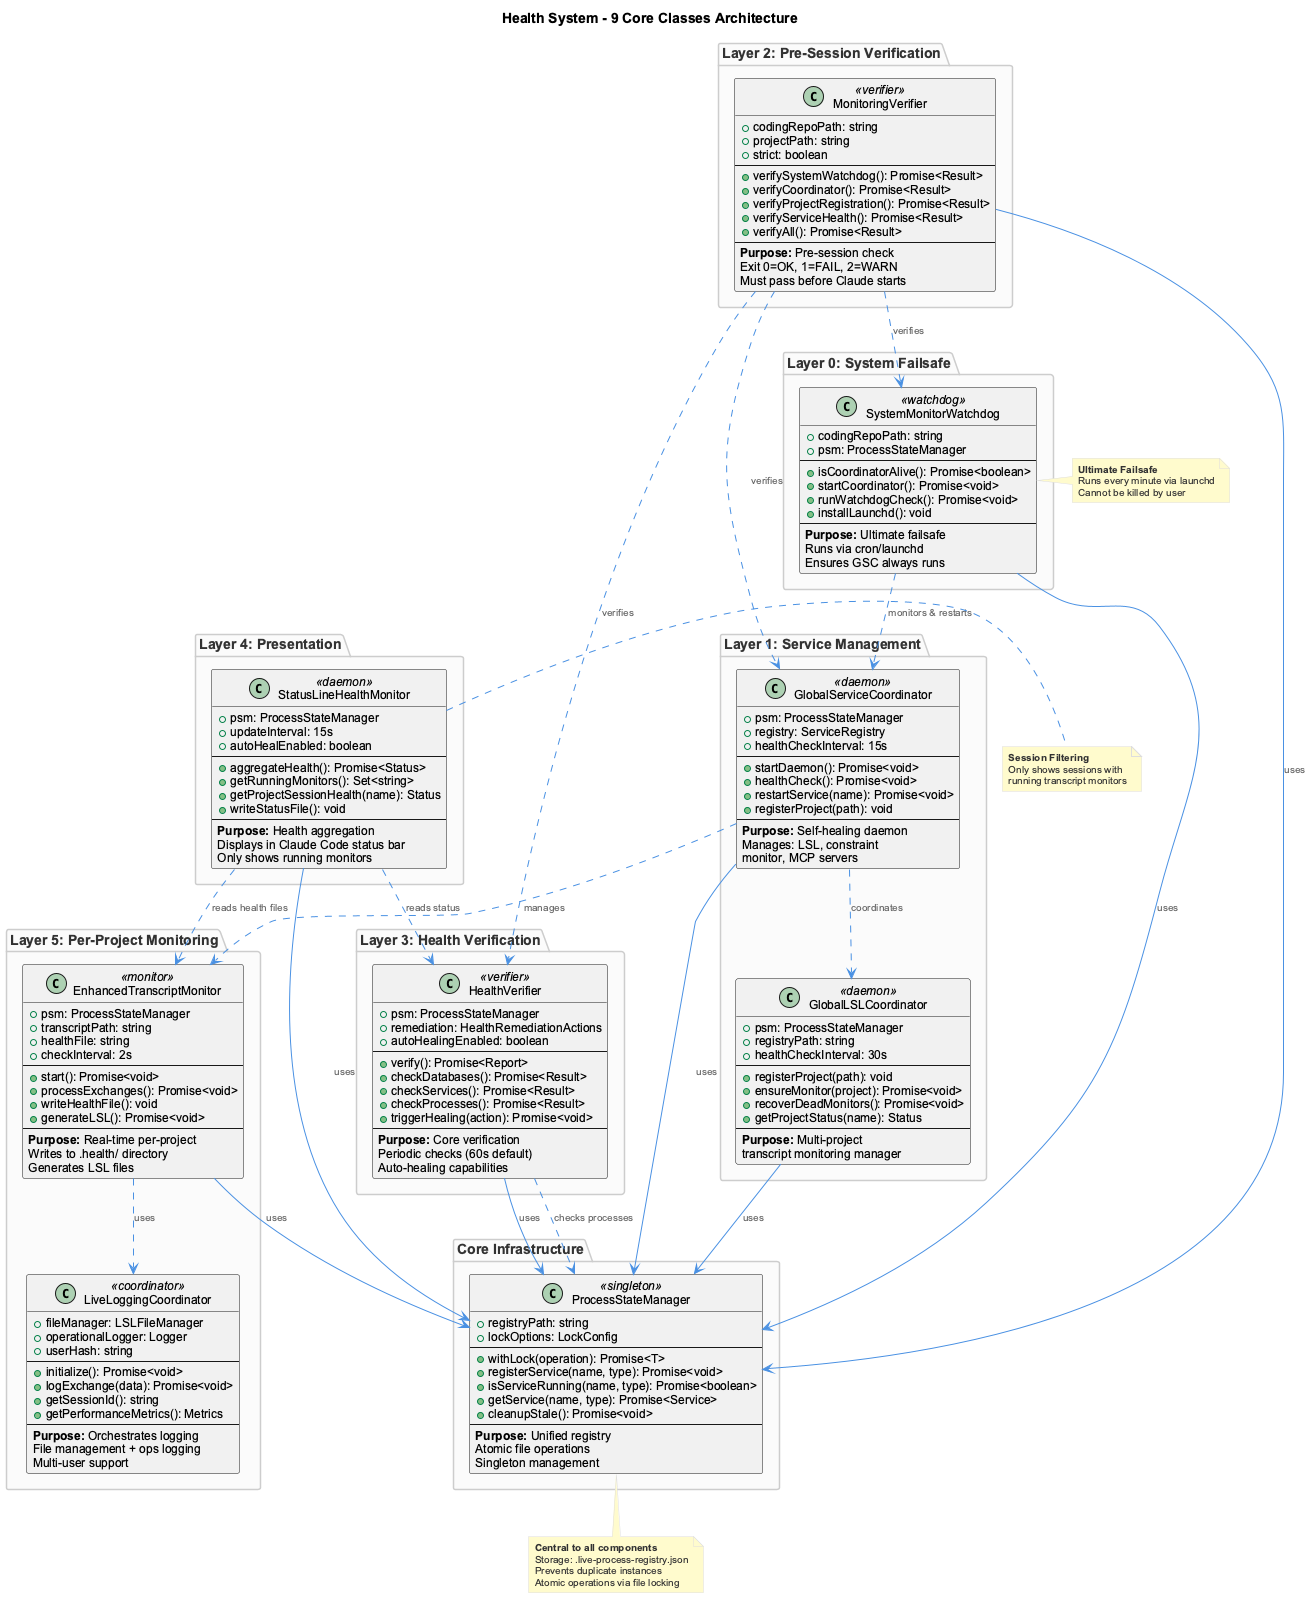
The StatusLineHealthMonitor (Layer 4) aggregates health from all other layers and outputs to the Combined Status Line display.
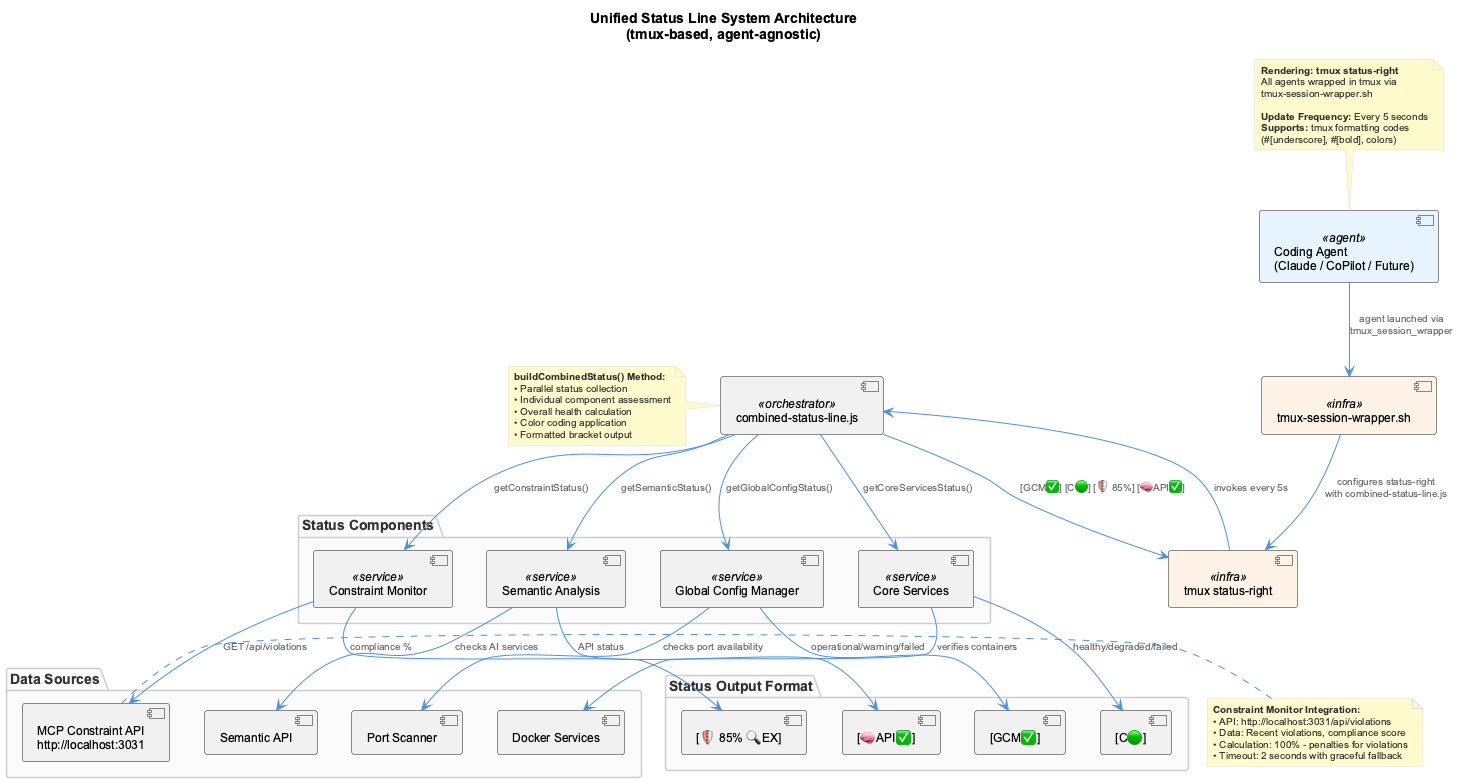
Tmux-Based Rendering
All coding agents are wrapped in tmux sessions via scripts/tmux-session-wrapper.sh. The wrapper:
- Creates a tmux session named
coding-{agent}-{PID} - Configures
status-rightto invokestatus-line-fast.cjs(CJS fast-path cache reader, ~60ms) - Handles nesting guard (reuses existing tmux if already inside one)
- Propagates environment variables (
CODING_REPO,SESSION_ID, etc.) - Enables mouse forwarding for terminal interaction
This replaces the previous approach of using agent-specific status bar APIs (e.g., Claude's statusLine config), providing a unified rendering target that works identically for all agents.
Cache Fast-Path
status-line-fast.cjs is the primary entry point invoked by tmux status-right. It's a CommonJS reader (no ESM module-load penalty under load) that serves the per-pane pre-rendered cache in ~60 ms:
- Cache file:
.logs/combined-status-line-cache-<project>-w<paneWidth>.txt(one per (project, pane-width) tuple — width key prevents cross-pane contamination) - Cache TTL: 60 s in fast.cjs (a separate 30 s TTL inside CSL itself when CSL re-enters via its own cache check)
- Fresh (<60 s): serves immediately, optionally patches lifecycle icons against current transcript mtimes, triggers background refresh if cache >20 s old or transcript activity is newer than cache
- Stale or missing: spawns the full
combined-status-line.jssynchronously - Critical detail: fast.cjs calls
child.stdin.end()immediately after spawning CSL. CSL'sreadStdinInput()(used bygetRedirectStatus()) iterates overprocess.stdinand would otherwise hang the full 8 s SYS:TIMEOUT window waiting for EOF on any pane whoseTRANSCRIPT_SOURCE_PROJECTfalls outside the coding repo. combined-status-line-wrapper.jsis retained as a backup but is no longer the primary path.
Shared coordinator probe
Every render needs seven different slices of state from the health coordinator (knowledge_pipeline, proxy, network, classifier, execution, services rollup + generated_at staleness, lsl_by_project). Each was previously a separate synchronous probe via execSync('curl …'); that many identical localhost HTTP calls per render added up to ~3 s under load and tripped the 8 s SYS:TIMEOUT during tmux refresh bursts.
The renderer now exposes a single getCoordinatorState() method memoized on the CombinedStatusLine instance (one instance per render):
- Uses native
fetchinstead ofexecSync(curl)to skip subprocess-spawn overhead - 1.5 s per-attempt budget with one retry (150 ms gap)
- All seven
getXxxStatus()methods await the shared result; one HTTP call serves the whole render — includinggetClassifierStatus()andgetExecutionStatus(), so the[D:]and[L:]counters cost no extra request - A single transient slow response no longer cascades every coordinator-derived badge (
🏥LSL📚🧠[N:][P:][D:][L:]) to its unreachable state simultaneously
Right-edge stability (cell-width consistency)
The recurring trailing-digit residue at the right edge (07:538, 12:411, 07:158) traces to disagreement between the script's visibleCellWidth(), tmux's wcwidth, and the rendered font glyph. The fix is to only emit codepoints where all three measurements agree:
- Warning and error states are
●(U+25CF), which is unambiguously ONE cell in both tmux and the terminal — so they contribute no width disagreement at all. This supersedes two earlier rounds:⚠️(U+26A0 + U+FE0F, EAW=Ambiguous) was replaced by🟡(U+1F7E1, EAW=Wide) because promoting⚠️to 2 cells via a VS16 lookahead invisibleCellWidth()matched the font glyph but disagreed with tmux's wcwidth (which doesn't honour VS16 for Ambiguous codepoints in non-CJK locales), leaving 1 cell of the previous render exposed on every transition.🟡in turn became a bold●. TheSYS:TIMEOUT/SYS:ERRfallback markers now use the same dot; the VS16 lookahead stays invisibleCellWidth()because emoji remain in the labels (🏥🔒📚🧠📋). - Padding is leading-spaces only to TMUX_PANE_WIDTH (or 200 if unset). Trailing characters get stripped by tmux's
#(shell-cmd)substitution, so any trailing terminator (NBSP, space, etc.) doesn't survive the round-trip. - The earlier NBSP-terminator + 220-codepoint approach has been retired in favour of correct per-codepoint cell counting.
Status Line Update Flow
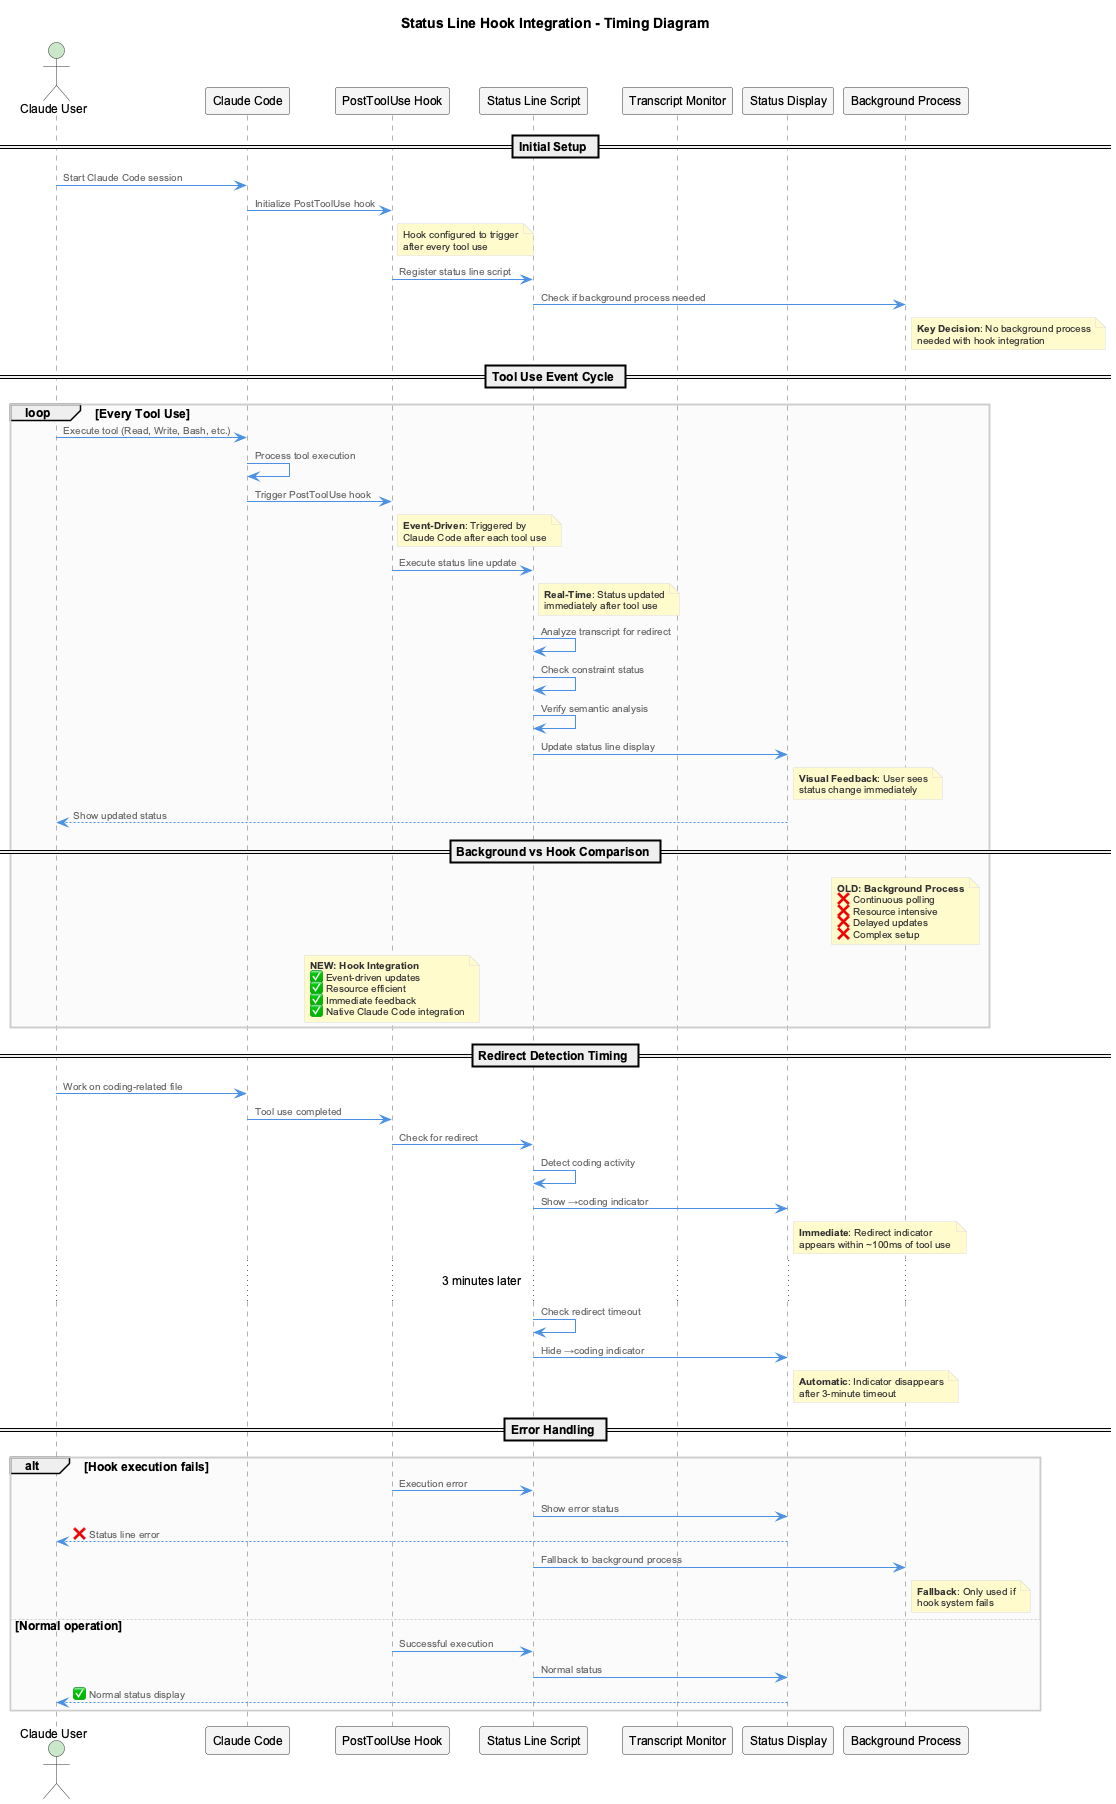
Cache fast-path (normal operation):
- tmux status-interval:
status-rightfires every 5 s →status-line-fast.cjs - Cache check: read
.logs/combined-status-line-cache-<project>-w<paneWidth>.txt - Fresh (<30 s): pass through to tmux (with lifecycle-icon patching against current transcript mtimes), trigger background refresh if cache age >10 s or any tracked transcript is newer than cache
- Stale or missing: spawn
combined-status-line.jssynchronously andchild.stdin.end()immediately so CSL'sreadStdinInput()doesn't hang waiting for EOF
Full refresh:
- Shared coordinator probe: a single memoized
fetch(:3034/health/state)per render (with one retry @ 1.5 s) feeds fivegetXxxStatus()methods — replaces the previous pattern of 5 independentexecSync(curl)calls per render - Per-project activity age: read the newest timestamped record in each
lsl[*].transcriptPath(bounded tail read, NOT the file mtime) → bucket into the ramp (bright → mid → dark → very dark green → grey). A fresh ETM heartbeat (< 5 min) plus genuine content activity promotes a non-Active band to 🟢 (captures long-running agent turns and non-Claude sessions). - Constraint compliance: separate call to constraint-monitor API (port 3031)
- Render: assemble parts, pad to paneWidth cells via
leftPadToStableCellWidth()using VS16-awarevisibleCellWidth()— see Right-edge stability above - Cache write: save to
.logs/combined-status-line-cache-<project>-w<paneWidth>.txt - Failure logging: any 8 s SYS:TIMEOUT or fast.cjs spawn failure appends a JSON record to
.logs/csl-failures.jsonlwith per-step timings so future Claude sessions can see which sub-step blocked
Caching
| Data | Cache Duration |
|---|---|
| Pre-rendered status (fast-path) | 60s TTL, 20s background refresh |
| Health status | 5 minutes |
| Constraint compliance | 1 minute |
| LSL status | Read on every update |
Spawn Storm Prevention
The supervision architecture includes guards to prevent runaway process spawning:
| Guard | Component | Mechanism |
|---|---|---|
| GPS heartbeat gate | CombinedStatusLine | ensure* functions skip when GPS heartbeat <60s old |
| OS-level dup check | GlobalServiceCoordinator | findRunningProcessesByScript() before every spawn |
| Orphan kill | GlobalServiceCoordinator | Kills spawned process if post-spawn health check fails |
| Cooldown | GPS (5min), Coordinator (2min) | Per-service cooldown between restart attempts |
| Rate limiting | GPS (10/hr), Coordinator (6/hr) | Maximum restarts per service per hour |
| OS-level re-registration | GlobalProcessSupervisor | Re-registers alive services instead of respawning |
Service Lifecycle States
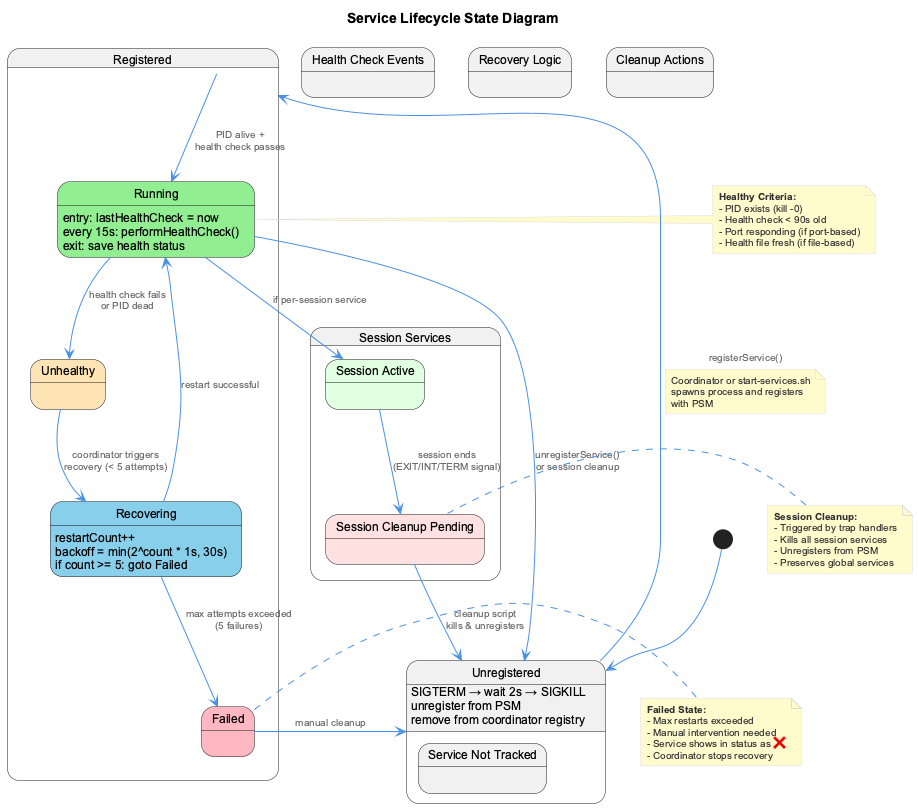
State Transitions
Health States (for [🏥...] indicator): - Coordinator reachable + 0 critical issues → Healthy (green ●, STATE_DOTS.OK) - Coordinator reachable + ≥1 service degraded / GCM warning → Warning (amber ●, STATE_DOTS.WARN) - Coordinator reachable + critical failure (downed service, unhealthy DB, container probe fail) → Critical (red ●, STATE_DOTS.CRIT) - Coordinator generated_at >3 min old → Stale (⏰) - Coordinator unreachable → Offline (grey ●, colour238)
Session States (graduated cooling scheme): - Driven by the newest timestamped record in transcriptPath (not its mtime), bucketed: colour41 (<5 m) → colour34 (<30 m) → colour28 (<6 h) → colour22 (<24 h) → colour238 (≥24 h) - Heartbeat-promotion override: if lsl[*].lastBeat is < 5 min, any non-🟢 band is overridden to 🟢. Captures long-running agent turns (one prompt that takes >5 min) and non-Claude sessions whose transcriptPath is not a real file - Sessions only removed when the project's ETM stops heartbeating, never hidden while alive
Session Discovery
Discovery Methods
- Running Monitor Detection: Checks
ps auxfor runningenhanced-transcript-monitor.jsprocesses - Agent Process Detection: Scans for
claude,copilot, andopencodeprocesses viaps -eo pid,command resolves project from working directory vialsof - Registry-based Discovery: Uses Global LSL Registry for registered sessions
- Dynamic Discovery: Scans Claude transcript directories for unregistered sessions
- Health File Validation: Uses centralized health files from
.health/directory
Key Behavior
- Sessions with a running agent process use age capped at monitor uptime (graduated cooling from session start)
- Sessions with running transcript monitors but no active agent use transcript-based activity icons
- Sessions are only removed when the agent process has exited — never hidden
- The Global Process Supervisor automatically restarts dead monitors within 30 seconds
Multi-Agent Support
| Agent | Binary | Detection Method |
|---|---|---|
| Claude | claude | Exact match on ps -eo comm |
| Copilot | copilot | Path-ending match /copilot$ |
| OpenCode | opencode | Path-ending match /opencode$ |
New agents can be added to the detection loop in statusline-health-monitor.js → getRunningAgentSessions().
Smart Abbreviation Engine
Project names are automatically abbreviated:
| Project Name | Abbreviation |
|---|---|
| coding | C |
| curriculum-alignment | CA |
| nano-degree | ND |
| project-management | PM |
| user-interface | UI |
Algorithm Handles: - Single words: First letter (coding → C) - Hyphenated words: First letter of each part (curriculum-alignment → CA) - Camel case: Capital letters (projectManagement → PM)
Configuration
Status Line Configuration
The renderer reads a small set of environment variables and the coordinator endpoint; legacy config/status-line-config.json health_source / lsl_registry keys are no longer consulted.
| Env var | Purpose | Default |
|---|---|---|
HEALTH_COORDINATOR_URL | Coordinator base URL | http://localhost:3034 |
TMUX_PANE_PATH | Per-pane current path (set by tmux) | — |
TRANSCRIPT_SOURCE_PROJECT | Override project path resolution | — |
CODING_REPO | Repo root for cache file location | script's __dirname/.. |
CLAUDE_SESSION_ID / SESSION_ID | Session identifier for per-pane lookups | — |
| Tunable | Where | Default |
|---|---|---|
| Cache TTL (fast-path) | status-line-fast.cjs CACHE_TTL_MS | 30 s |
| Background refresh threshold | status-line-fast.cjs BG_REFRESH_THRESHOLD_MS | 10 s |
| Tmux refresh interval | ~/.tmux.conf status-interval | 5 s |
status-right-length | ~/.tmux.conf | 200 |
codepoint-widths | ~/.tmux.conf | see Tmux codepoint-widths below |
Tmux codepoint-widths
Every Unicode-10+ emoji the statusline can emit needs an explicit width override in tmux because tmux's bundled wcwidth table predates Unicode 10 and silently treats new codepoints as width=1, even when they are East-Asian-Width Wide. Each disagreement leaks one cell of the previous render through to the right edge, producing the recurring trailing-digit residue (07:538, 08:054, 16:3175). Add this to ~/.tmux.conf:
set -g codepoint-widths "U+26A0=2,U+FE0F=0,U+1F7E0=2,U+1F7E1=2,U+1F7E2=2,U+1F7E4=2,U+1F9E0=2,U+1F9EE=2,U+1F976=2"
After editing, run tmux source-file ~/.tmux.conf. New tmux sessions inherit it immediately. The full mapping:
| Codepoint | Glyph | Block | Reason for override |
|---|---|---|---|
U+26A0=2 | ⚠ | Misc Symbols (Unicode 4) | EAW=Ambiguous — tmux counts 1, terminals render 2 |
U+FE0F=0 | (VS16) | Variation Selectors | Variation selector; tmux counts 1, renderer treats as part of the previous codepoint |
U+1F7E0=2 | 🟠 | Geometric Shapes Ext (Unicode 12) | Predates tmux's wcwidth table — no longer emitted |
U+1F7E1=2 | 🟡 | Geometric Shapes Ext (Unicode 12) | Predates tmux's wcwidth table — no longer rendered |
U+1F7E2=2 | 🟢 | Geometric Shapes Ext (Unicode 12) | Predates tmux's wcwidth table — no longer emitted |
U+1F7E4=2 | 🟤 | Geometric Shapes Ext (Unicode 12) | Predates tmux's wcwidth table — no longer emitted |
U+1F9E0=2 | 🧠 | Supplemental Symbols (Unicode 10) | Predates tmux's wcwidth table |
U+1F9EE=2 | 🧮 | Supplemental Symbols (Unicode 11) | Predates tmux's wcwidth table — no longer emitted |
U+1F976=2 | 🥶 | Supplemental Symbols (Unicode 11) | Predates tmux's wcwidth table — no longer emitted |
Rows marked no longer emitted are harmless, keep them
The lifecycle ramp and the alarm states are now ● (U+25CF), so the coloured-circle rows and 🥶 describe glyphs the statusline no longer produces. 🟡 survives only in an internal sentinel and in the fast path's legacy-cache regex — neither reaches the status bar.
They are left in place deliberately: an override for a codepoint that never appears costs nothing, whereas removing one and later reintroducing the glyph brings the residue bug back silently. Verify the live set before pruning — the emoji still genuinely rendered are the badge labels (🏥 🔒 📚 🧠 📋) plus the non-severity pictograms (⏰ ⏳ 🔇 ❓ 🚫):
node --input-type=module -e "
import fs from 'node:fs';
const code = fs.readFileSync('scripts/combined-status-line.js','utf8').split('\n')
  .map(l => l.replace(/\/\/.*\$/, ''))
  .filter(l => { const t = l.trim(); return t && !t.startsWith('*') && !t.startsWith('/*'); })
  .filter(l => !l.includes('lines.push'));   // verbose tooltip is plain text, not the bar
const seen = new Set();
for (const l of code) for (const ch of [...l]) {
  const cp = ch.codePointAt(0);
  if (cp > 0x2190) seen.add(ch + '  U+' + cp.toString(16).toUpperCase());
}
console.log([...seen].sort().join('\n'));
"
Why fix in tmux, not the script. Several earlier attempts modified visibleCellWidth() in scripts/combined-status-line.js to compensate for the disagreement and introduced new disagreements each time. The script's count is correct for the codepoints it currently handles — the issue is downstream in tmux's wcwidth table, fixable only via codepoint-widths. Do not touch the script's width math. If a new Ambiguous emoji enters the statusline repertoire and residue returns, probe its tmux-vs-terminal width with the snippet in Troubleshooting → Right-edge residue and append it to the override.
Retired lifecycle emojis. 🌲 (Unicode 6, OK), 🫒 (U+1FAD2, Unicode 13), and 🪨 (U+1FAA8, Unicode 13) used to sit in the cooling/fading/dormant tiers. The Unicode-13 codepoints were too new for tmux's wcwidth table to know about even with codepoint-widths overrides (tmux 3.4 silently ignores codepoints it can't normalize). They were first replaced by the coloured circles (🟠/🟤) on stable Geometric-Shapes-Ext blocks, and those in turn by the tinted ● ramp described above — which sidesteps the whole class of problem, since U+25CF needs no codepoint-widths entry to begin with.
Terminal Title Broadcasting
How It Works
Every 15 seconds, the statusline-health-monitor broadcasts status to all Claude session terminals via ANSI escape codes:
Terminal Compatibility
| Terminal | Status | Notes |
|---|---|---|
| iTerm2 | ✅ Works | Full OSC 0 support |
| Terminal.app | ✅ Works | Native macOS terminal |
| VS Code Terminal | ❌ Limited | Does not process OSC 0 from external TTY writes |
| tmux | ✅ Works | Primary rendering target — all agents run inside tmux |
Troubleshooting
Trailing junk after the clock (15:322, 07:407)?
A leftover cell from the previous, wider frame. tmux does not clear status-right cells when the content shrinks, so the renderer left-pads every line to a constant cell count. Residue means that count stopped being constant.
It is almost never an emoji-width problem. That is the intuitive theory and it has been wrong every time it was tested — tmux's own per-codepoint width agrees with visibleCellWidth() for every glyph in use. Measure before assuming:
# tmux's OWN width for a glyph — prompt-free pane, read cursor_x
tmux new-session -d -s wp -x 80 -y 5 "printf '%s' '●'; sleep 20"; sleep 0.6
tmux display-message -p -t wp '#{cursor_x}'    # 1 for ●, 2 for emoji
The real cause is a width the renderer could not reserve correctly. Check the invariant directly — for each live cache, pane_width − rendered_width must equal the width of status-left:
ls -t .logs/combined-status-line-cache-*-w*.txt | head -3
# reserve == 0 means status-right was padded to the FULL pane width,
# so status-left + status-right overruns the row.
If the reserve is 0, the renderer never received TMUX_SESSION_NAME (it derives the reserve from the session name's length). Read the environment of a live process, not the config — sessions override the global status-right with their own command, so ~/.tmux.conf can look correct while the running command is missing the variable:
PID=$(/bin/ps ax -o pid,command | grep -E "combined-status-line" | grep -v grep | awk 'NR==1{print $1}')
/bin/ps -E -p "$PID" -o command= | tr ' ' '\n' | grep '^TMUX_'
Sessions get the correct command from scripts/tmux-session-wrapper.sh. Already-running sessions keep whatever they were created with, so after changing it either restart them or re-apply with tmux set-option -t <session> status-right ….
Narrow panes truncate rather than overflow
leftPadToStableCellWidth() emits exactly pane_width − status-left cells at every size. When the content does not fit, it is truncated from the left — status-right is right-anchored, so the clock and LSL tranche survive and the leading badges are dropped, marked with a leading ….
A payload rendering at its natural width instead of the target is the bug, not the truncation: a content-dependent width is what leaves residue. If you see badges missing behind a …, the pane is simply too narrow for the full line — widen it or shorten the session name (the reserve is len(session_name) + 3).
Status bar completely blank?
# Check cache file freshness
ls -la .logs/combined-status-line-cache.txt

# Test fast-path directly (should complete in <100ms)
time node scripts/status-line-fast.cjs

# Force full refresh
node scripts/combined-status-line.js

# Check for process spawn storm (should be <80 Node processes)
ps aux | grep node | wc -l

# If >100 processes, kill the coordinator and let GPS restart cleanly
ps aux | grep global-service-coordinator | grep -v grep
Status line not updating?
# Check the coordinator (Phase 33 SoT)
curl -fs http://localhost:3034/health/state | jq '.generated_at, .lsl_by_project'

# Trigger an explicit one-shot verifier run (writes a verify_run signal to coordinator)
node scripts/health-verifier.js verify

# Force a fresh render (clears the per-project cache)
rm -f .logs/combined-status-line-cache-*.txt
node scripts/combined-status-line.js
Note: there is no longer a host-side health-verifier daemon. verify, status, and report are the only supported subcommands; start was removed in plan 33-04 when the coordinator at :3034 took over lifecycle. If you still see a monitoring:health-verifier STOPPED line on the dashboard, your supervisord config is pre-Phase-33 — the program block was retired alongside browser-access.
Wrong project showing as active?
# Check LSL registry
cat .lsl/global-registry.json | jq '.'

# Verify activity timestamps
cat .lsl/global-registry.json | jq '.sessions[] | {project, last_activity}'
Session not showing that should be?
# Check if agent process is detected (claude, copilot, opencode)
ps -eo pid,comm | awk '/claude$|copilot$|opencode$/ {print}'

# Check if the agent's cwd resolves to the right project
lsof -p <PID> 2>/dev/null | grep cwd

# Check if transcript monitor is running for that project
ps aux | grep enhanced-transcript-monitor | grep PROJECT_NAME

# Sessions show if: agent process running OR transcript monitor running
Right edge shows residual chars (e.g. 12:411, 13:0656)?
The persistent fix is set -g codepoint-widths "..." in ~/.tmux.conf — see Tmux codepoint-widths for the full mapping. Verify yours matches:
# Verify the override is loaded (should print 9 codepoints, all =2 or =0)
tmux show-options -g codepoint-widths

# If it's missing entirely, add the line from the docs and reload:
tmux source-file ~/.tmux.conf
If the override is present and residue still appears, a new emoji has entered the statusline repertoire whose width tmux doesn't know about. Probe its tmux-vs-terminal width with the snippet below — if truncate(1) returns the emoji itself (rather than empty), tmux is counting 1 cell and needs a U+XXXX=2 entry appended:
emoji_vs=$(node -e "process.stdout.write(String.fromCodePoint(0xXXXX) + String.fromCodePoint(0xFE0F) + 'XYZ')")
tmux set-environment -g TT "$emoji_vs"
for n in 1 2 3 4; do
  out=$(tmux display-message -p "#{=$n:TT}")
  printf "truncate(%d) = %q\n" "$n" "$out"
done
Do not modify scripts/combined-status-line.js's visibleCellWidth() to compensate — multiple past attempts (2026-05-09, 10, 12) introduced new disagreements. The script's count is correct for its repertoire; the fix is always in tmux config.
You can also verify the legacy script-side mitigations are still in place (they're defense-in-depth, not load-bearing now):
# Wrapper preserves trailing whitespace (must NOT do .trim())
grep -n 'rstrip\|trim()' scripts/combined-status-line-wrapper.js

# Producer pads to TMUX_PANE_WIDTH (or 200) via leftPadToStableCellWidth
grep -n 'leftPadToStableCellWidth' scripts/combined-status-line.js

# Cache file isn't truncated mid-codepoint
xxd .logs/combined-status-line-cache-coding-w*.txt | tail -1
Key Files
Core System:
| File | Purpose |
|---|---|
scripts/tmux-session-wrapper.sh | Wraps all agents in a tmux session with unified status bar |
scripts/combined-status-line-wrapper.js | Cache fast-path reader invoked by tmux status-right |
scripts/combined-status-line.js | Full status line renderer; writes per-project cache |
scripts/health-coordinator.js | Phase 33 SoT — collects signals at :3034, exposes /health/state |
scripts/health-verifier.js | Reporter-mode CLI: verify, status, report (no daemon) |
scripts/enhanced-transcript-monitor.js | Per-project ETM; POSTs lsl_heartbeat signals to coordinator |
.logs/combined-status-line-cache-<project>-w<paneWidth>.txt | Per-(pane, width) pre-rendered status cache |
Retired (do not write/read):
| File | Replaced by |
|---|---|
.health/verification-status.json | Coordinator /health/state |
.logs/statusline-health-status.txt | Coordinator /health/state (sessions block) |
.lsl/global-registry.json | Coordinator lsl map |
[program:health-verifier] supervisord block | Removed in 33-04 — start subcommand no longer exists |
[program:browser-access] supervisord block | Removed; replaced by Playwright-via-CLI (/gsd-browser) |
Configuration:
| File | Purpose |
|---|---|
~/.tmux.conf | status-right-length, status-interval, status-right invocation |
config/live-logging-config.json | Provider config |