Health Dashboard
Where to look when something is unhealthy, and the supervision design that decides what "unhealthy" even means.
Open it
localhost:3032. The same state is available raw:
What the dashboard shows
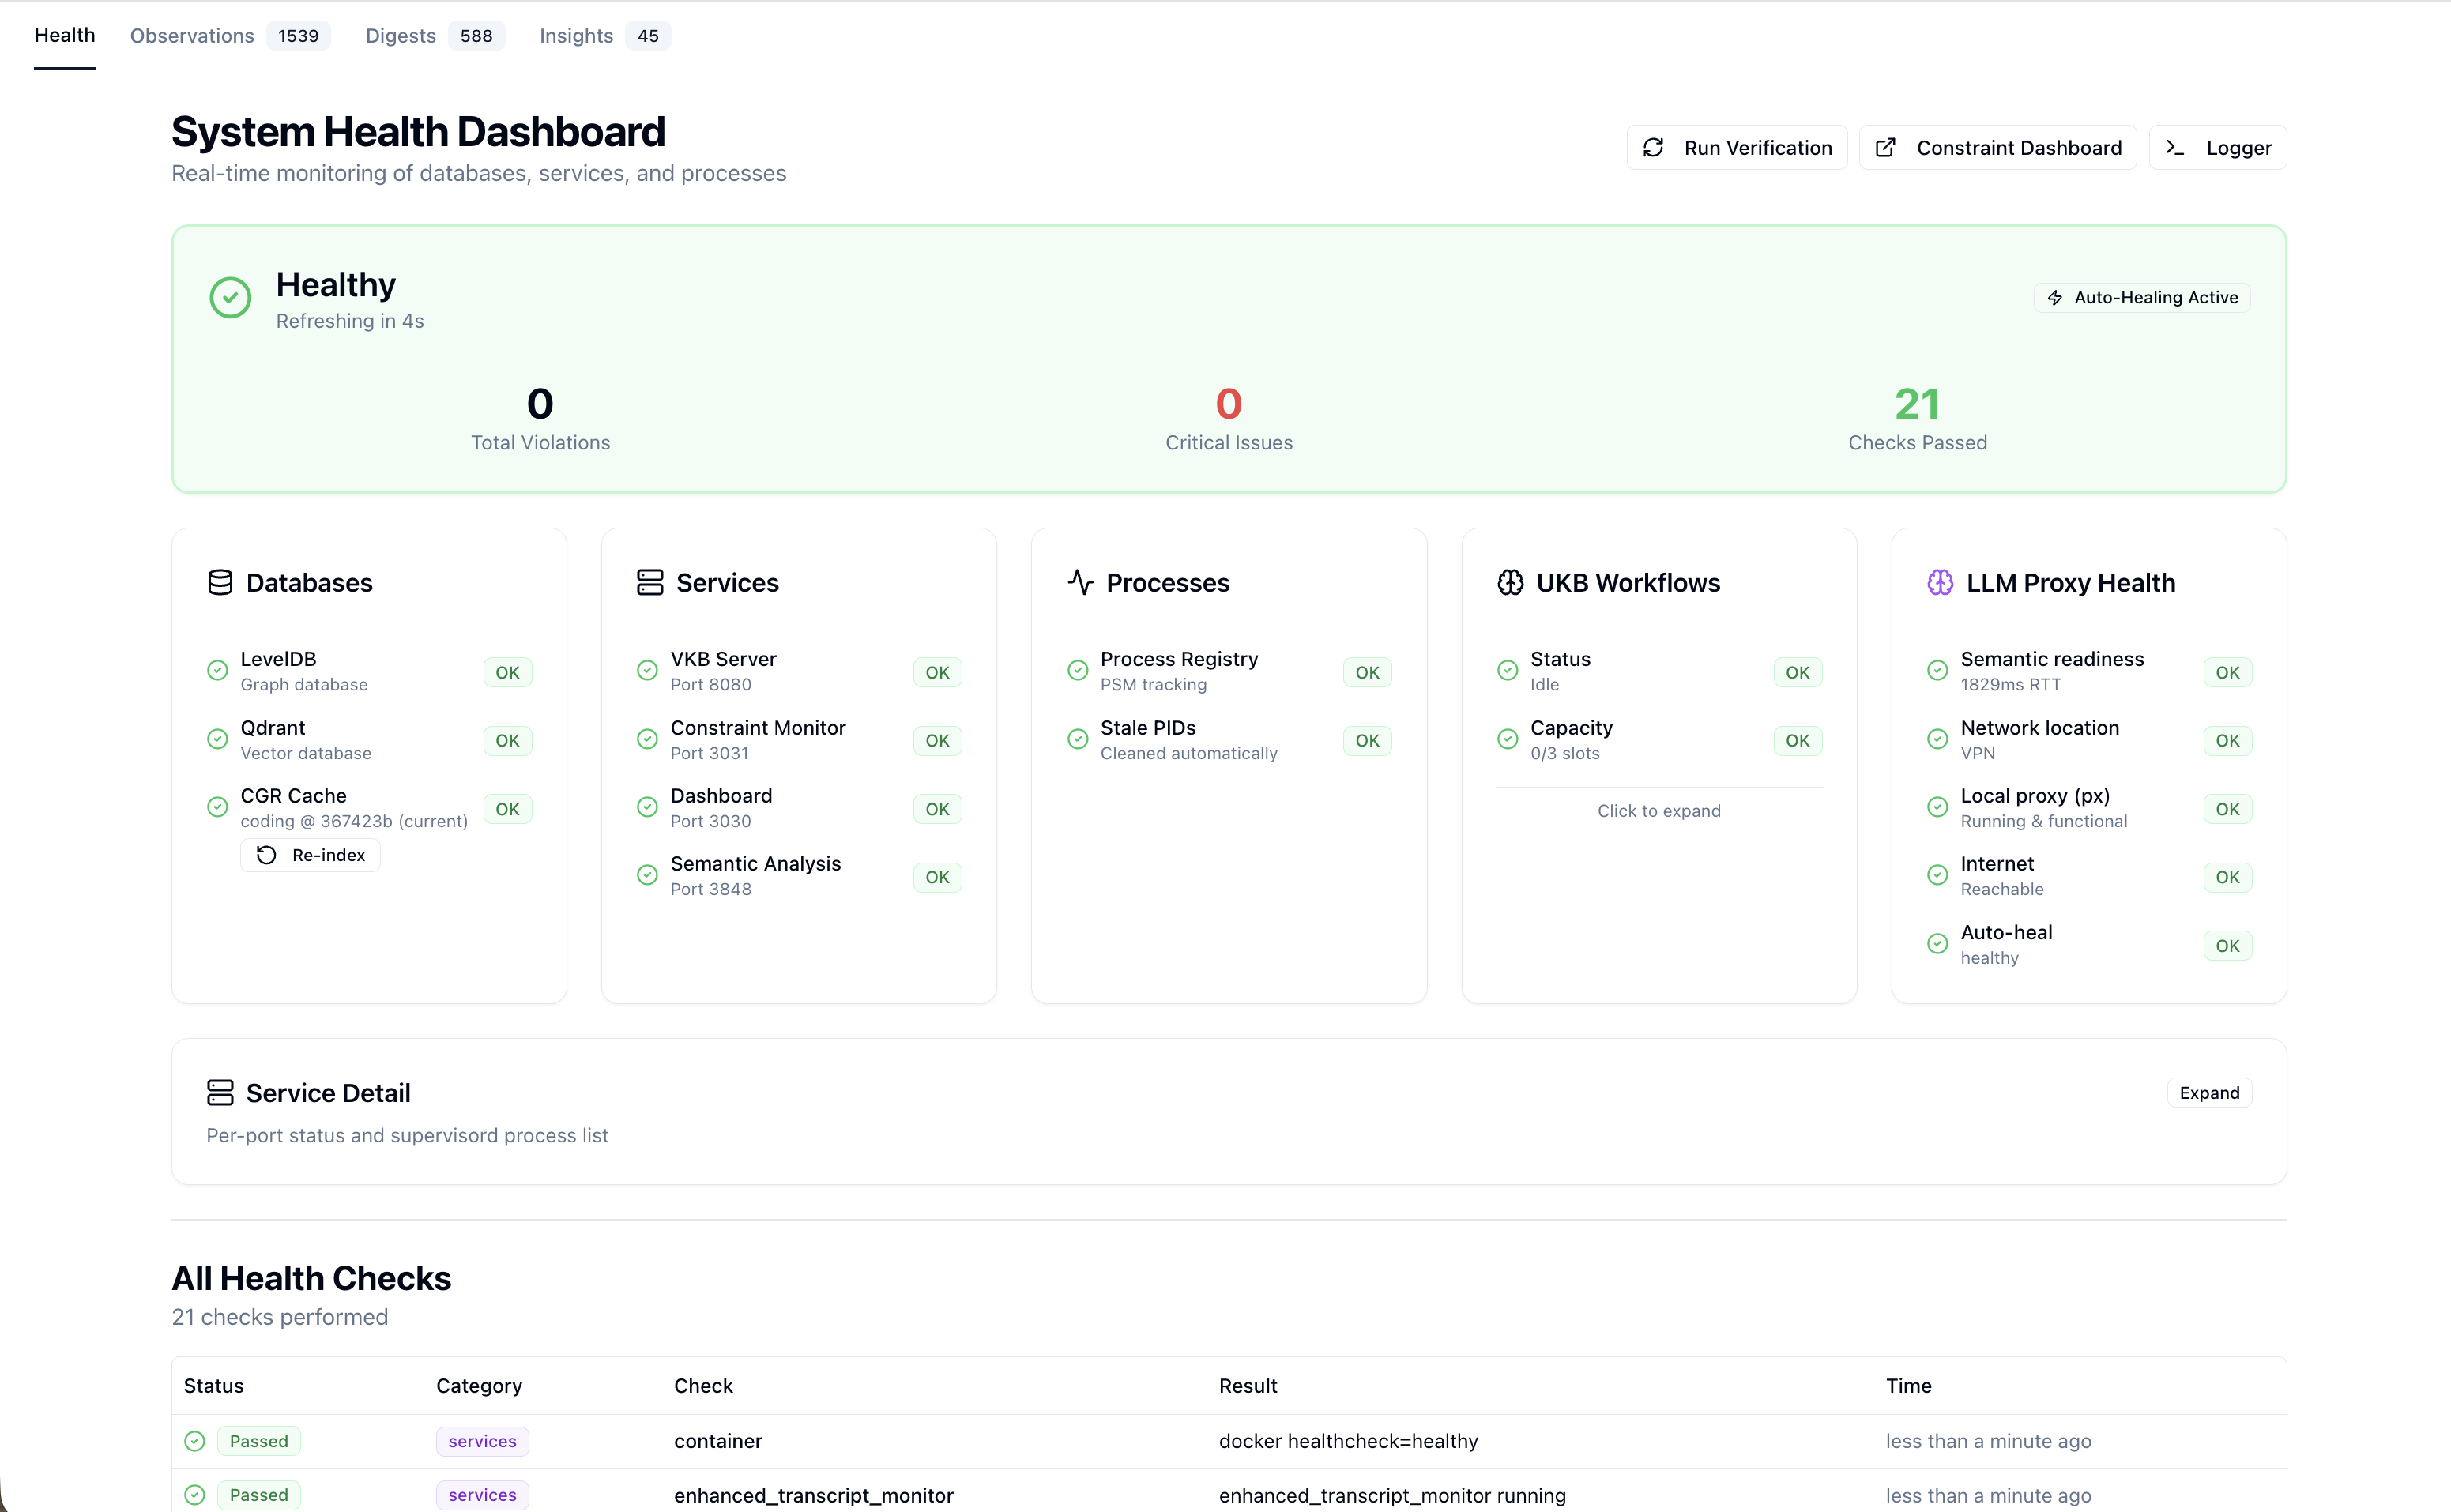
Service health and container state, per-project session activity, the knowledge-workflow monitor with its debug controls, database health, and performance metrics.
The one idea behind the design
Every layer assumes the one below it might be lying. A process that exists is not a process that works, so liveness is judged by heartbeats rather than by the process being present. That is what catches a wedged service — alive, answering ps, doing nothing.
Diagnosing in order
- Is the coordinator reachable? A grey badge means the reader has nothing to read.
- Is the state fresh? Older than 180s means the writer stopped, not the services.
- Then, and only then, look at what the state says about individual services.
Skipping to step 3 is how a coordinator problem gets misdiagnosed as five service problems.
Watching a knowledge run
The workflow monitor shows the extraction pass live, with debug controls for single-stepping against a mocked LLM — which is the cheap way to understand the workflow.
The supervision model
Health is layered, and the layers escalate. At the base a process registry tracks every system process with atomic, lock-protected writes. Above it a watchdog runs on a system timer as the ultimate failsafe — its only job is ensuring the coordinator is alive, and it cannot be killed by the processes it supervises. Above that, coordinators perform health checks on fifteen-second intervals with exponential-backoff recovery.
The reason for the layering is the failure mode that a single monitor cannot catch: a monitor that has itself stopped reports nothing, which is indistinguishable from everything being fine. Each layer exists to notice that the one below it went quiet.
What the dashboard surfaces
Service and container health, from the coordinator's own probes. Sessions, per project, showing which agents are active and what they are logging. The workflow monitor, which renders the knowledge extraction pass while it runs, including the debug controls that single-step it against a mocked LLM. Database health, broken into individual checks — LevelDB lock state, vector-store availability, graph integrity — rather than one opaque verdict. Performance metrics over time.
Auto-recovery
Failures are handled two ways. Proactively, a coordinator that sees a service down restarts it without anyone watching. Reactively, the dashboard offers a restart control for when you have decided something needs bouncing. Most failures resolve by the first path; the history view shows what was restarted and when, which is how you find a service that is quietly flapping rather than cleanly failing.
Reading it when things are wrong
The order matters, because the failure modes nest:
| Observation | What it actually means |
|---|---|
| Health badge grey | The coordinator is unreachable — nothing else on the page is trustworthy |
| State older than 180s | The writer stopped; the services may be perfectly fine |
| One service unhealthy | Genuinely that service |
| A project absent from sessions | No session monitor for it — not an unhealthy one |
| Everything green, nothing happening | Look for a wedged process; sample it rather than checking it exists |
That last row is the one worth internalising. A wedged process does not die: it holds its event loop, answers ps, keeps its ports open, and stops producing work. Only the heartbeat notices, which is precisely why liveness here is defined as "recently did something" rather than "is running".
Storage
Health state is written by exactly one process and read by all the consumers — the dashboard, the status line and the prompt hooks. When two of those disagree, that is not two opinions about health; it means one of them is reading a stale copy, and that is the bug to chase.
Comprehensive health tracking and status reporting across all Claude Code sessions.
Phase 33 architecture (current)
The architecture below describes the historical 6-layer multi-supervisor design. Phase 33 (plan 33-04) consolidated the layered system into a single health coordinator at :3034 that owns the live state, with reporters (ETM, health-verifier verify CLI) writing signals and consumers (statusline, dashboard, prompt hook) reading state. See Health Monitoring for the current model. The retired daemons (HealthVerifier daemon mode, StatusLineHealthMonitor, GlobalProcessSupervisor, GlobalLSLCoordinator) and their on-disk artifacts (.health/verification-status.json, .logs/statusline-health-status.txt, .lsl/global-registry.json) are no longer in use.
6-Layer Protection Architecture (historical)
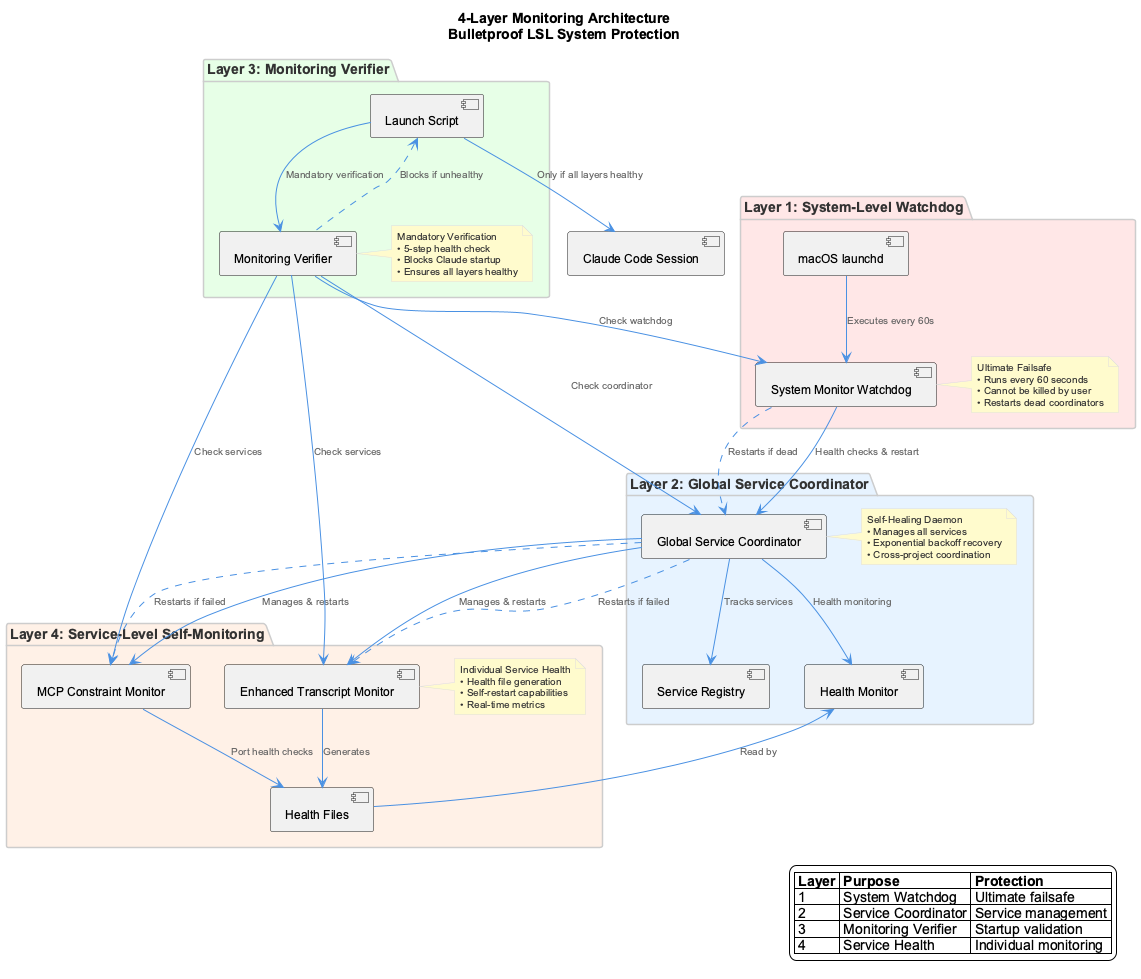
The system formerly implemented a 6-layer monitoring protection with 9 core classes:
| Layer | Class | Purpose | Status |
|---|---|---|---|
| Layer 0 | SystemMonitorWatchdog | Ultimate failsafe - runs via cron/launchd, ensures GSC always runs | retired |
| Layer 1 | GlobalServiceCoordinator | Self-healing daemon managing all critical services | retired (supervisord owns lifecycle) |
| Layer 1 | GlobalLSLCoordinator | Multi-project transcript monitoring manager | retired (launcher spawns ETMs directly) |
| Layer 2 | MonitoringVerifier | Pre-session verification (exit 0=OK, 1=FAIL, 2=WARN) | retired |
| Layer 3 | HealthVerifier | Core verification engine with auto-healing | reduced to one-shot CLI (verify / status / report) |
| Layer 4 | StatusLineHealthMonitor | Health aggregation for Claude Code status bar | retired (statusline reads coordinator directly) |
| Layer 5 | EnhancedTranscriptMonitor | Real-time per-project transcript monitoring | active (POSTs lsl_heartbeat to coordinator) |
| Layer 5 | LiveLoggingCoordinator | Logging orchestration with multi-user support | retired |
| Core | ProcessStateManager | Unified registry with atomic file locking | retired |
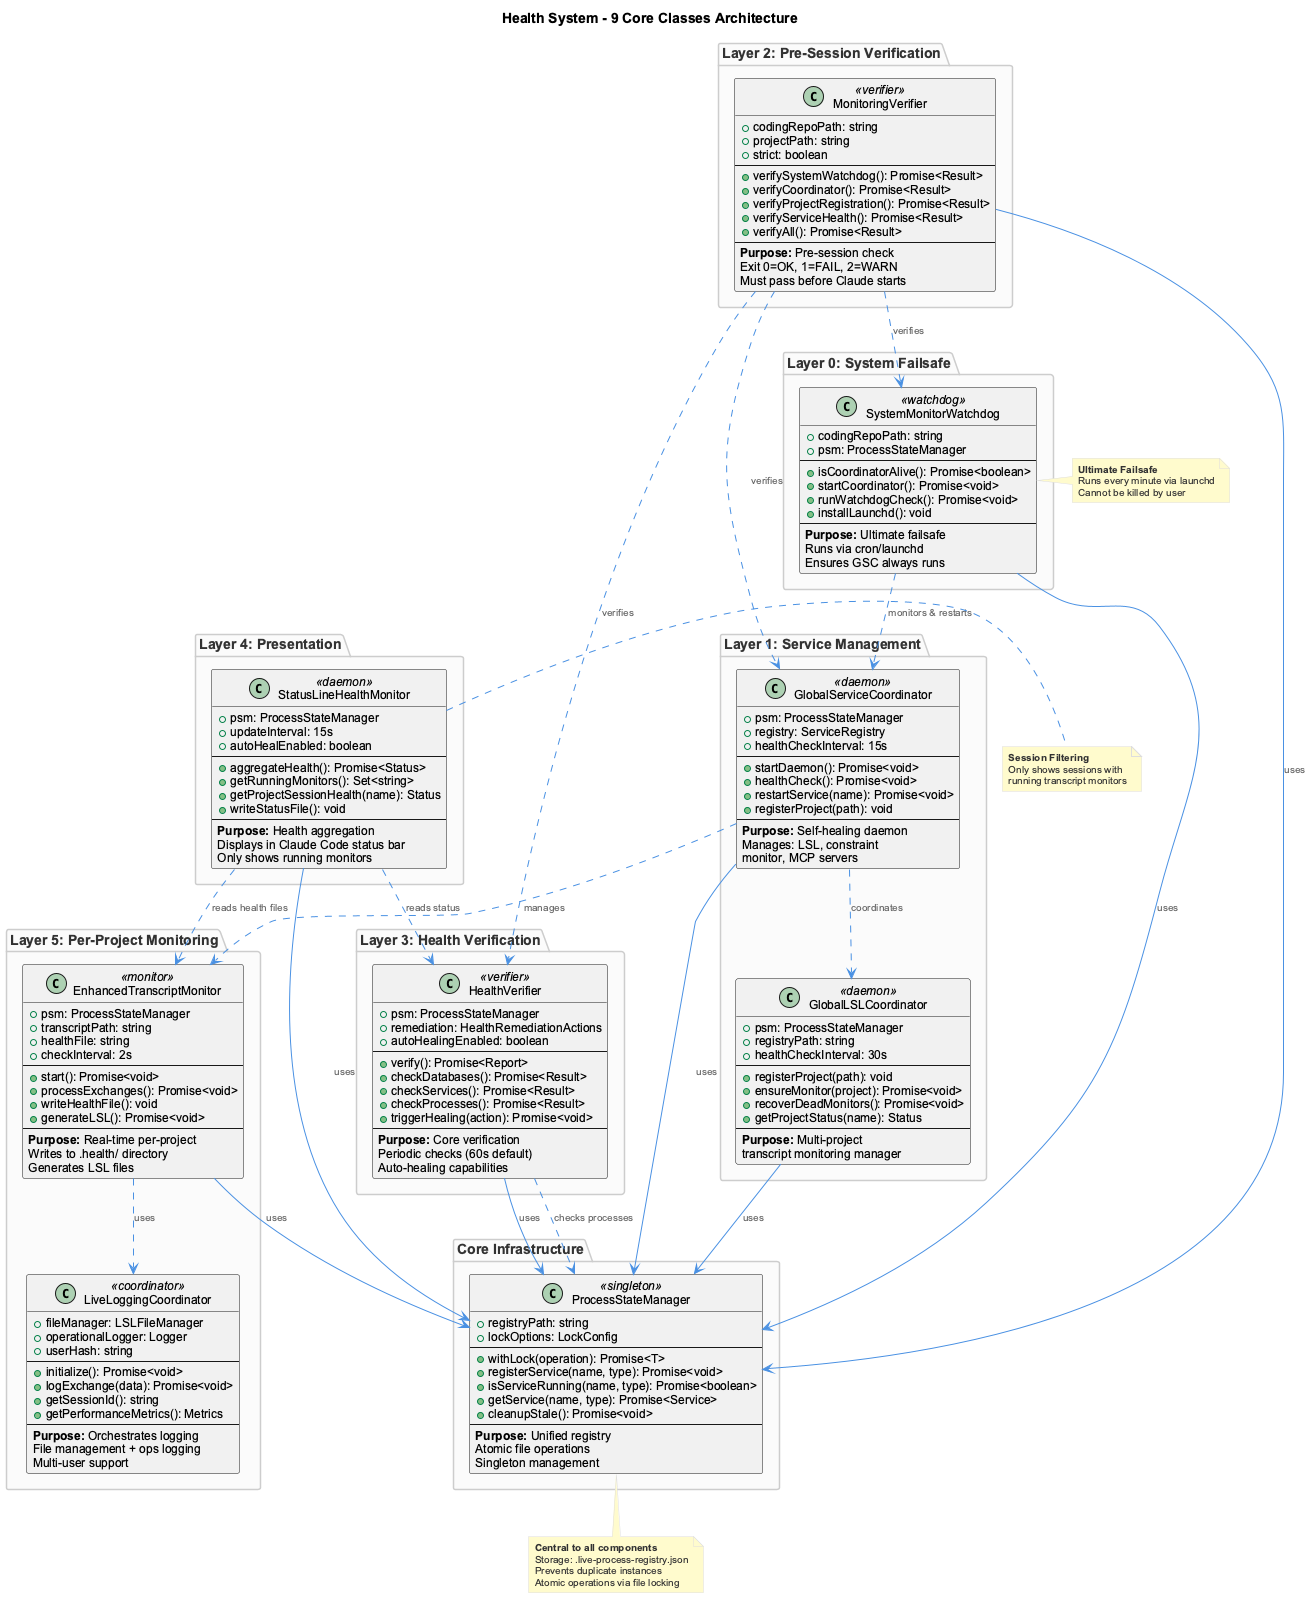
9-Class System Design
Core Infrastructure: ProcessStateManager
Location: scripts/process-state-manager.js
- Unified registry for all system processes (
.live-process-registry.json) - Atomic file operations via proper-lockfile
- Session-aware process tracking (global, per-project, per-session)
- Used by ALL other health system classes
Layer 0: SystemMonitorWatchdog
Location: scripts/system-monitor-watchdog.js
- Ultimate failsafe "monitor monitoring the monitor"
- Runs via system cron/launchd every minute
- Ensures GlobalServiceCoordinator is always running
- Cannot be killed by user processes
Layer 1: GlobalServiceCoordinator
Location: scripts/global-service-coordinator.js
- Self-healing service management daemon
- 15-second health checks with exponential backoff recovery
- Manages: constraint API, constraint dashboard, MCP servers
- Service registry maintenance
Layer 1: GlobalLSLCoordinator
Location: scripts/global-lsl-coordinator.js
- Multi-project transcript monitoring manager
- 30-second health checks on all registered projects
- Auto-recovery of dead Enhanced Transcript Monitors
- Maintains:
.global-lsl-registry.json
Layer 2: MonitoringVerifier
Location: scripts/monitoring-verifier.js
- Pre-session verification of all monitoring systems
- Exit codes: 0=OK, 1=Critical failure (MUST NOT START), 2=Warning
- Validates: watchdog, coordinator, project registration, service health
Layer 3: HealthVerifier (now reporter-mode CLI)
Location: scripts/health-verifier.js
Reduced to a one-shot reporter in plan 33-04. The start (daemon) subcommand was removed; the [program:health-verifier] supervisord block was retired in commit 58e968e45. Surviving subcommands:
| Command | Effect |
|---|---|
verify | Run database/service/process/file checks, POST a verify_run signal to the coordinator, exit 0/1 |
status | GET coordinator /health/state, print compact summary |
report | GET coordinator /health/state, print verbose (or --json) |
Auto-healing now flows through the coordinator (re-introduced after the initial Phase-33 cut): the dashboard's Restart-button click POSTs coordinator :3034 /health/remediate { action, service }, which dispatches via HealthRemediationActions.executeAction() on the host. The coordinator also runs an ensureEtmForActiveProjects() safety net every tick that auto-spawns ETM for any project with an active transcript and no fresh heartbeat. See Auto-healing for the full wiring.
Layer 4: StatusLineHealthMonitor (retired)
Replaced by on-demand rendering in scripts/combined-status-line.js. The statusline pulls coordinator /health/state per render and synthesizes the verifier-shape fields the badge logic needs. The legacy .logs/statusline-health-status.txt file is no longer written or read.
Layer 5: EnhancedTranscriptMonitor
Location: scripts/enhanced-transcript-monitor.js
- Real-time per-project transcript monitoring
- 2-second check interval for prompt detection
- Writes health files to centralized
.health/directory - Generates LSL files in
.coding/history/
Layer 5: LiveLoggingCoordinator
Location: scripts/live-logging-coordinator.js
- Orchestrates live logging components
- Manages LSLFileManager and operational logging
- Multi-user support with user hash tracking
- Performance metrics collection
Dashboard Features
The system includes a real-time web-based health dashboard accessible at http://localhost:3032:
Monitoring Cards
1. Databases (LevelDB, Qdrant, CGR Cache)
- Real-time connection status via coordinator sub-checks (
leveldb_lock_check,qdrant_availability,graph_integrity) - Lock detection and ownership tracking
- Availability monitoring
- CGR Cache staleness tracking (commits behind HEAD, "up to date" when 0 behind)
2. Services (VKB Server, Constraint Monitor, Dashboard, Semantic Analysis)
- Port connectivity checks
- Process health validation
- Service uptime tracking
3. Processes (Process Registry, Stale PIDs)
- Process State Manager (PSM) status
- Stale PID detection (probes for orphaned consolidation heartbeat files)
- Automatic cleanup reporting
4. LLM Proxy Health (Internet, Proxy, Network Location)
- Internet reachability (from coordinator
network.internet_reachable) - Proxy status (from coordinator
network.proxy_running) - Network location: VPN / Corporate / Home (from coordinator
network.location) - Local proxy (px) running status
- Auto-heal status
Dashboard Actions
- Run Verification: Manually trigger health verification
- Auto-Healing: Toggle automatic recovery mechanisms
- Live Updates: Real-time status updates every 5 seconds
- Violation Tracking: Detailed view of active system violations
- Recommendations: Actionable suggestions for system health improvement
Observations and digests — cold-store rendering
Older rows that have been pruned from the live SQLite DB are served from the JSON cold tier (the same .data/observation-export/*.json files we commit for cross-machine sync). The dashboard tells you when this happens:
- Snowflake icon (sky-blue
Snowflakefromlucide-react) on every observation card and digest row whose_origin === 'cold'. Hover for the tooltipOlder than retention window — served from JSON cold store. - The icon appears in two places per item — once on the card header and once inline next to the timestamp — so the cue is visible whichever way the operator is scanning.
- Pagination walks across both tiers (Phase 35-07 full-union pagination). Cold rows can appear on any page, not just the first.
If you see a sticky Observations API unreachable banner and a row of snowflake-tagged items, the banner is left over from a single transient 502 — it now self-clears on the next successful /api/consolidation/status poll (which happens every 2 s while the page is open). For the architectural side of this, see Health Monitoring — Observation cold storage.
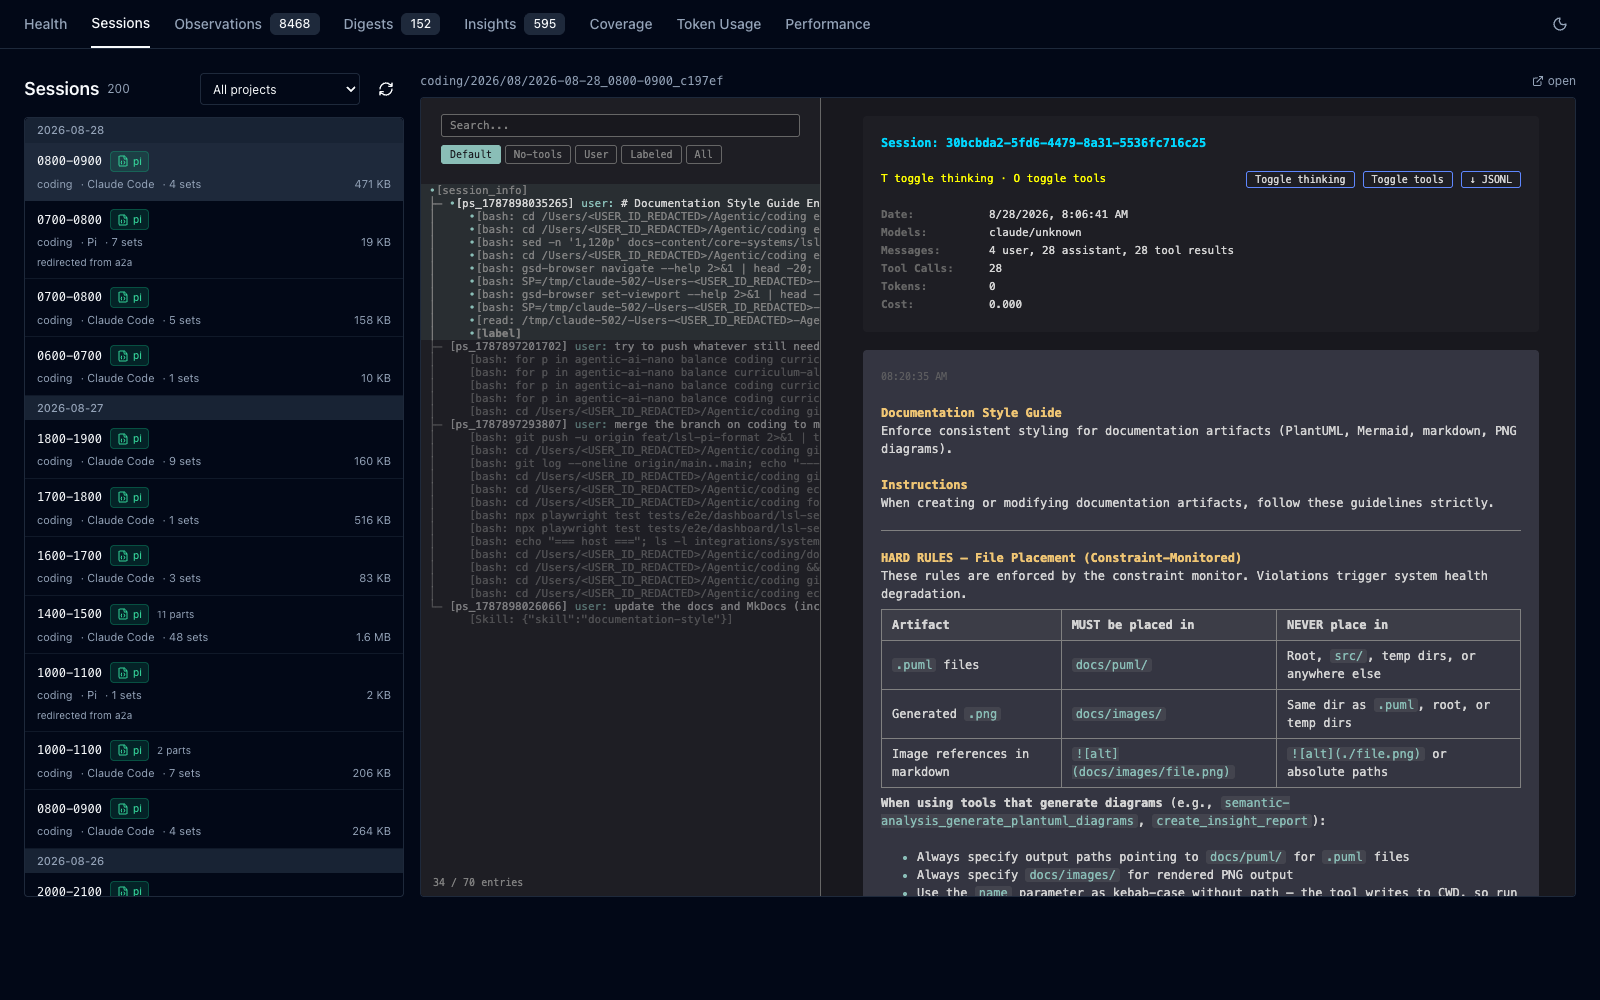
Sessions tab
Sits immediately before Observations and renders LSL transcripts verbatim, so you can read what an agent actually did rather than the classified summary of it.
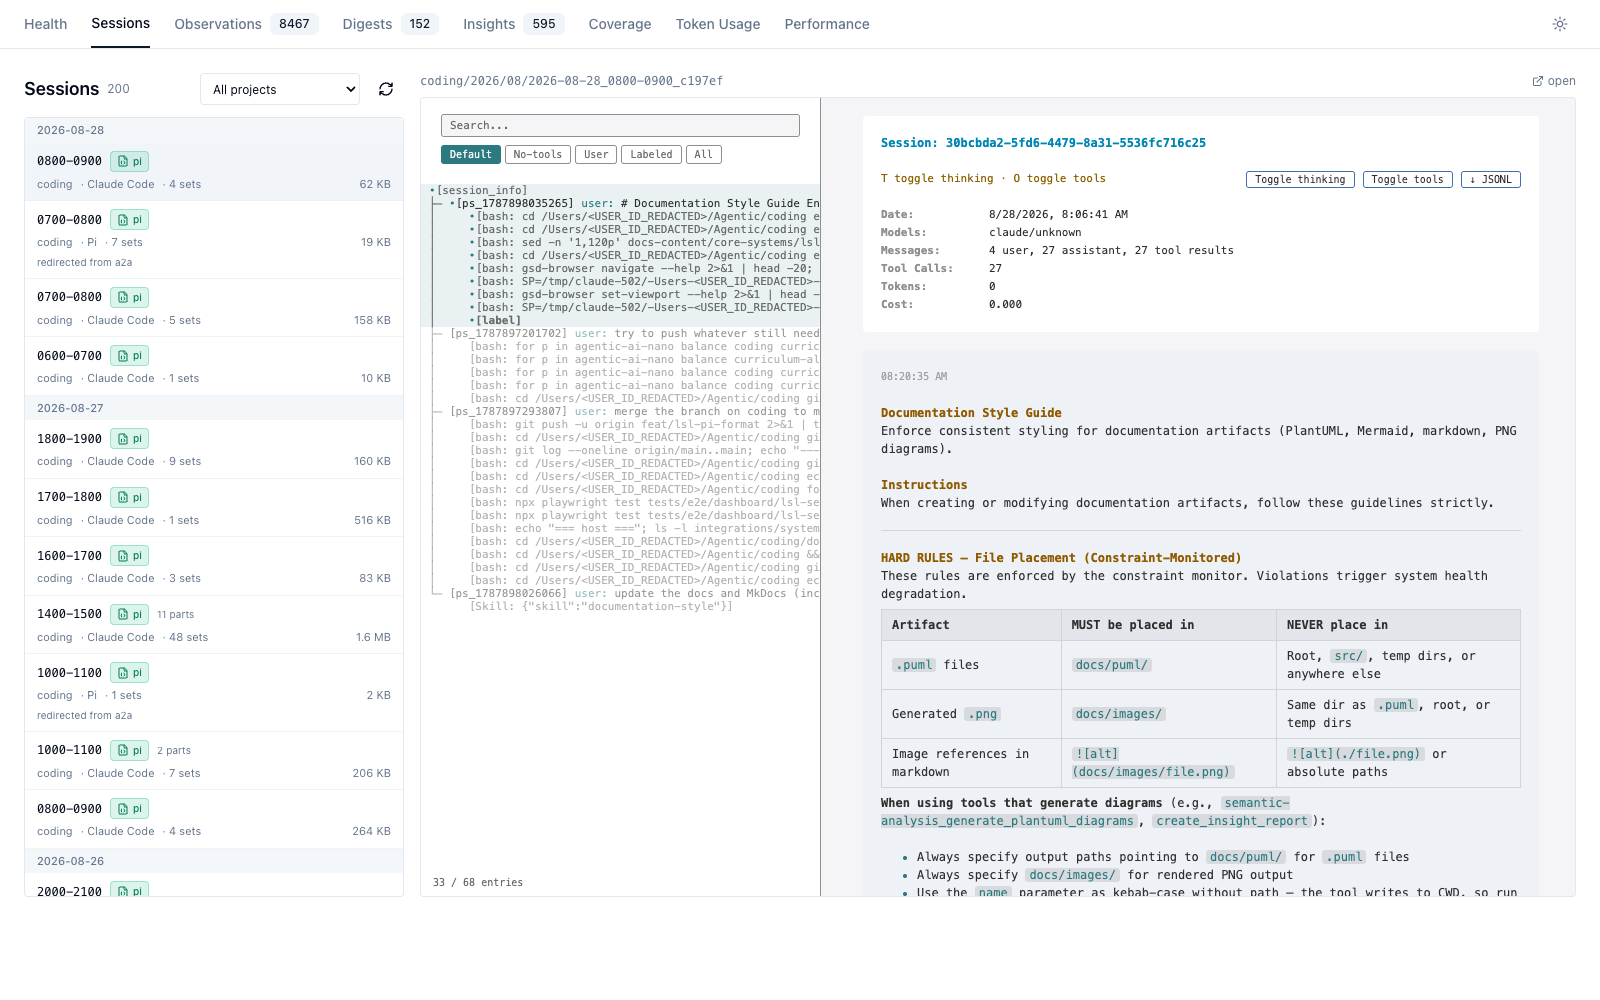
A row is a chain, not a file. An hourly tranche plus its rotation parts is one session: a legacy -N_ markdown part is a headerless fragment split mid-token and is meaningless alone, and a pi-format part is chained to its predecessor via parentSession. Listing files would show fragments. A 12-part tranche therefore presents as one session of 48 prompt sets and 991 tool calls, not twelve rows.
Both formats are served. A .md chain is converted in memory by the same parser and writer the backfill uses, which makes the tab a live preview of the conversion rather than merely a reader — that is what let the conversion be inspected before rewriting 22.5k files. The badge on each row says which path produced it. After a completed backfill every row reads pi.
Rendering reuses pi's own exported HTML shell rather than a hand-written renderer, so tool calls, diffs and thinking blocks look exactly as pi --export draws them and do not rot as pi evolves. The shell is vendored by scripts/vendor-pi-export-shell.mjs, because pi is a host tool and is not installed in the container that serves the dashboard.
The default selection skips to the newest session with content: the newest tranche is often mid-flush, and the monitor removes a prompt set before re-appending it, so a file read in that window is briefly header-only.
Theming
pi's exported shell is dark-only. The light palette is injected at render time from assets/pi-light-theme.css rather than edited into the shell, which the vendor script overwrites wholesale on every pi upgrade. The theme is stamped onto <html> server-side so the first paint is already correct; an iframe is a separate document and cannot inherit the theme through CSS, so the page re-requests the transcript when the toggle flips.
Endpoints
| Route | Returns |
|---|---|
GET /api/lsl/projects | Projects with an LSL history tree |
GET /api/lsl/sessions | Chains, newest first (project, limit, months) |
GET /api/lsl/sessions/:id | Parsed entries for one chain |
GET /api/lsl/sessions/:id/export.html?theme= | Full-fidelity render (light | dark) |
GET /api/lsl/promptset/:psId | Every slice of one prompt set, across tranches and projects |
The last one is the query markdown could only answer with grep -l ps_X *.md: a set spanning tranches or rotation parts carries the same promptSetId in each, so the fragments can be stitched back into one conversation.
If the viewer reports pi export shell missing
The container is serving a stale bind mount — switching branches can delete and recreate assets/, and the FUSE cache keeps the deleted state. Compare ls on the host with docker exec coding-services ls on the same path; if they disagree, run a full docker-compose restart coding-services. supervisorctl restart re-reads the same stale cache.
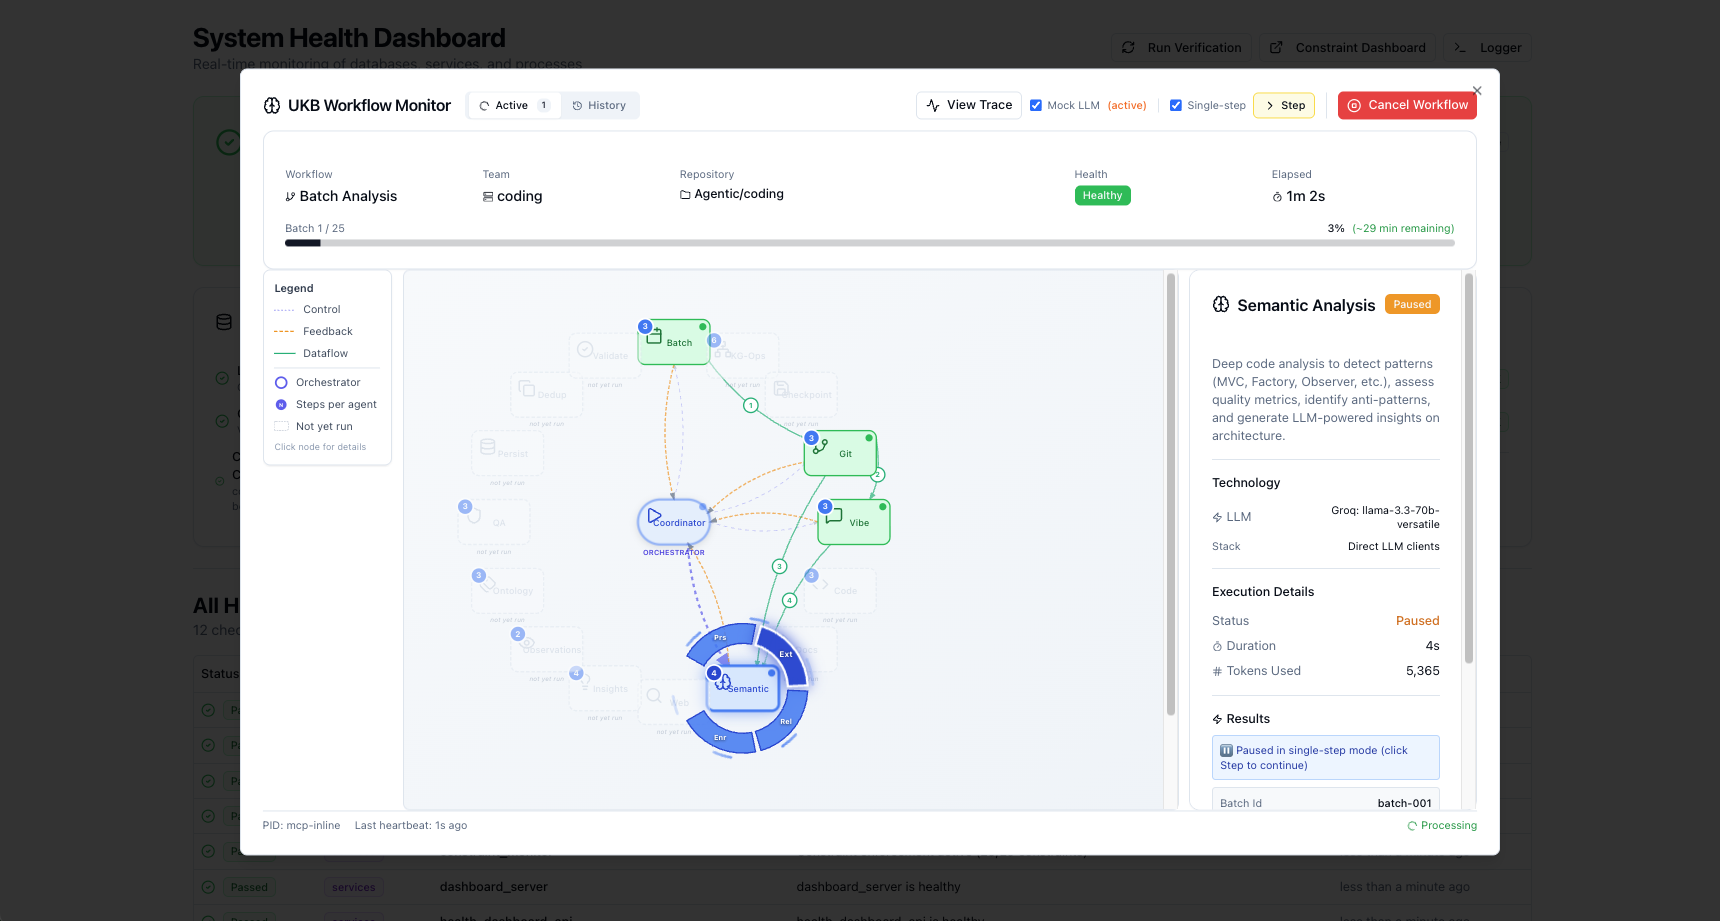
UKB Workflow Monitor
The dashboard includes a dedicated UKB Workflow Monitor that provides visual tracking of knowledge base update workflows:
Features
- Visual Multi-Agent Workflow Graph - Hub-and-spoke visualization showing the Coordinator orchestrating 13 specialized agents (Git, Vibe, Code, Semantic, Ontology, QA, etc.)
- Agent Status Indicators - Real-time execution status per agent (running, completed, not yet run)
- Pipeline Statistics - Commits processed, sessions analyzed, candidates discovered vs. final entities
- Deduplication Metrics - Shows reduction percentage (e.g., 86.9% reduction from raw to final)
- Entity Breakdown - Final counts by type (GraphDatabase, MCPAgent, System, Pattern, etc.)
- Execution Details - Duration, LLM provider used (e.g., Groq llama-3.3-70b), completion status
- Historical View - Browse past workflow executions with full details
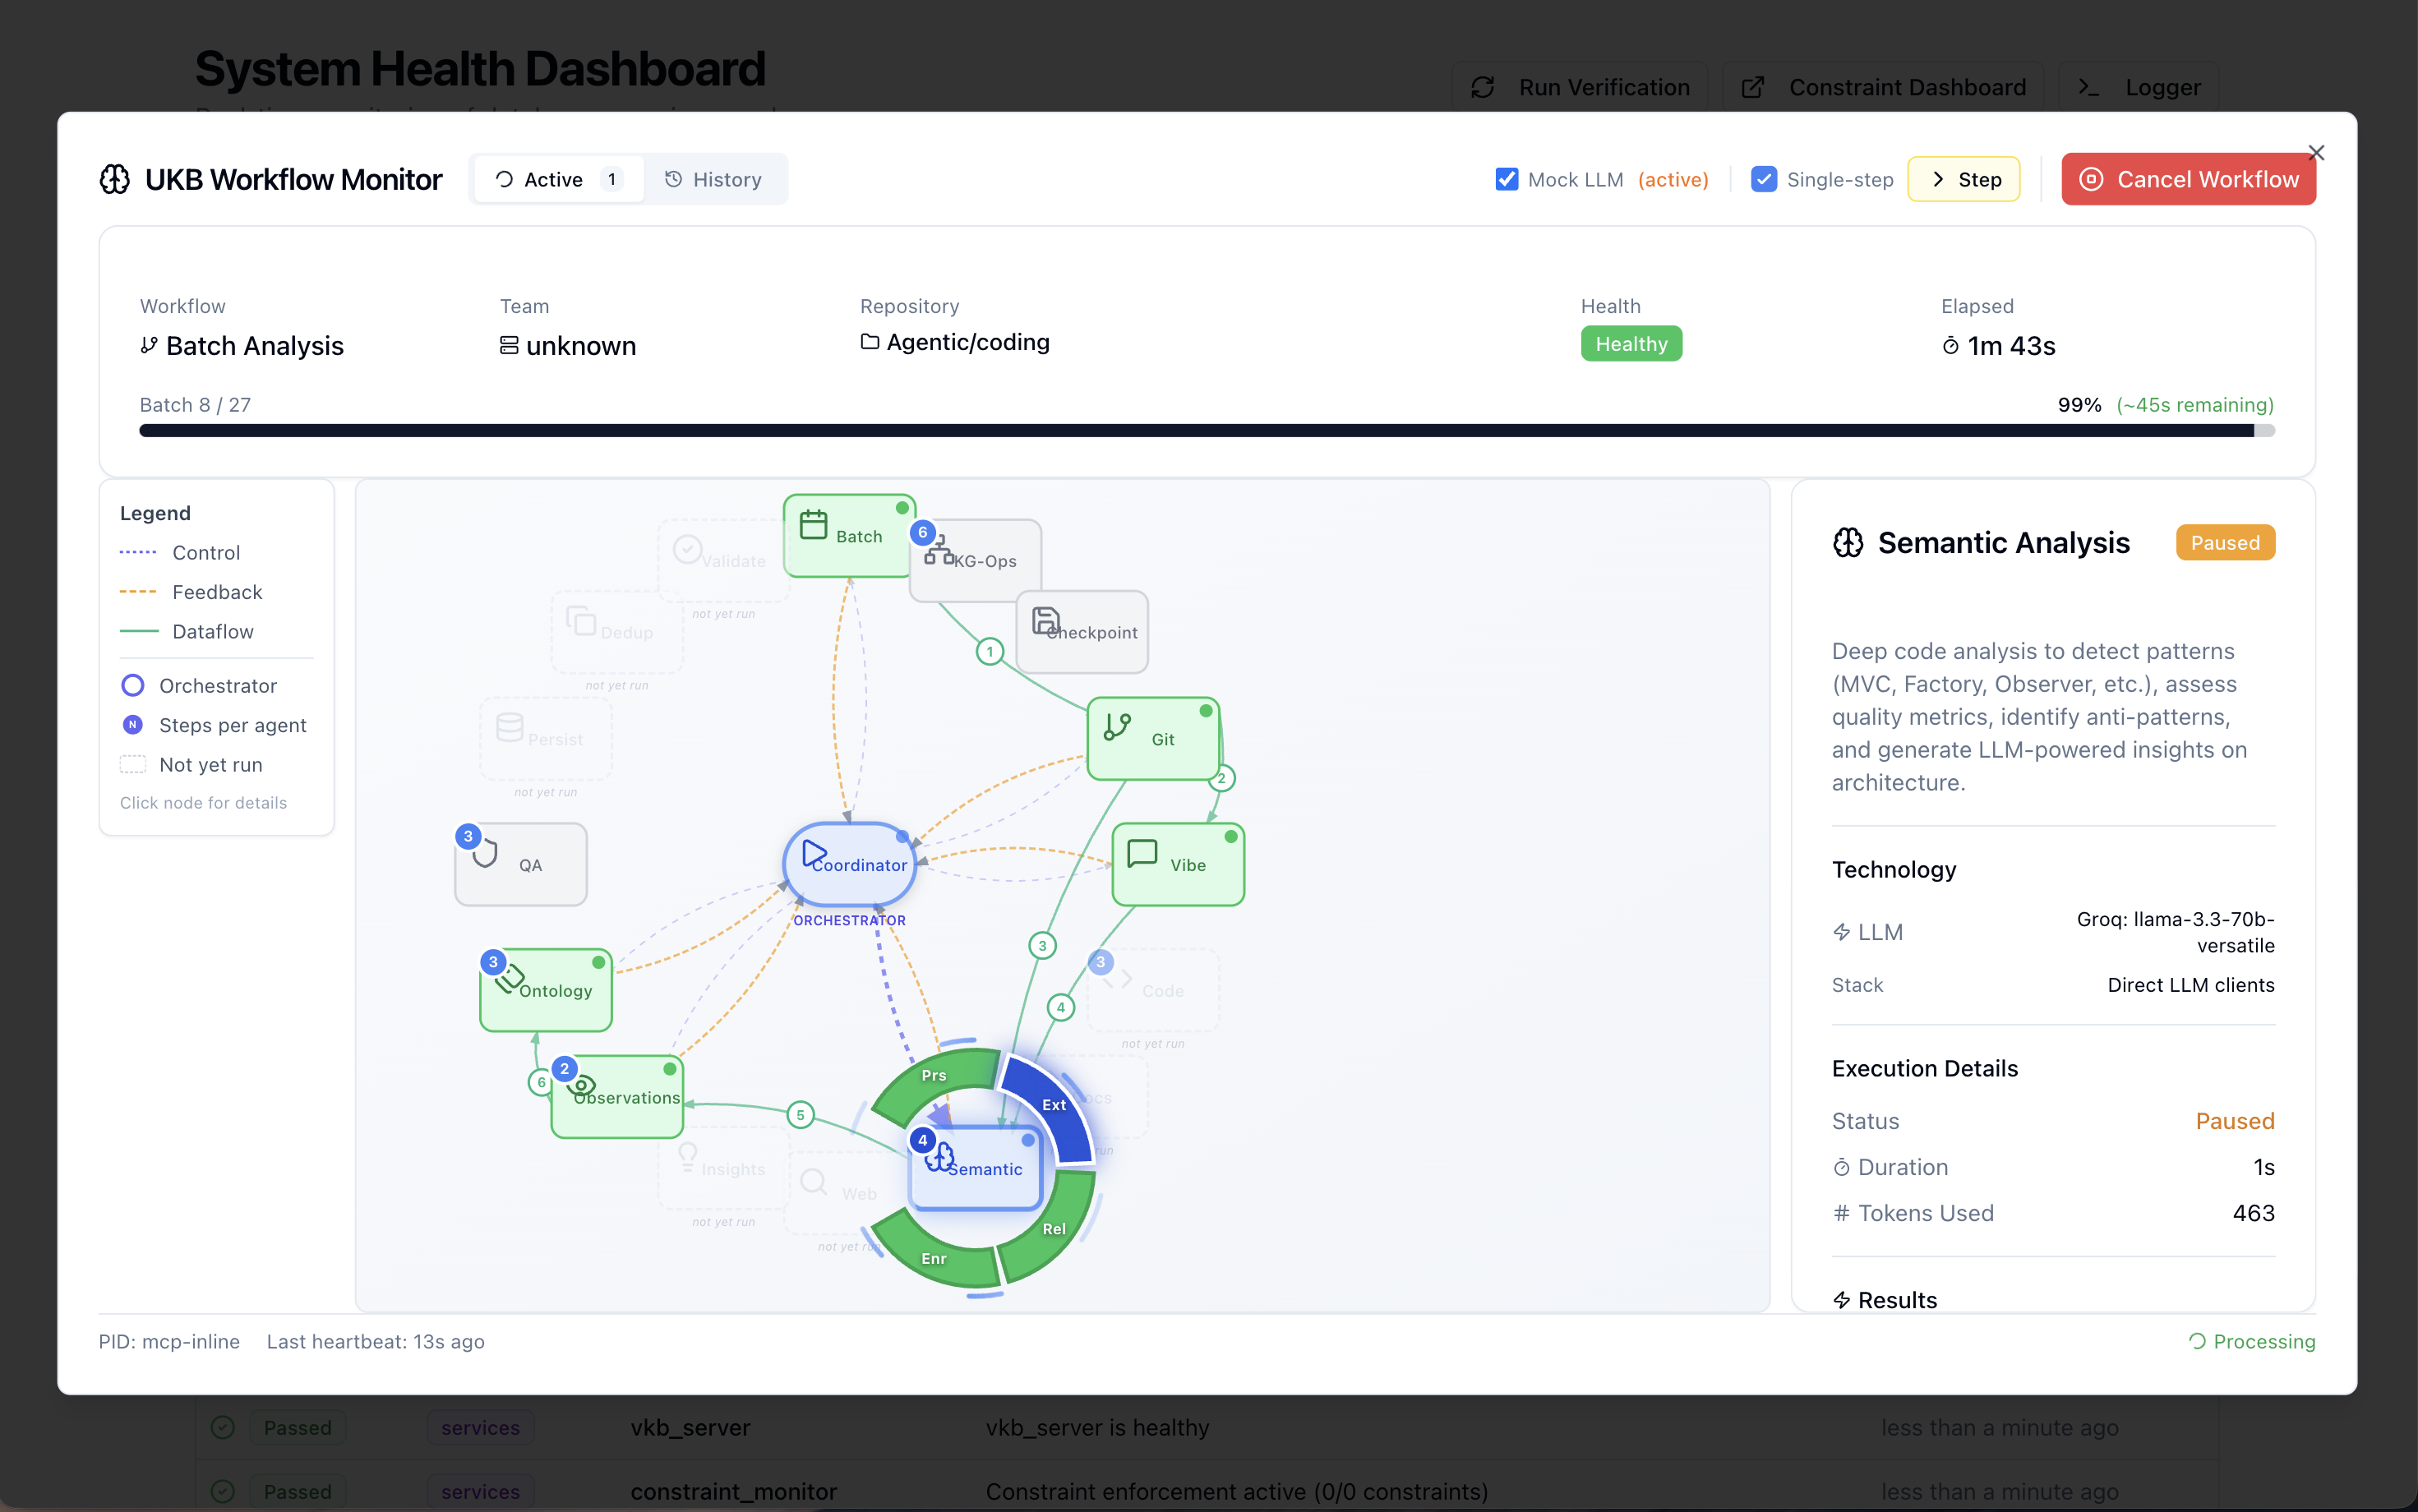
Sub-Steps Visualization
The workflow graph now displays sub-steps for multi-step agents. Click the blue badge on an agent node to expand and view its internal processing steps:
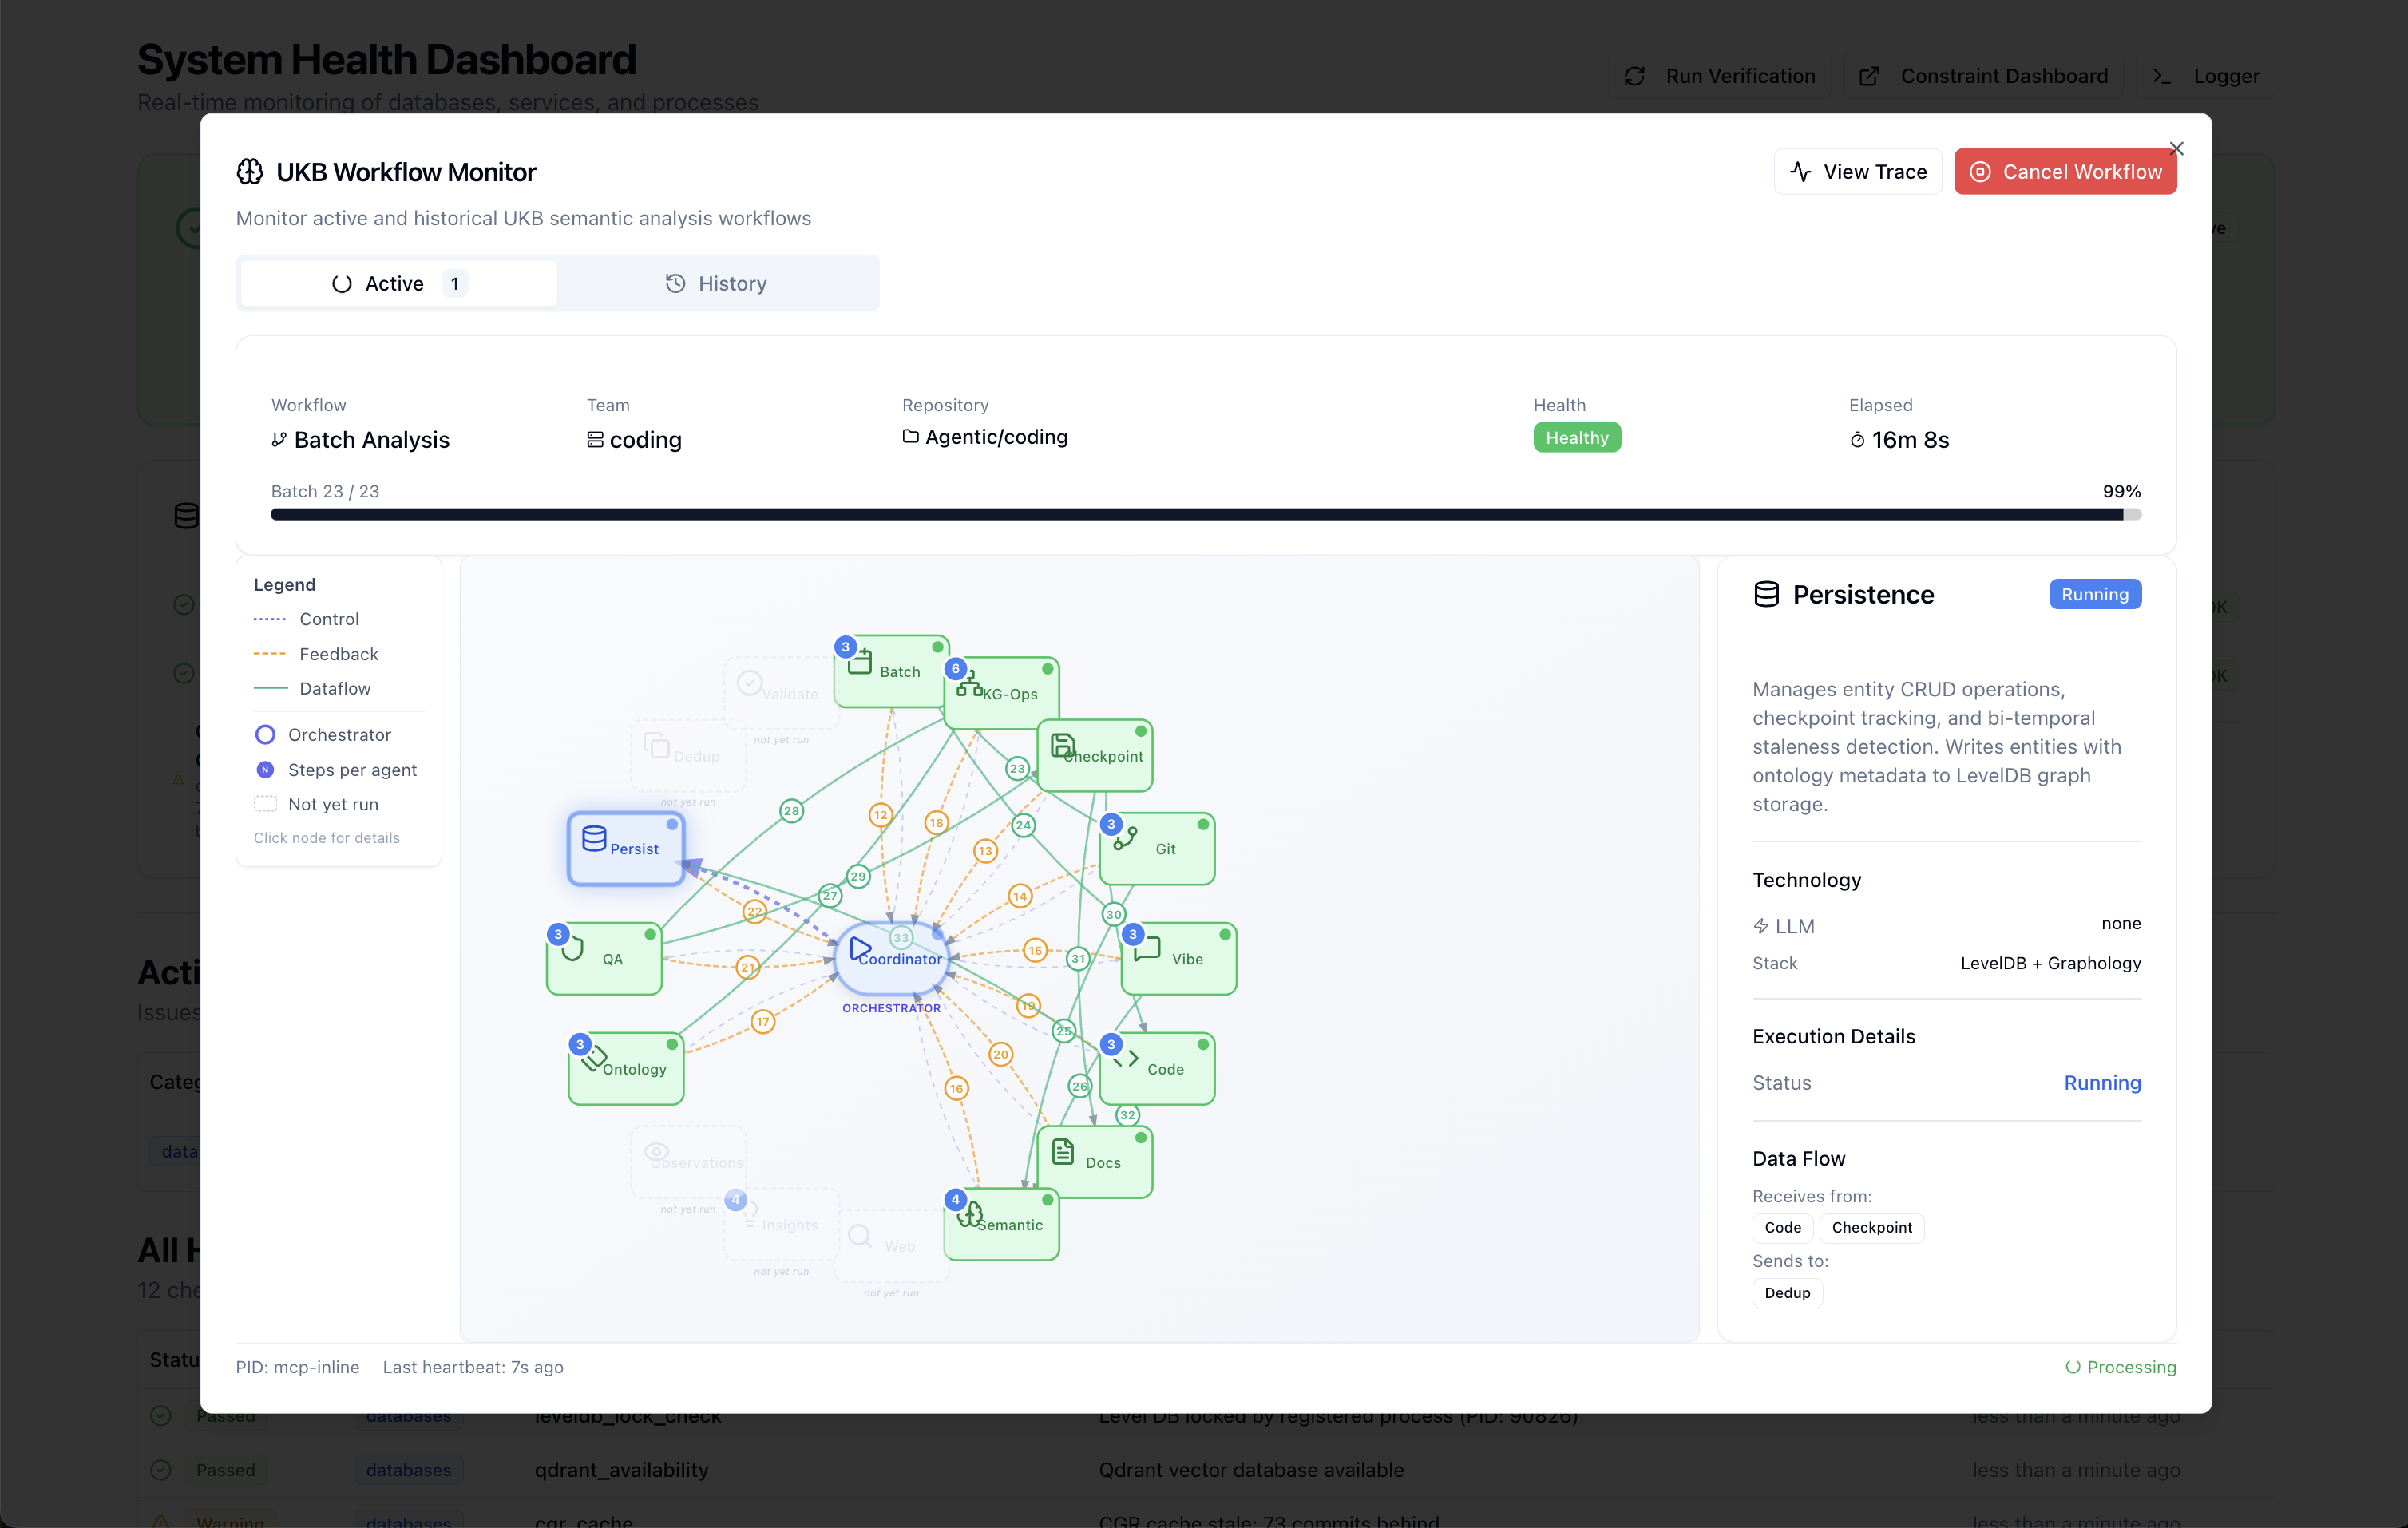
Each sub-step arc shows the step name and can be clicked to view detailed information including inputs, outputs, and LLM usage:
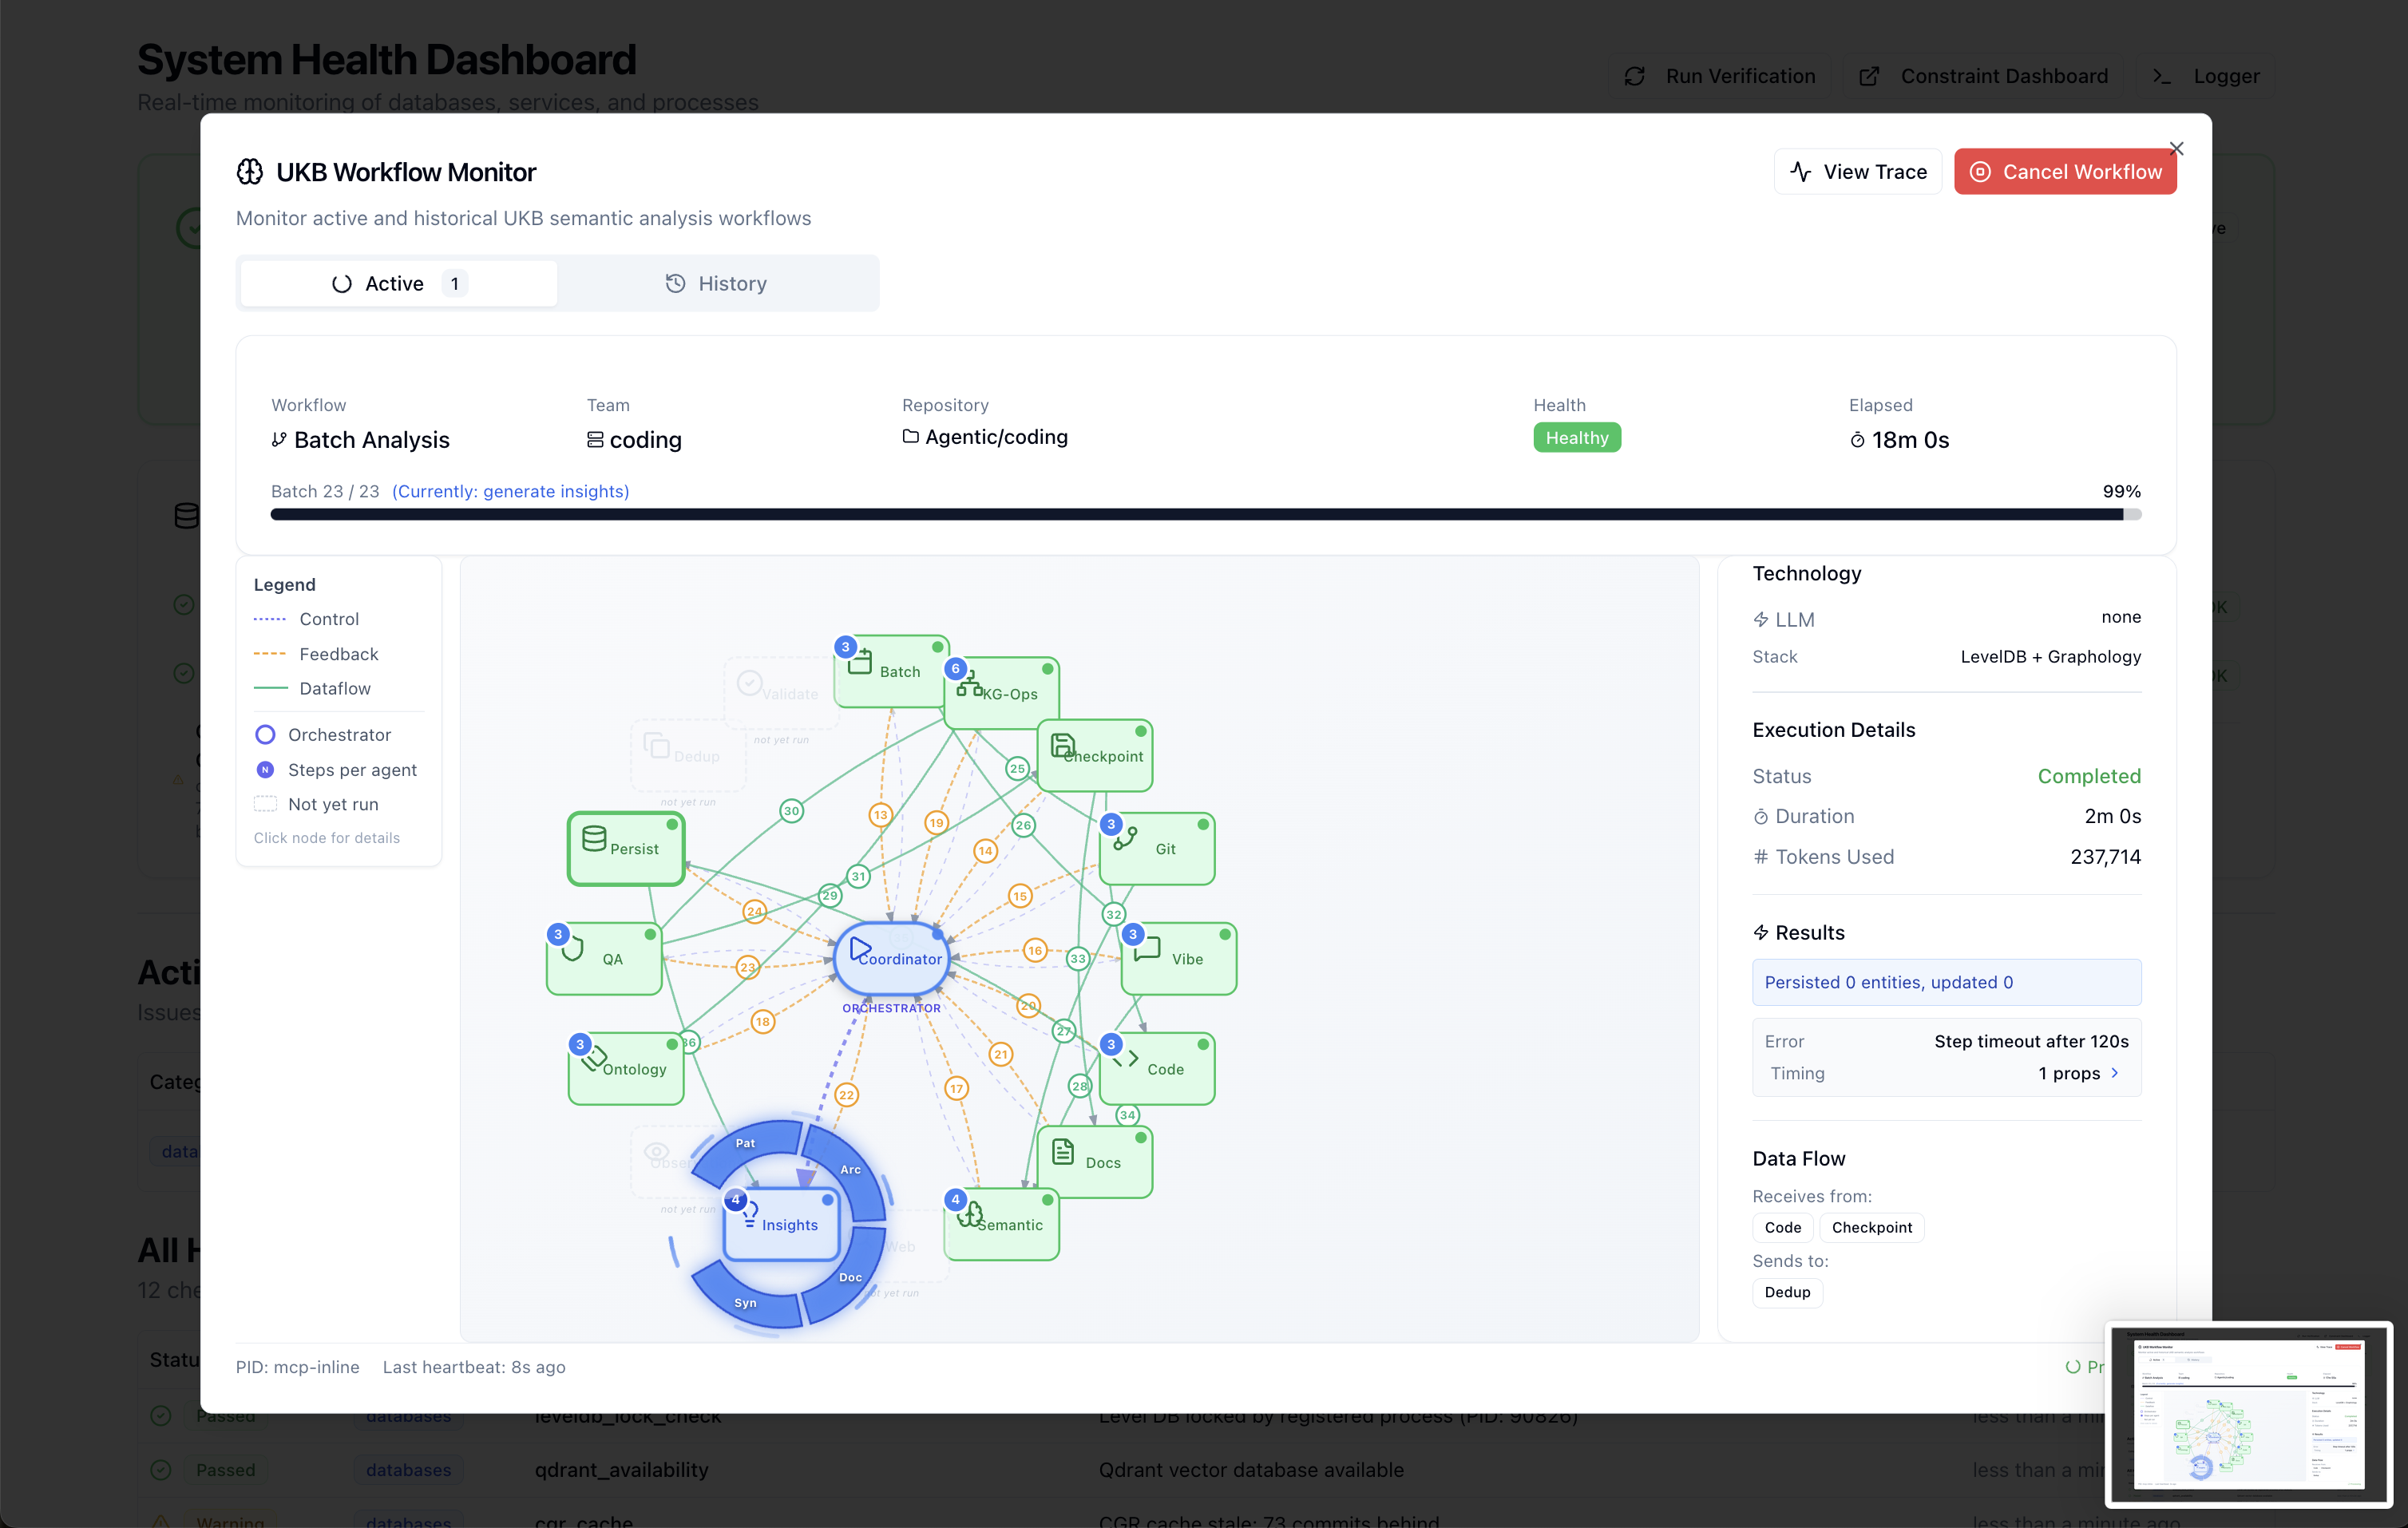
Sub-Steps Features:
- Auto-expand on running: When a multi-step agent starts executing, its sub-steps automatically expand with animation
- Pulsing animation: Running agents display a pulsing glow effect on their sub-step arcs
- Rotating indicator: A rotating dashed circle shows active processing
- Click to select: Click any sub-step arc to view its detailed information in the sidebar
- Inputs/Outputs: Each sub-step shows what data it receives and produces
- LLM Usage: Indicates whether the sub-step uses no LLM, fast, standard, or premium models
Execution Tracing
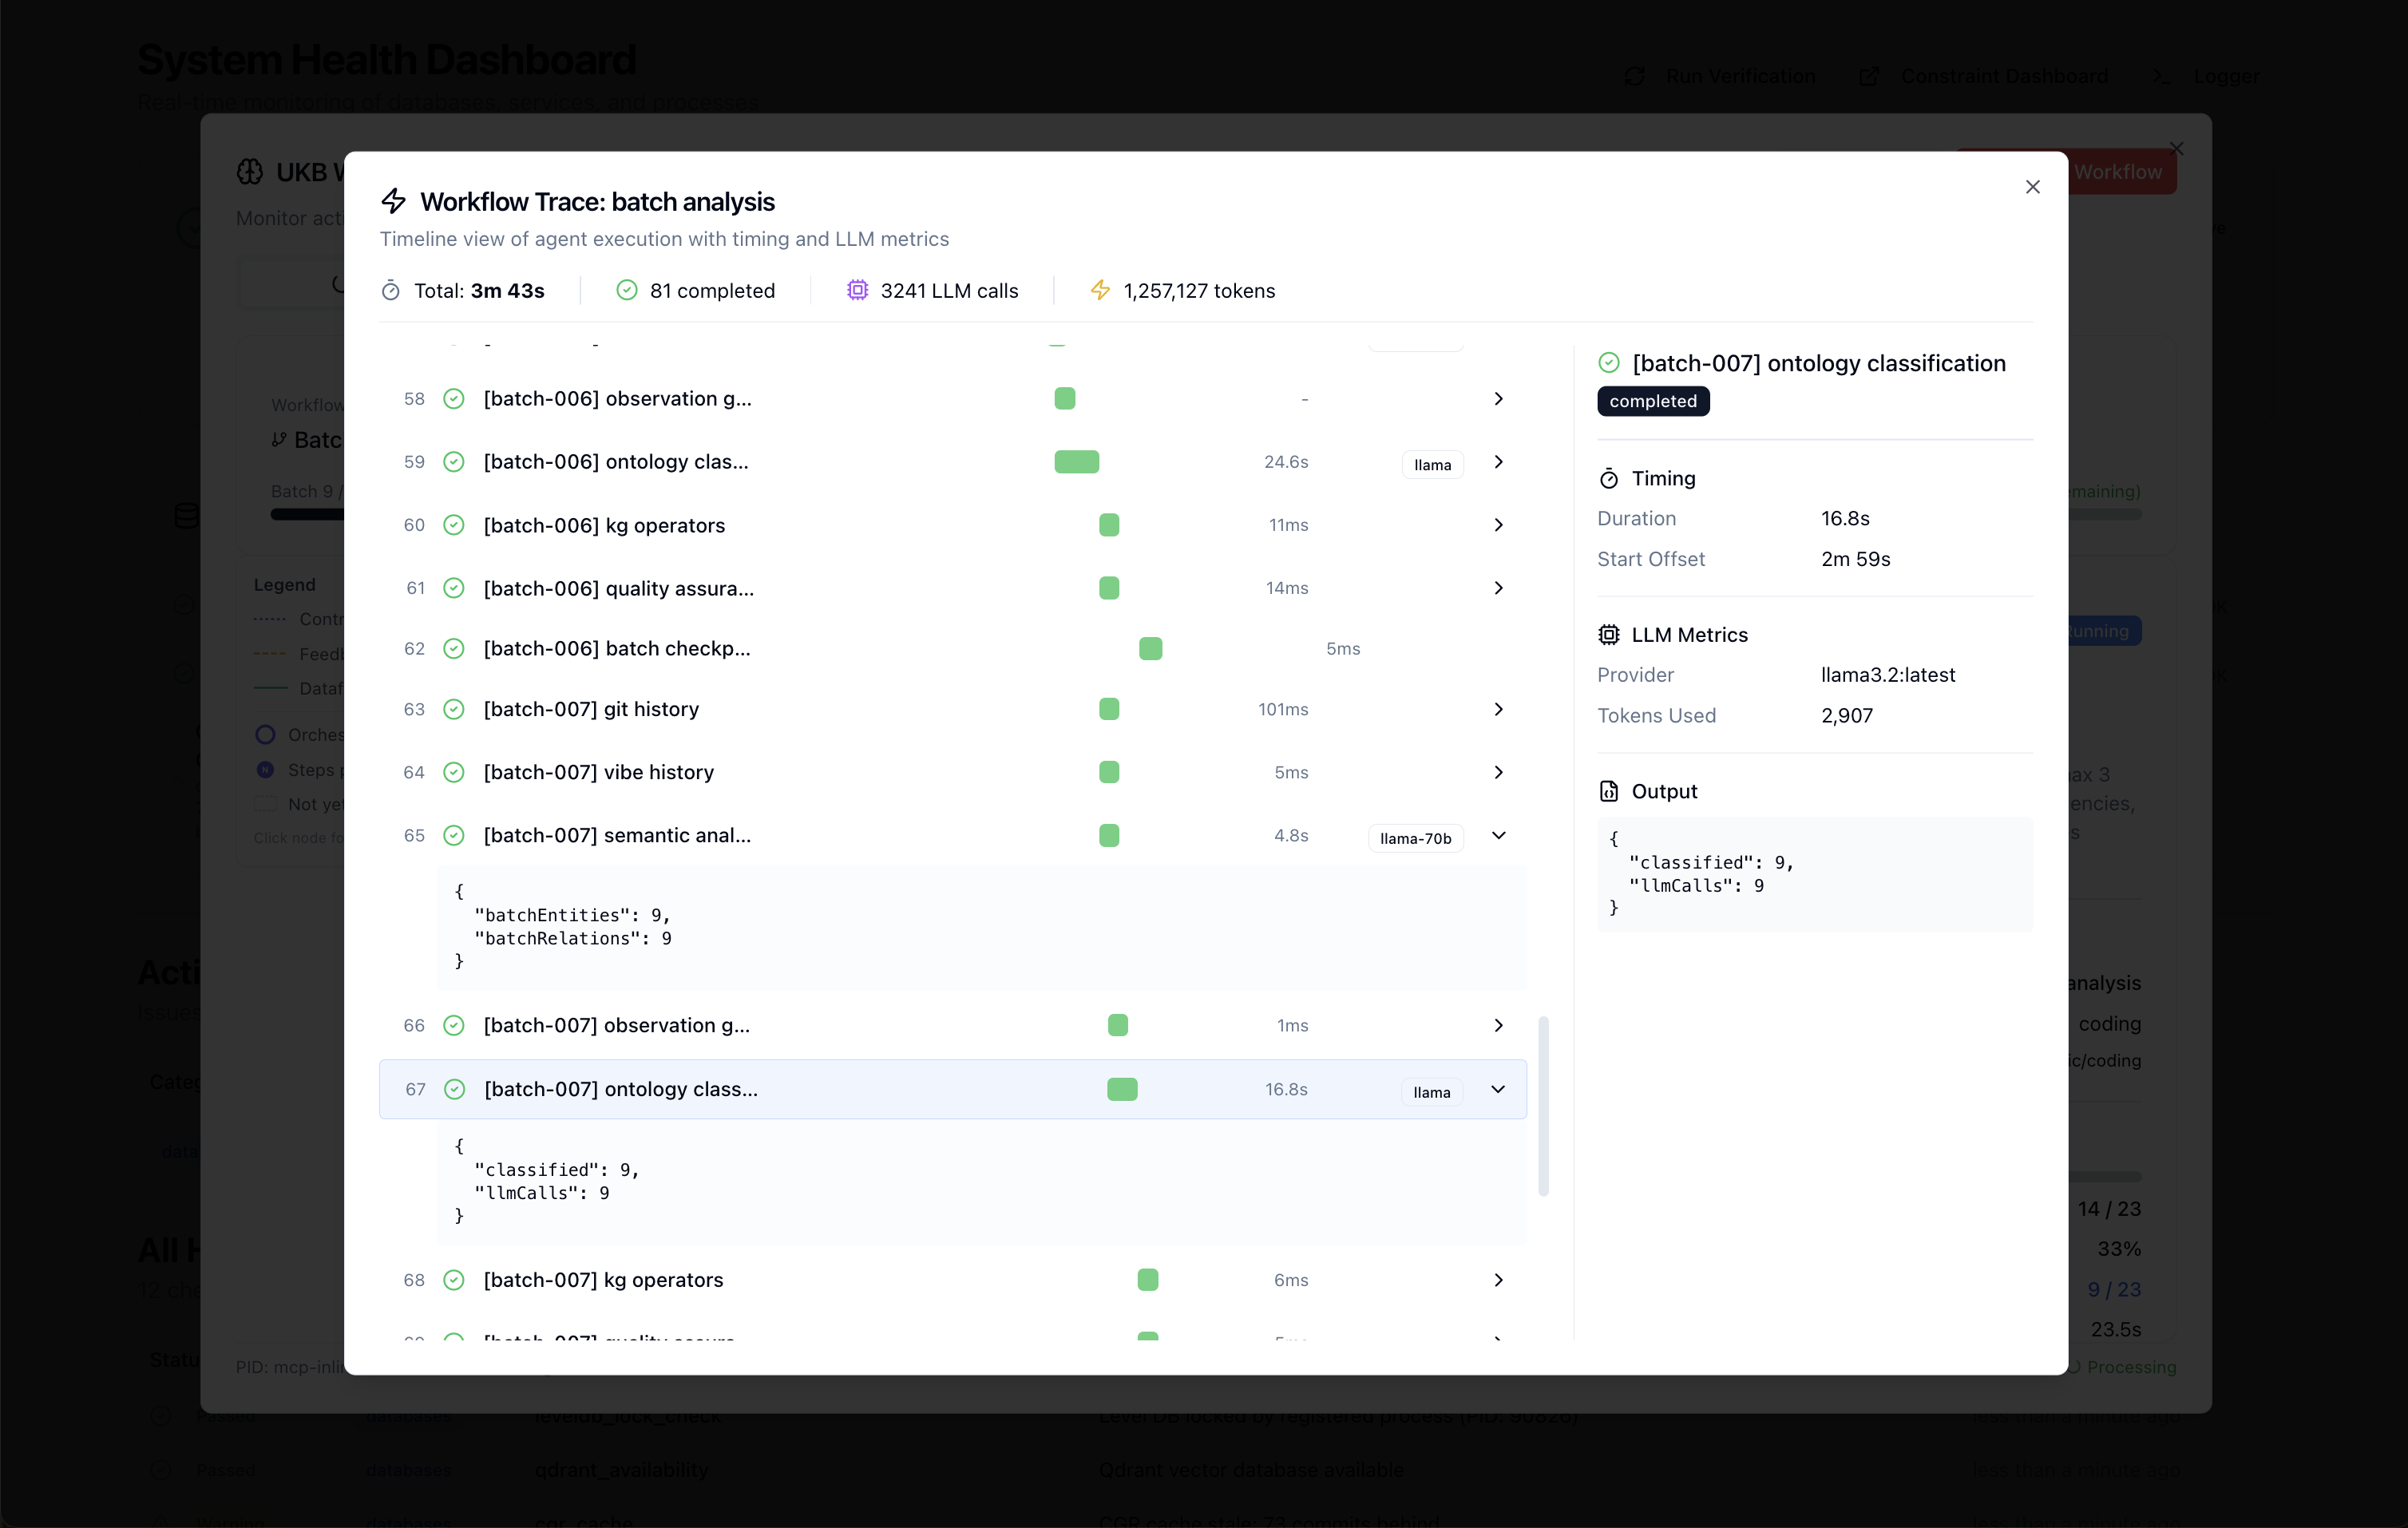
The "View Trace" button opens the execution trace modal showing the complete timeline of all workflow steps with detailed timing, outputs, and any errors encountered.
Access: Click the "UKB Workflow Monitor" card on the dashboard or navigate to the dedicated tab.
Workflow Debug Controls
The UKB Workflow Modal provides powerful debugging capabilities for development and troubleshooting:
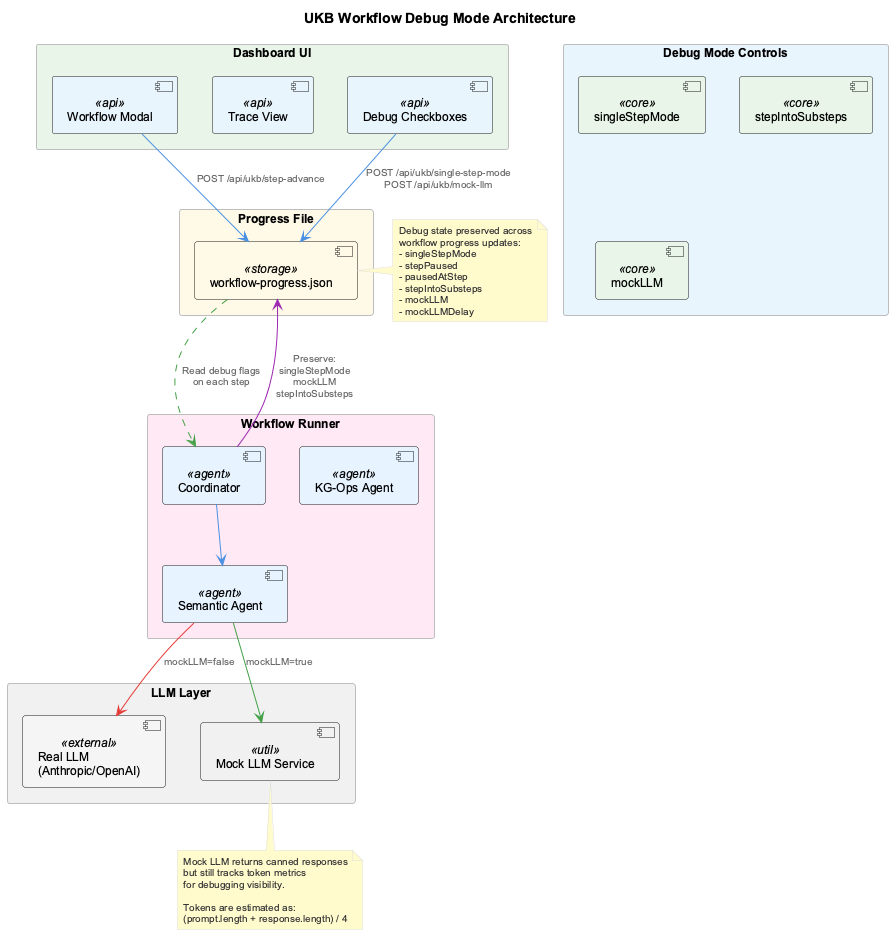
Single-Step Mode
Enable single-step mode to pause the workflow after each agent completes, allowing you to inspect intermediate results:
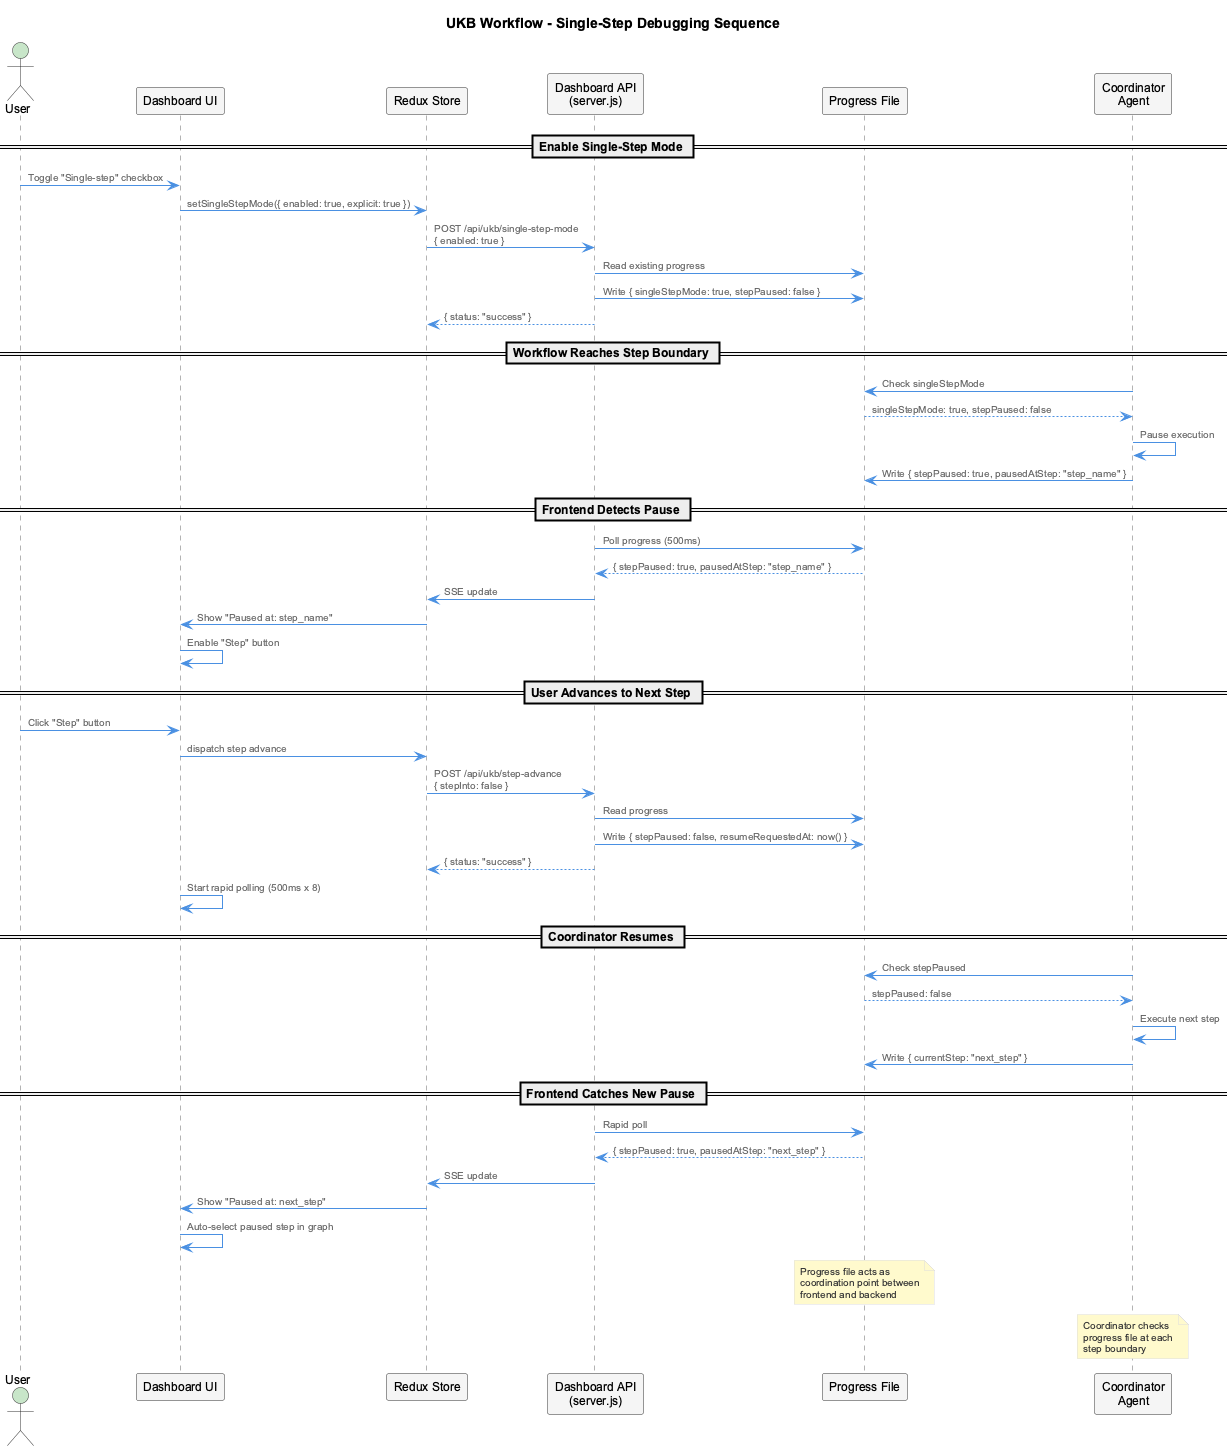
How to Enable:
- Open the UKB Workflow Monitor
- Toggle "Single-Step Mode" checkbox before starting a workflow
- Or start with:
ukb debugin Claude chat
Controls:
| Button | Action |
|---|---|
| Continue | Execute next agent and pause |
| Skip | Skip current agent, move to next |
| Run All | Disable single-step, run to completion |
| Abort | Stop workflow immediately |
LLM Mode Control
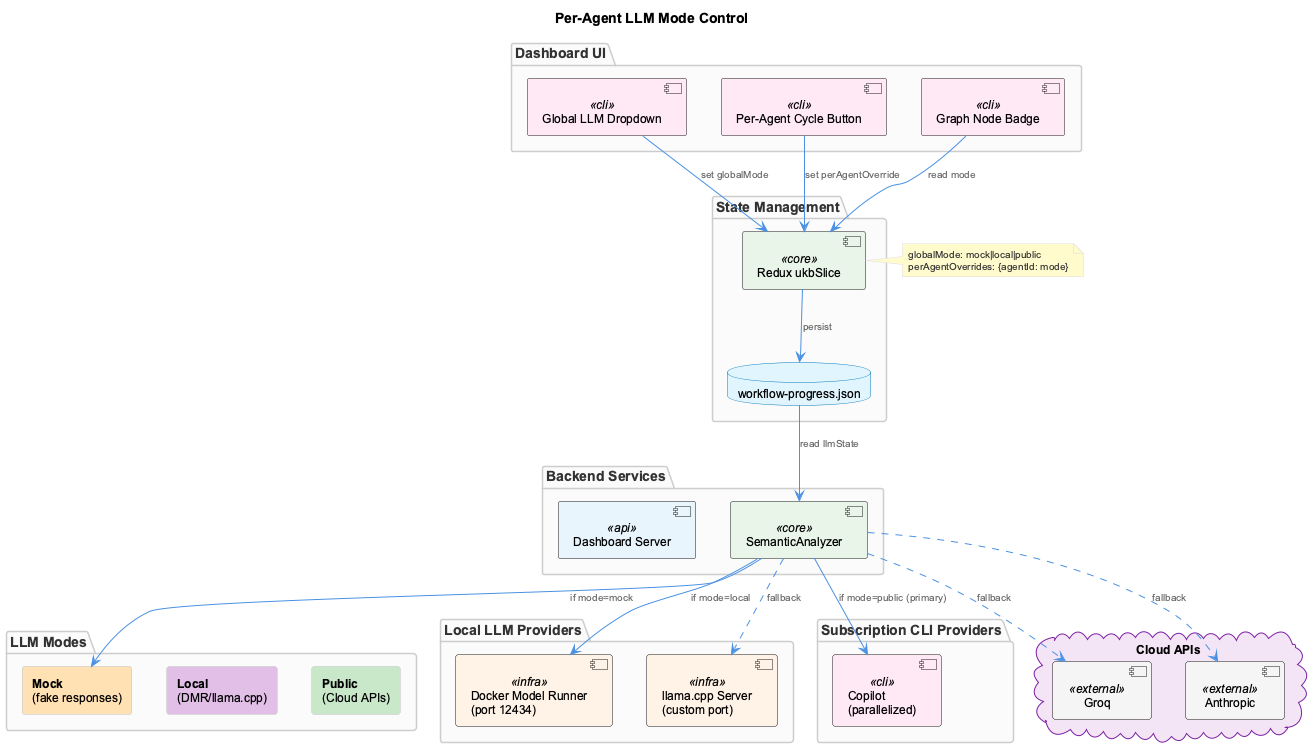
The workflow supports three LLM execution modes, configurable per-workflow or globally:
| Mode | Description | Cost | Use Case |
|---|---|---|---|
| Public | Use configured cloud providers (Groq, Anthropic, OpenAI) | $$ | Production, high-quality analysis |
| Local | Use DMR/llama.cpp local models | Free | Development, privacy, offline |
| Mock | Return simulated responses | Free | Testing, UI development |
Switching Modes:
- Per-workflow: Toggle in the workflow modal before starting
- Via Claude:
ukb debug(enables mock mode by default) - Environment: Set
SEMANTIC_LLM_MODE=local|public|mock
Mock LLM Mode
Mock mode returns pre-defined responses without making actual LLM calls. Useful for:
- Testing workflow UI without API costs
- Debugging agent sequencing
- CI/CD pipeline testing
- Developing new agents
Enable Mock Mode:
# Via Claude chat
ukb debug  # Automatically enables mock mode

# Via environment
export SEMANTIC_LLM_MODE=mock
Local LLM Mode (DMR/llama.cpp)
Run workflows using locally-hosted models via Docker Model Runner or llama.cpp:
Prerequisites:
- DMR running on configured port (default: 12434)
- Model downloaded and available
Configuration:
# .env.ports
DMR_PORT=12434
DMR_HOST=localhost

# .env
LOCAL_MODEL=llama-3.2-3b  # Or your preferred model
Benefits:
- Zero API costs
- Data privacy (no external calls)
- Offline operation
- Faster iteration during development
See LLM Providers Guide for complete local model setup.
Tracer View
The tracer provides detailed execution logs for every LLM call:
Tracer Information:
| Field | Description |
|---|---|
| Agent | Which agent made the call |
| Provider | LLM provider used (groq, local, mock) |
| Model | Specific model (llama-3.3-70b, etc.) |
| Input Tokens | Prompt token count |
| Output Tokens | Response token count |
| Duration | Call latency in milliseconds |
| Cost | Estimated cost (if applicable) |
| Input | Full prompt sent |
| Output | Full response received |
Access Tracer:
- Click "View Trace" button in workflow modal
- Or expand any agent node and click the trace icon
- Filter by agent, status, or time range
Step-Into Sub-Steps
For agents with multiple internal steps, you can step into sub-step execution:
Enable Sub-Step Debugging:
- Enable "Step Into Sub-Steps" checkbox
- Workflow will pause at each sub-step boundary
- Inspect inputs/outputs for each sub-step
- Continue to next sub-step or skip to next agent
Sub-Step Information:
- Step name and sequence number
- Input data from previous step
- Output data produced
- LLM usage indicator (none/fast/standard/premium)
- Execution duration
Daemon Robustness Mechanism
The HealthVerifier daemon implements a defense-in-depth approach to ensure continuous health monitoring.
Heartbeat Mechanism
The daemon writes a heartbeat file every verification cycle to prove liveness:
Location: .health/verifier-heartbeat.json
{
  "pid": 64832,
  "timestamp": "2025-12-14T07:32:42.292Z",
  "uptime": 30.98,
  "memoryUsage": 11647584,
  "cycleCount": 2
}
Defense-in-Depth Summary
| Layer | Mechanism | Protection |
|---|---|---|
| Internal | Error Handlers | Catches uncaught exceptions/rejections |
| Internal | Timer Self-Check | Detects if setInterval stops |
| External | Heartbeat File | Proves daemon is alive and cycling |
| External | API Watchdog | Auto-restarts stale/dead daemons |
Auto-Recovery Mechanisms
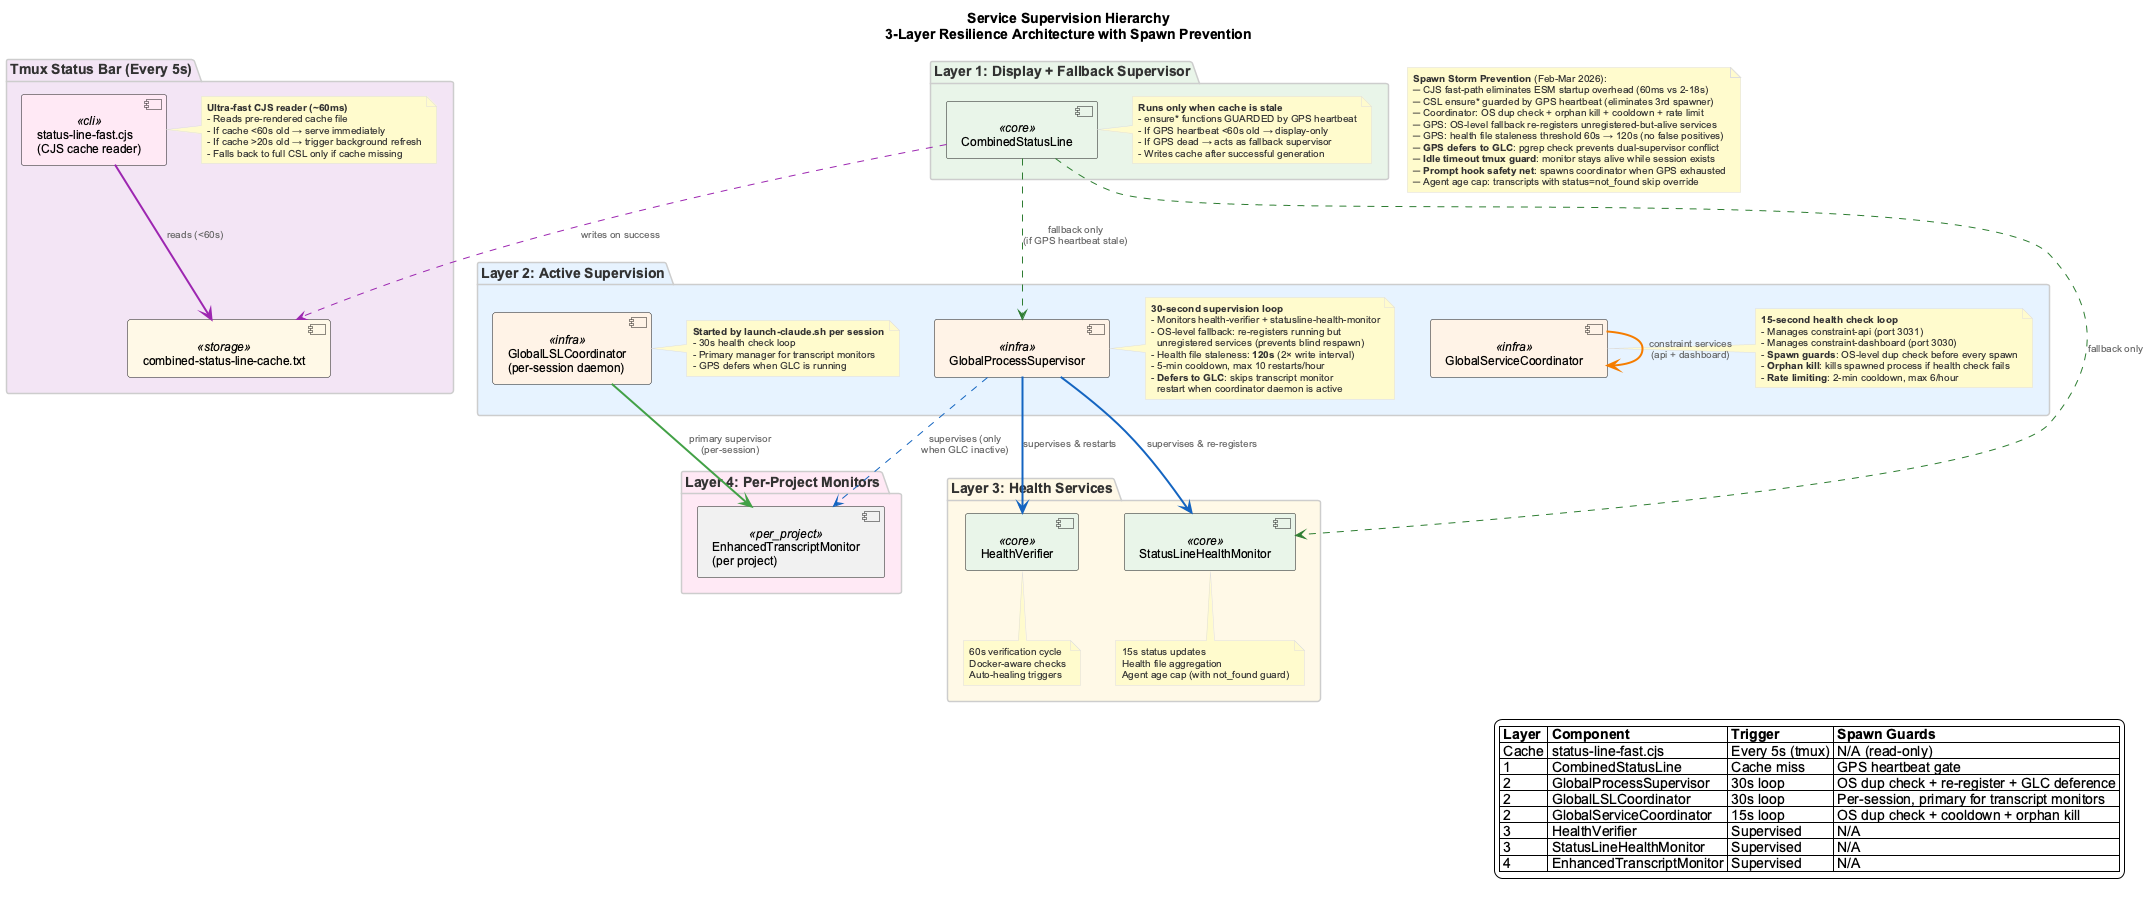
Plug'n'Play Behavior
The system provides seamless recovery without requiring user intervention:
- Dead Monitor Detection: Identifies stale or crashed monitor processes
- Automatic Recovery: Spawns new monitors for unmonitored sessions
- Registry Updates: Maintains accurate process tracking
- Health Verification: Confirms recovery success
Recovery Scenarios
- Stale PID Recovery: Detects and replaces dead process IDs
- Missing Monitor Recovery: Creates monitors for active but unmonitored sessions
- Coordinator Recovery: Restarts coordination processes when needed
- Health Check Recovery: Resumes health checking when coordinator fails
Global Monitoring Enhancements
- Port Connectivity Monitoring: Tests dashboard (port 3030) and API (port 3031) connectivity
- CPU Usage Detection: Identifies stuck processes consuming excessive CPU (>50%)
- Process Health Validation: Verifies running processes match expected PIDs
- Stuck Server Detection: Automatically detects and reports unresponsive dashboard servers
Database Health Monitoring
Database Lock Detection
- Pre-flight Lock Detection: Checks for Level DB locks before opening database
- Lock Owner Identification: Uses
lsofto identify which process holds database locks - Actionable Error Messages: Provides clear instructions for resolving lock conflicts
- Qdrant Health Checks: Monitors vector database availability
Health Check Response
{
  levelDB: {
    available: boolean,
    locked: boolean,
    lockedBy: number | null  // PID of lock holder
  },
  qdrant: {
    available: boolean
  }
}
Fail-Fast Architecture
The system uses explicit error handling instead of silent degradation:
Error Message:
Failed to initialize graph database: Level DB is locked by another process (PID: 12345).
This is likely the VKB server. To fix:
  1. Stop VKB server: vkb server stop
  2. Or kill the process: kill 12345
  3. Then retry your command
Health Data Storage
Coordinator-Centric Architecture (Phase 33+)
ETM health is no longer kept in per-project .health/*.json files. The enhanced-transcript-monitor POSTs lsl_heartbeat signals to the health-coordinator's /health/signal endpoint on every poll cycle, and the coordinator's in-memory state.lsl slice is the sole source of truth.
- Endpoint:
http://localhost:3034/health/state - Slice:
state.lsl[<sid>:<projectName>] - Schema:
{ status: 'running'|'stopped', lastBeat: <ms-epoch>, projectName, ... } - Process registry:
ProcessStateManager(scripts/process-state-manager.js) tracks ETM PIDs at'enhanced-transcript-monitor' / 'per-project' / { projectPath }.
Inspecting Live ETM Health
# All ETMs across all projects
curl -fs http://localhost:3034/health/state | jq '.lsl'

# Just one project (e.g. coding)
curl -fs http://localhost:3034/health/state \
  | jq '.lsl | to_entries | map(select(.key | endswith(":coding")))'

# Process registry view (PIDs)
node -e 'const PSM=require("./scripts/process-state-manager.js").default;(async()=>{const p=new PSM();await p.initialize();console.log(await p.getService("enhanced-transcript-monitor","per-project",{projectPath:process.cwd()}));})()'
Coordinator State Shape
{
  "etm-82997-1778496466077:coding": {
    "status": "running",
    "lastBeat": 1778497234567,
    "projectName": "coding",
    "transcriptPath": "/Users/.../coding/<session-id>.jsonl"
  }
}
Heartbeat staleness threshold is HEARTBEAT_STALENESS_MS = 15_000 (coordinator marks status='stopped' after 15s without a beat); stopped entries are evicted after EVICT_AFTER_STOPPED_MS = 5 * 60 * 1000.
Legacy .health/ Directory
The .health/ directory still exists but only holds the slimmer *-transcript-monitor-state.json files (per-ETM crash-recovery state), NOT the *-transcript-monitor-health.json files documented in earlier versions. The old health-JSON shape was retired at the Phase 33 cutover (commit 8f304038e and the coordinator-signal migration that followed). Plan 34-05 Task 2(d) removed the last reader sites in scripts/combined-status-line.js on 2026-05-11.
PSM Singleton Pattern
The StatusLine Health Monitor daemon implements a robust singleton pattern via PSM integration:
Registration Flow
- On startup, daemon checks PSM for existing healthy instance
- If found and
--forcenot specified, exits with error message - If not found or
--forcespecified, registers as global service - Refreshes health check timestamp every 30 seconds
- On graceful shutdown, unregisters from PSM
CLI Options
# Start daemon (will fail if already running)
node scripts/statusline-health-monitor.js --daemon

# Force start (kills existing instance)
node scripts/statusline-health-monitor.js --daemon --force

# With auto-healing enabled
node scripts/statusline-health-monitor.js --daemon --auto-heal
Viewing PSM Status
Output:
Process Health Status:
   Total: 5 | Healthy: 5 | Unhealthy: 0

Global Services:
   global-service-coordinator (PID: 13296, uptime: 9492m)
   global-lsl-coordinator (PID: 13816, uptime: 9491m)
   vkb-server (PID: 6074, uptime: 858m)
   statusline-health-monitor (PID: 39770, uptime: 1m)

Project Services:
   /Users/q284340/Agentic/coding:
     enhanced-transcript-monitor (PID: 40417, uptime: 0m)
Performance Metrics
Resource Usage
| Metric | Value |
|---|---|
| Memory per Monitor | ~5-15MB |
| CPU Usage | <1% per monitor during normal operation |
| Disk I/O | Minimal (health file updates every 15 seconds) |
| Network | None (local file system only) |
Scalability
| Metric | Value |
|---|---|
| Supported Sessions | Unlimited (tested with 10+ concurrent sessions) |
| Discovery Time | <100ms for session discovery |
| Recovery Time | <5 seconds for auto-recovery |
| StatusLine Update | Real-time (sub-second updates) |
Troubleshooting
Common Issues
"Level DB is locked by another process"
# Check what's holding the lock
lsof .data/knowledge-graph/LOCK

# Stop VKB server
vkb server stop

# Or kill the process
kill <PID>
Sessions Not Appearing in StatusLine
- Check Global LSL Registry: Verify project is registered
- Check Claude Transcript Directory: Ensure session has active transcript
- Verify Monitor Process: Check if transcript monitor is running
Auto-Recovery Not Working
- Check Coordinator PID: Verify coordinator process is current
- Check Health Check Interval: Ensure health checks are running
- Manual Recovery:
node scripts/global-lsl-coordinator.js health-check
Health Check Commands
# Verify all components are working
node scripts/statusline-health-monitor.js --verify

# Test session discovery
node scripts/statusline-health-monitor.js --discover

# Check auto-recovery status
node scripts/global-lsl-coordinator.js status

# Check all process health
ps aux | grep -E "(transcript-monitor|global-lsl-coordinator)"