Observational Memory
The system notices what you do, distils it daily, and turns the durable parts into project knowledge.
Three tiers
| Tier | What | When | Volume |
|---|---|---|---|
| Observations | Per-exchange summaries — intent, approach, artifacts, result | Real time | ~30/day |
| Digests | Daily thematic summaries of a work session | End of day | ~7/day |
| Insights | Persistent project knowledge | Weekly, or after ≥5 new digests | ~10 total |
Each tier is a compression of the one below it. Nothing is promoted for being recent — only for surviving the distillation.
Where it lives
The runtime store is km-core's graph store at .data/knowledge-graph/, with git-tracked JSON exported to .data/observation-export/ so knowledge travels with the repository.
The observations API is on port 12436.
Historical note when reading the Deep tier
Sections describing SQLite, WAL mode and single-owner corruption recovery are historical. All four writer, consolidator, pruner and retrieval surfaces are km-core-native now; that prose is kept for context, not as current behaviour.
Seeing it
The dashboard's memory tiers let you browse observations, digests and insights, and the same material is what gets injected into later sessions.
Why a hierarchy rather than a log
Raw observations are too numerous and too specific to be useful later — thirty a day, each about one exchange. Digests compress a day into themes. Insights keep only what stayed true across days.
The value is in the discarding. A system that kept everything would retrieve everything, and retrieval that returns everything is the same as no retrieval.
Promotion is by survival, not recency: an insight exists because the pattern behind it kept recurring, which is a much stronger signal than having happened lately.
What is captured
Each observation is structured rather than free text — intent, approach, artifacts, result — so that later consolidation has fields to work with instead of prose to re-parse. All four agents feed it.
Storage, and what the Deep tier says about it
The runtime store is the km-core graph store at .data/knowledge-graph/. Git-tracked JSON under .data/observation-export/ is what makes the knowledge portable between machines, mirroring the pattern the knowledge base uses.
The Deep tier below contains substantial material about SQLite, WAL mode, single-owner access and corruption recovery. That describes historical behaviour: the SQLite store was archived once the writer, consolidator, pruner and retrieval paths all moved to km-core. It is retained because it explains why several current design choices exist, not because it describes what runs today.
The API
The observations API on port 12436 is also the only mount point for km-core's shared REST surface, under /api/km/. That makes this system the first consumer of the three-system km-core architecture rather than a separate store that happens to look similar.
How this reaches your prompts
Observations, digests and insights are all retrievable tiers at injection time, weighted differently — insights rank above digests, which rank above raw observations. See Knowledge Context Injection for how the selection and budgeting work.
Real-time observation capture from live coding sessions across all agents, with LLM-powered summarization, consolidation into daily digests, and synthesis into persistent project insights. Inspired by Mastra's Observer/Reflector memory hierarchy, adapted for cross-agent project knowledge management.
2026-06-05 update (Phase 44 Plan 18): the runtime store is the km-core
GraphKMStore(.data/knowledge-graph/). The SQLite file at.observations/observations.dbwas archived to.observations/observations.db.archived.2026-06-05once Plan 44-18 Tasks 1-4 cut Pruner + RetrievalService freshness-rerank to km-core (commitscf6c8da45→c837dc421). All four writer/consolidator/pruner/retrieval surfaces are now km-core-native. SQLite-WAL, single-owner, and corruption-recovery references below describe historical behavior preserved for context; current writes and reads flow through km-core only.
Overview
Observational Memory implements a three-tier memory hierarchy:
| Tier | What | Trigger | Volume |
|---|---|---|---|
| Observations | Per-exchange structured summaries (Intent/Approach/Artifacts/Result) | Real-time, per prompt-set | ~30/day |
| Digests | Daily thematic work session summaries | End of day (cron or manual) | ~7/day |
| Insights | Persistent project knowledge | Weekly or >= 5 new digests | ~10 total |
The system uses SQLite (.observations/observations.db) as its runtime store and exports git-tracked JSON to .data/observation-export/ for cross-machine portability — mirroring the UKB knowledge-export pattern.
The observations API is also the only mount point for the shared createKMRouter() REST surface from @fwornle/km-core, exposed at /api/km/ on port 12436. This makes Observational Memory the System A consumer in the three-system km-core architecture.

Architecture
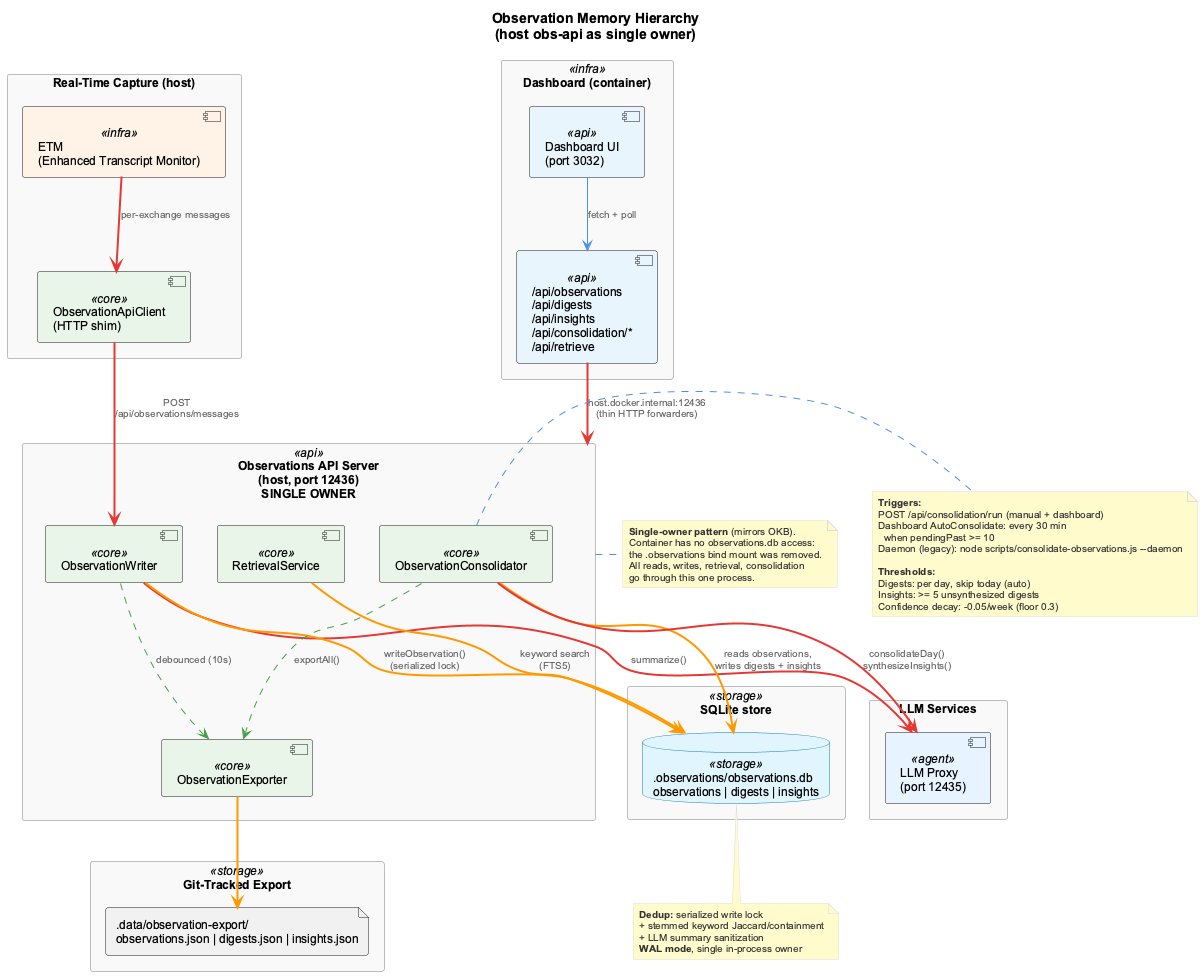
Single-owner architecture
The runtime DB has exactly one owner: a host process called the Observations API server (scripts/observations-api-server.mjs, port 12436). Every other consumer — the transcript monitor, the dashboard inside the coding-services container, the consolidator, the retrieval pipeline — reaches observations.db exclusively through this HTTP service. The .observations directory is not bind-mounted into the container.
This eliminates the classic SQLite-on-Docker-Desktop-Mac corruption pattern where concurrent processes (host writer + container reader) lose WAL/SHM coherence across the bind-mount boundary, producing periodic observations.db.corrupted-* files. Pattern mirrors the OKB/VKB approach: one writer, everyone else over HTTP.
Components
| Component | Location | Role |
|---|---|---|
| Observations API server | scripts/observations-api-server.mjs | Host service (port 12436). Single owner of observations.db. Hosts ObservationWriter, ObservationConsolidator, RetrievalService in-process |
| ObservationWriter | src/live-logging/ObservationWriter.js | Summarizes exchanges via LLM proxy, writes to SQLite with dedup. Runs inside the obs-api server |
| ObservationConsolidator | src/live-logging/ObservationConsolidator.js | Consolidates observations into digests and insights via LLM. Runs in-process inside the obs-api server |
| RetrievalService | src/retrieval/retrieval-service.js | Keyword + semantic + RRF retrieval. Runs in-process inside the obs-api server |
| ObservationExporter | src/live-logging/ObservationExporter.js | Git-friendly JSON export to .data/observation-export/ |
| ObservationApiClient | src/live-logging/ObservationApiClient.js | Thin HTTP shim used by the transcript monitor (replaces direct SQLite access) |
| ETM Observation Tap | scripts/enhanced-transcript-monitor.js | Fires observations per prompt-set via the API client (fire-and-forget) |
| Consolidation CLI | scripts/consolidate-observations.js | Legacy stand-alone CLI/daemon. The dashboard's POST /api/consolidation/run no longer spawns it — consolidation runs in-process inside the obs-api server |
| Health API (dashboard) | integrations/system-health-dashboard/server.js | Container service (port 3033). Now a thin HTTP forwarder to the host obs-api for all observation/digest/insight/retrieve/consolidation calls |
| Dashboard UI | integrations/system-health-dashboard/src/pages/ | Browsable views: observations, digests, insights |
| LLM Proxy Bridge | @rapid/llm-proxy | Routes summarization to subscription providers (port 12435) |
Observation Pipeline
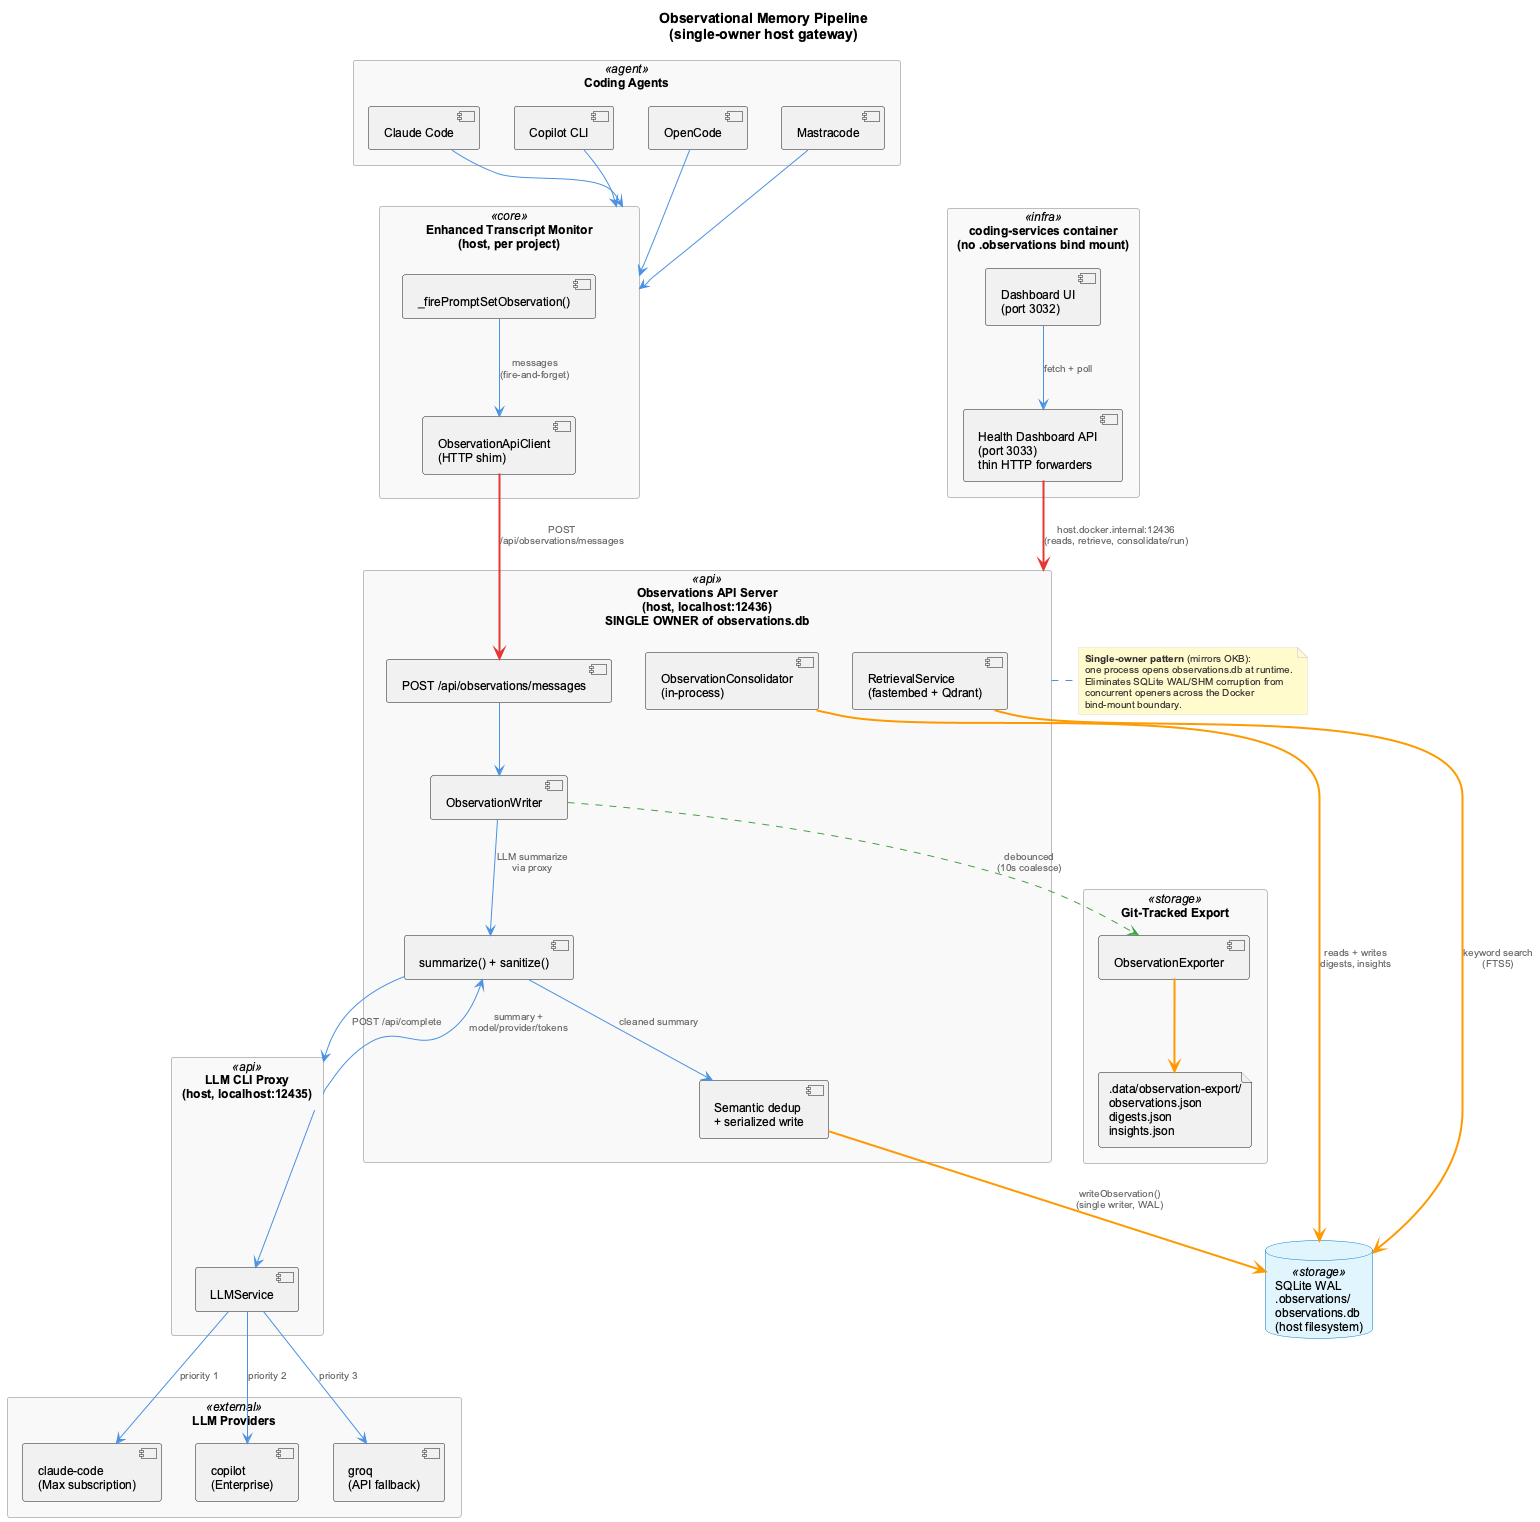
- Exchange completed -- the ETM detects a completed prompt set (user + assistant exchanges)
- Fire-and-forget over HTTP --
_firePromptSetObservation()callsObservationApiClient.processMessages(), whichPOSTs/api/observations/messagesto the host obs-api onlocalhost:12436(never awaited, never blocks LSL) - LLM summarization -- inside the obs-api,
ObservationWritercalls the LLM proxy to generate a structured summary (Intent/Approach/Artifacts/Result) - Summary sanitization --
_sanitizeSummary()strips unfilled template placeholders and LLM self-correction artifacts - Serialized write --
_serializedWrite()acquires a promise-chain lock to prevent TOCTOU races between concurrent calls - Dedup check -- content hash + semantic keyword similarity (Jaccard + containment) against a 4-hour sliding window
- Storage -- observation written to SQLite with metadata (agent, project, LLM model/provider, tokens). The obs-api holds the only RW handle in the system
- JSON export -- debounced (10s coalesce) export to
.data/observation-export/observations.json - Dashboard -- the dashboard inside the container forwards
/api/observations*to the host obs-api athost.docker.internal:12436; it never opens SQLite directly
Supported Agents
All four agents generate observations:
| Agent | Method | Project Detection |
|---|---|---|
| Claude Code | ETM transcript monitoring | path.basename(projectPath) |
| GitHub Copilot | ETM pipe-pane capture | path.basename(projectPath) |
| OpenCode | ETM pipe-pane capture | path.basename(projectPath) |
| Pi | ETM reads pi's native session JSONL | path.basename(projectPath) |
Dashboard Features
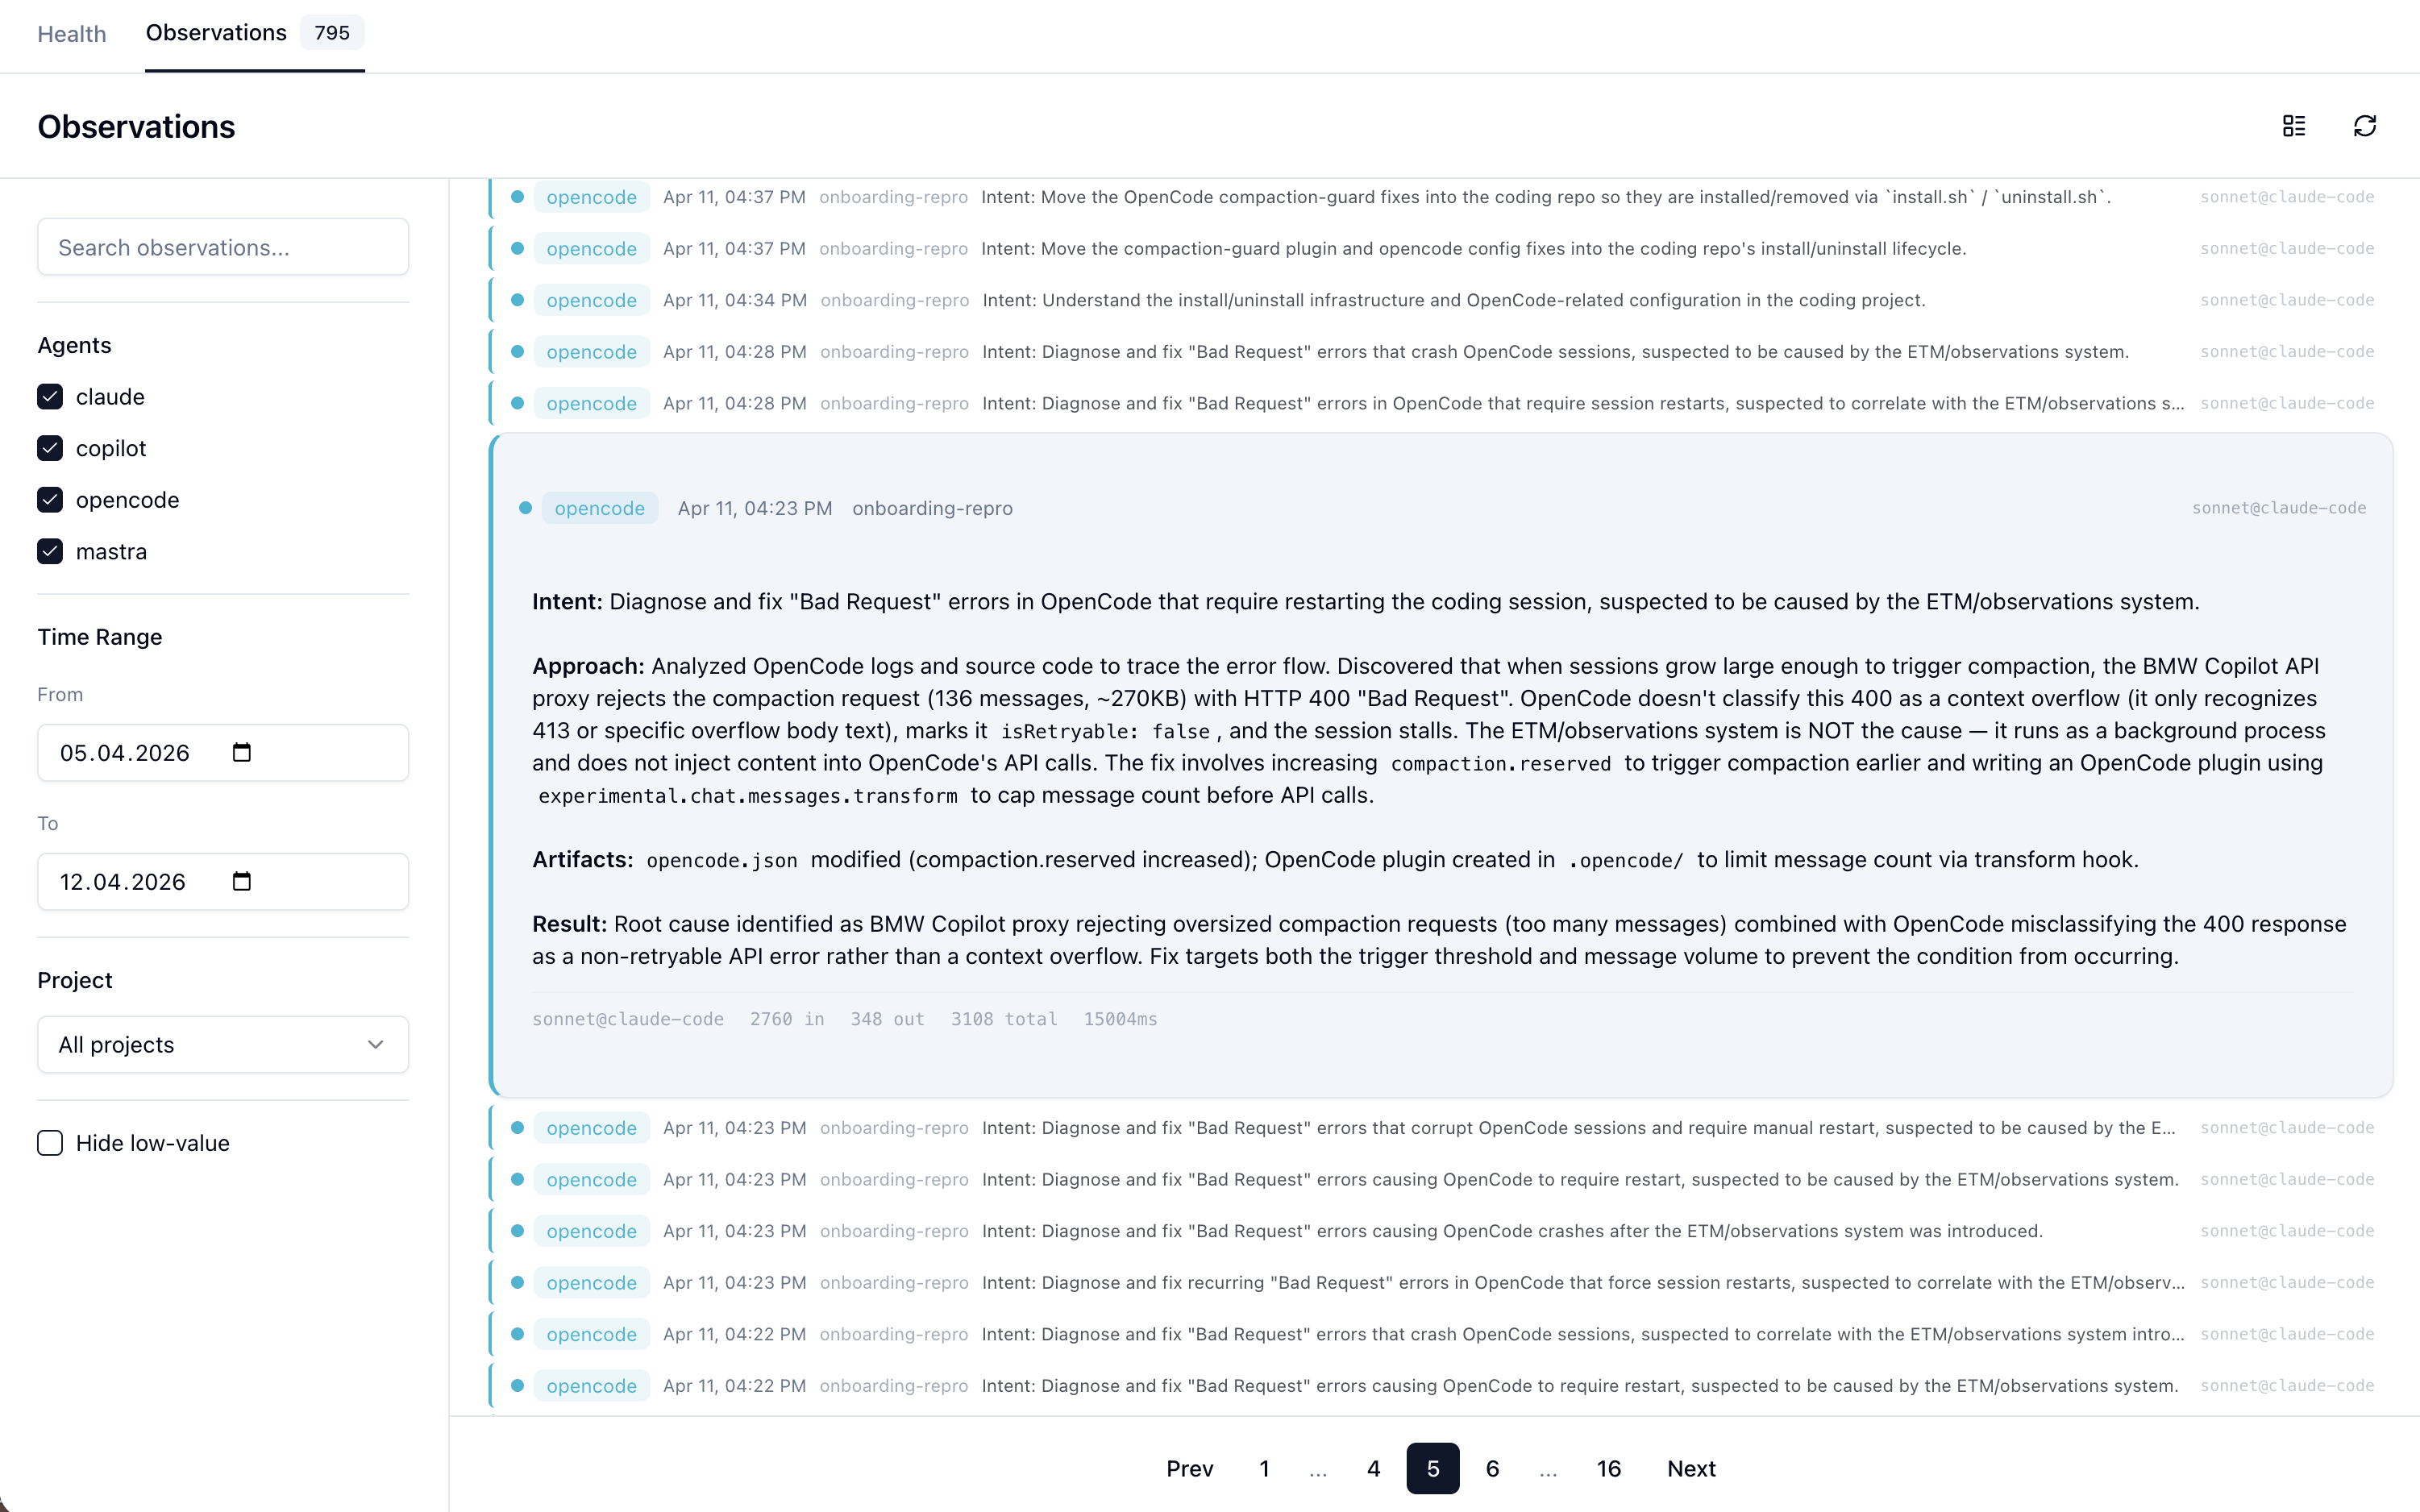
Access at http://localhost:3032/observations.
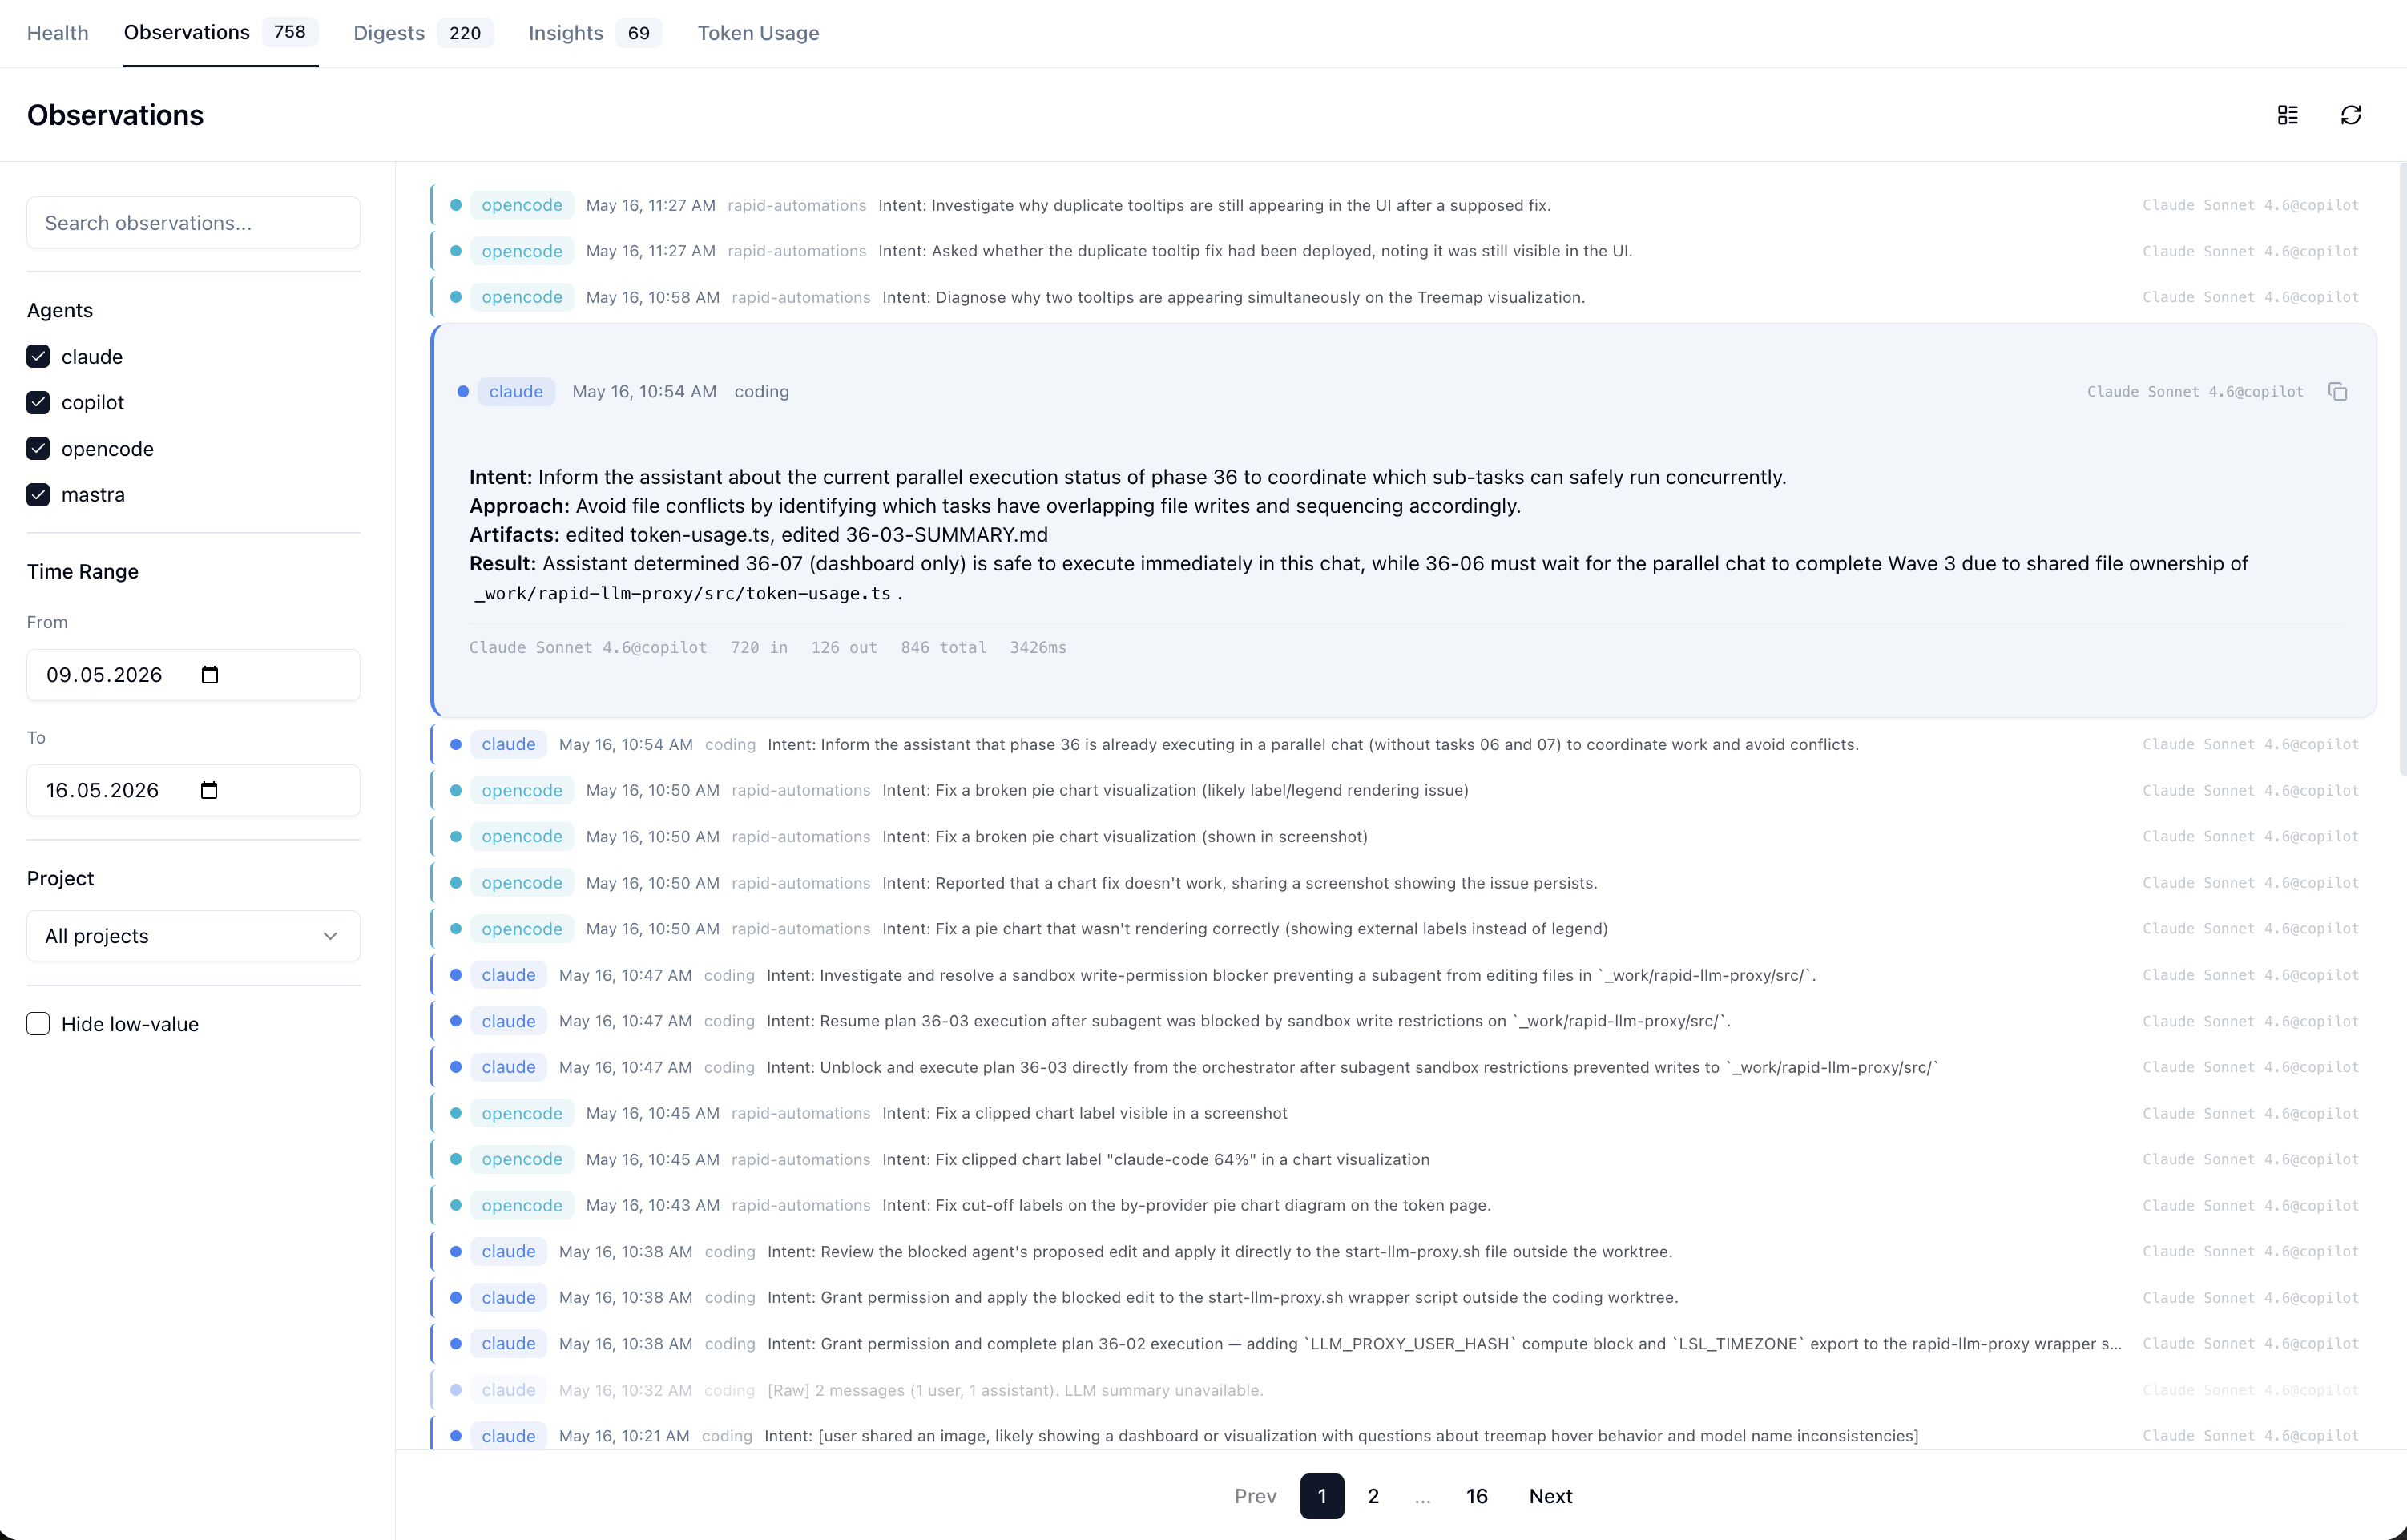
- Agent filter -- checkbox per agent (claude, copilot, opencode, pi)
- Time range -- date pickers for from/to
- Project filter -- dropdown of projects with observations
- Full-text search -- FTS5 search across observation summaries
- Compact view -- toggle for single-line rows (high density)
- Hide low-value -- filters out "No actionable content" observations
- LLM metadata -- each card shows
model@providerand token counts when expanded - Markdown rendering -- bold, headers, inline code rendered in expanded view
- ESC / click-outside -- closes expanded observation cards
- Redaction tokens styled inline -- markers like
<USER_ID_REDACTED>,<AWS_SECRET_REDACTED>,<COMPANY_NAME_REDACTED>are rendered as smaller, sky-blue spans so they don't dominate the surrounding text. The same styling applies on the digests and insights pages
Per-project consolidation
Phases B/C/D (Apr 26) made the consolidation pipeline project-aware end-to-end:
- Observations carry a
projectcolumn populated by the LSL classifier ObservationConsolidatorpartitions observations by project before LLM grouping, so a session that touched two projects produces two digests (one per project) rather than a cross-project blend- Insight synthesis runs per project — an insight from project B can no longer contaminate project A's narrative just because it was logged in the same window
- The Digests and Insights pages have a project selector; the API accepts
?project=<name>for filtering
Heartbeat-backed consolidation status
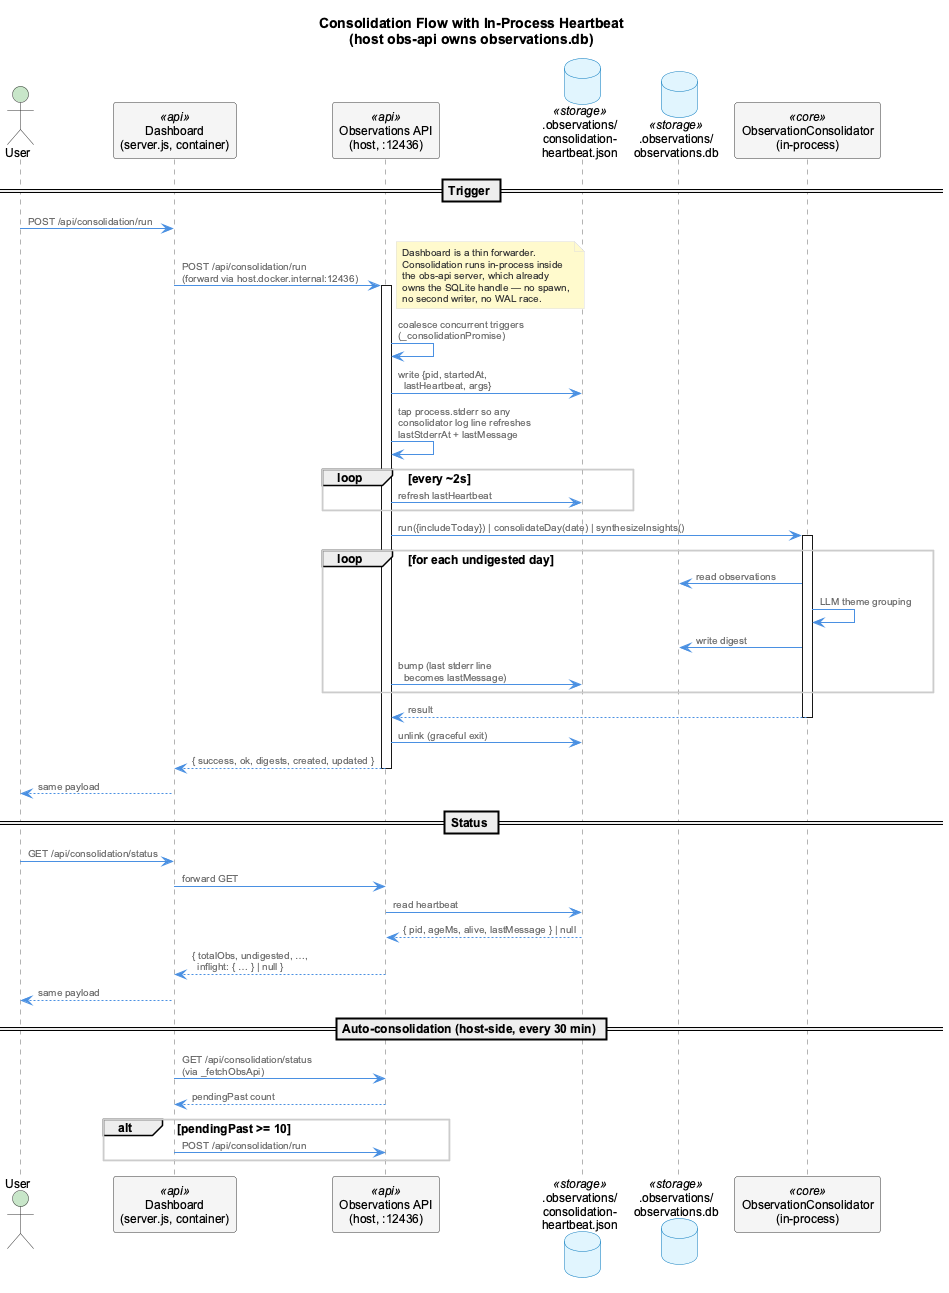
Consolidation now runs in-process inside the host obs-api server rather than as a child process spawned by the dashboard. The obs-api already owns the SQLite handle, so a single in-process call replaces the previous spawn(consolidate-observations.js) flow — no second writer, no WAL race, no orphan-child timeout enforcement to worry about.
The obs-api writes .observations/consolidation-heartbeat.json every ~2 seconds while a run is in flight (any stderr line refreshes it, so the last log message is always exposed as lastMessage). GET /api/consolidation/status returns that heartbeat as inflight: { pid, alive, ageMs, startedAt, lastMessage }. On graceful shutdown the obs-api waits up to 20 s for the in-flight run to drain.
Concurrent triggers are coalesced — a second POST /api/consolidation/run while one is in flight attaches to the same promise instead of starting a new run. The dashboard's POST /api/consolidation/run is a thin HTTP forwarder; the dashboard's auto-consolidation daemon (every 30 min when pendingPast >= 10) likewise forwards rather than spawning.
Mixed-topic safeguard in the knowledge graph
The wave-analysis pipeline writes online-learned entities into the knowledge graph. Earlier the persistence agent's fuzzy name dedup merged entities at Jaccard ≥ 0.7 with no content check, producing nodes like "GSD Statusline and Hook Integration" that bundled a GSD changelog with an LSL tmux indicator description simply because both names contained "hook" and "integration".
Three layers of defence are now in place:
| Gate | What it does | Threshold |
|---|---|---|
| Name match (tightened) | Stop-list of generic words (hook, integration, system, update, health, …) is filtered out before Jaccard; ≥1 shared non-generic word required | 0.85 |
| Content veto | After a name match, observation Jaccard must clear MIN_CONTENT_SIMILARITY before the merge proceeds | 0.15 |
| Mixed-topic detection | At write time, every entity's bullets are pairwise scored. Any pair below 0.10 stamps metadata.mixed_topics: true | 0.10 |
The VKB Node Details panel surfaces mixed-topic entities with an amber warning and a count of unrelated observation pairs, so they can be reviewed and split.
Redaction sanitization
ObservationSanitizer repairs legacy <AWS_SECRET_REDACTED>frag corruption that an over-broad earlier regex left in stored observations. It uses sibling fields/entries as a recovery oracle (e.g. when a modifiedFiles list contains both server.js and <AWS_SECRET_REDACTED>er.js, the basename match restores the path). Active code paths run the sanitizer before persisting; a one-time DB sweep is available via scripts/sanitize-observations.js.
The matching redaction pattern fix landed in redaction-patterns.json: aws_secret_standalone now uses lookarounds — a negative lookbehind and lookahead around [A-Za-z0-9+/]{40} — so a 40-char run inside a longer base64-like path can't be eaten as a "secret" anymore.
LLM Provider Routing
Summarization uses the LLM CLI proxy (localhost:12435) which routes through subscription providers with automatic fallback:
- claude-code (Max subscription, zero cost, ~15s via CLI)
- copilot (Enterprise subscription, zero cost, ~2-5s via HTTP)
- groq (API fallback, fast, low cost)
- Anthropic, OpenAI, Gemini (paid API fallback)
The proxy tracks provider health and automatically falls back to the next available provider on failure. Providers that fail 3 times consecutively enter a 1-minute cooldown. Per-provider timeouts (30s) prevent a hung provider from burning the entire request budget.
The provider priority is configured in config/llm-providers.yaml.
Transcript Converters
Historical transcripts can be batch-converted into observations:
# Convert Claude JSONL transcripts
node scripts/convert-transcripts.js claude path/to/transcript.jsonl

# Convert Copilot events
node scripts/convert-transcripts.js copilot path/to/events.jsonl

# Batch convert .specstory files (with manifest idempotency)
node scripts/convert-transcripts.js specstory
Database
SQLite database at .observations/observations.db with WAL mode and busy_timeout=5000ms. The host obs-api server is the only process that opens this file at runtime — concurrent in-process connections (writer, consolidator, retrieval) coexist safely under WAL because they share the same SQLite shared memory. The Docker container has no access to the file (the .observations bind mount was removed).
Observations table:
CREATE TABLE observations (
  id TEXT PRIMARY KEY,
  summary TEXT,
  messages TEXT,        -- JSON array of original messages
  agent TEXT,           -- claude, copilot, opencode, pi
  session_id TEXT,
  source_file TEXT,
  created_at TEXT,      -- ISO 8601
  metadata TEXT,        -- JSON: project, llmModel, llmProvider, llmTokens, etc.
  content_hash TEXT,    -- MD5 for dedup
  quality TEXT,         -- high, normal, low
  digested_at TEXT      -- set when consolidated into a digest
);
Digests table:
CREATE TABLE digests (
  id TEXT PRIMARY KEY,
  date TEXT NOT NULL,              -- YYYY-MM-DD
  theme TEXT NOT NULL,             -- e.g. "Dashboard observations frontend fix"
  summary TEXT NOT NULL,           -- consolidated narrative
  observation_ids TEXT NOT NULL,   -- JSON array of source observation IDs
  agents TEXT,                     -- JSON array of agents involved
  files_touched TEXT,              -- JSON array of files modified
  quality TEXT DEFAULT 'normal',
  created_at TEXT NOT NULL,
  metadata TEXT
);
Insights table:
CREATE TABLE insights (
  id TEXT PRIMARY KEY,
  topic TEXT NOT NULL,             -- e.g. "ETM Architecture"
  summary TEXT NOT NULL,           -- living knowledge document
  confidence REAL DEFAULT 0.8,    -- decays -0.05/week, floor 0.3
  digest_ids TEXT NOT NULL,        -- JSON array of source digest IDs
  last_updated TEXT NOT NULL,
  created_at TEXT NOT NULL,
  metadata TEXT
);
Git-Tracked JSON Export
The observation system exports human-readable JSON to .data/observation-export/ for git tracking, mirroring the UKB knowledge-export pattern. This provides cross-machine portability, backup, and diff-friendly change history.
Exported Files
| File | Content | Excludes |
|---|---|---|
observations.json | Structured summaries with agent, project, quality, LLM metadata, modified files | Raw messages column (bulk exchange data) |
digests.json | Daily thematic digests with observation IDs, agents, files touched | -- |
insights.json | Persistent project insights with confidence scores and digest IDs | -- |
metadata.json | Export timestamp and counts | -- |
Export Triggers
| Trigger | When | What |
|---|---|---|
| ObservationWriter | After each writeObservation() | Debounced 10s coalesce — exports observations.json only |
| ObservationWriter close | On close() | Immediate flush of pending export |
| ObservationConsolidator | After each run() | Full exportAll() — all three tiers + metadata |
Comparison with UKB Knowledge Export
| Aspect | UKB (knowledge-export/) | Observations (observation-export/) |
|---|---|---|
| Runtime store | Graphology + LevelDB | SQLite (WAL mode) |
| Export format | {team}.json with entities + relations | Separate files per tier |
| Export trigger | entity:stored event | After write (debounced) / after consolidation |
| Git location | .data/knowledge-export/ | .data/observation-export/ |
| Skip unchanged | Yes | Yes (content comparison before write) |
Configuration
ObservationWriter config
.observations/config.json:
{
  "defaults": {
    "model": "anthropic/claude-haiku-4-5",
    "observation": { "messageTokens": 20000, "bufferTokens": 0.2 }
  },
  "agents": {
    "claude": { "model": "groq/llama-3.3-70b-versatile" },
    "opencode": { "model": "anthropic/claude-haiku-4-5" },
    "pi": { "model": "anthropic/claude-haiku-4-5" }
  }
}
LLM provider priority
config/llm-providers.yaml -- provider_priority section controls which provider handles summarization.
Deduplication
Observations are deduplicated at multiple levels before storage:
- Write serialization: A promise-chain lock (
_serializedWrite) prevents concurrent fire-and-forget calls from racing past the dedup check (TOCTOU prevention). LLM summarization runs concurrently; only the dedup-check + DB-write is serialized. - Content hash: MD5 of
sessionId|userContent|assistantContent-- identical exchanges are rejected - Semantic dedup: Stemmed keyword similarity (Jaccard > 0.4 or containment > 0.7) against a 4-hour sliding window of the last 50 observations per agent. Synonymous verbs are canonicalized (debug/diagnose/investigate ->
debug, showing/displaying/appearing ->show) and stop words stripped before comparison - Summary sanitization:
_sanitizeSummary()detects unfilled LLM template placeholders ([what the developer...]) and self-correction artifacts (multipleIntent:blocks) -- discards or cleans the output before storage - Trivial filter: observations containing "trivial exchange" or "no actionable content" are skipped entirely
- WAL mode + single owner: SQLite WAL mode +
busy_timeout=5000msplus the single-owner host gateway eliminates the cross-process WAL/SHM coherence issues that previously caused periodicobservations.db.corrupted-*files
Consolidation Pipeline
The consolidation pipeline aggregates fine-grained observations into two higher-level memory tiers: digests (daily thematic summaries) and insights (persistent project knowledge).
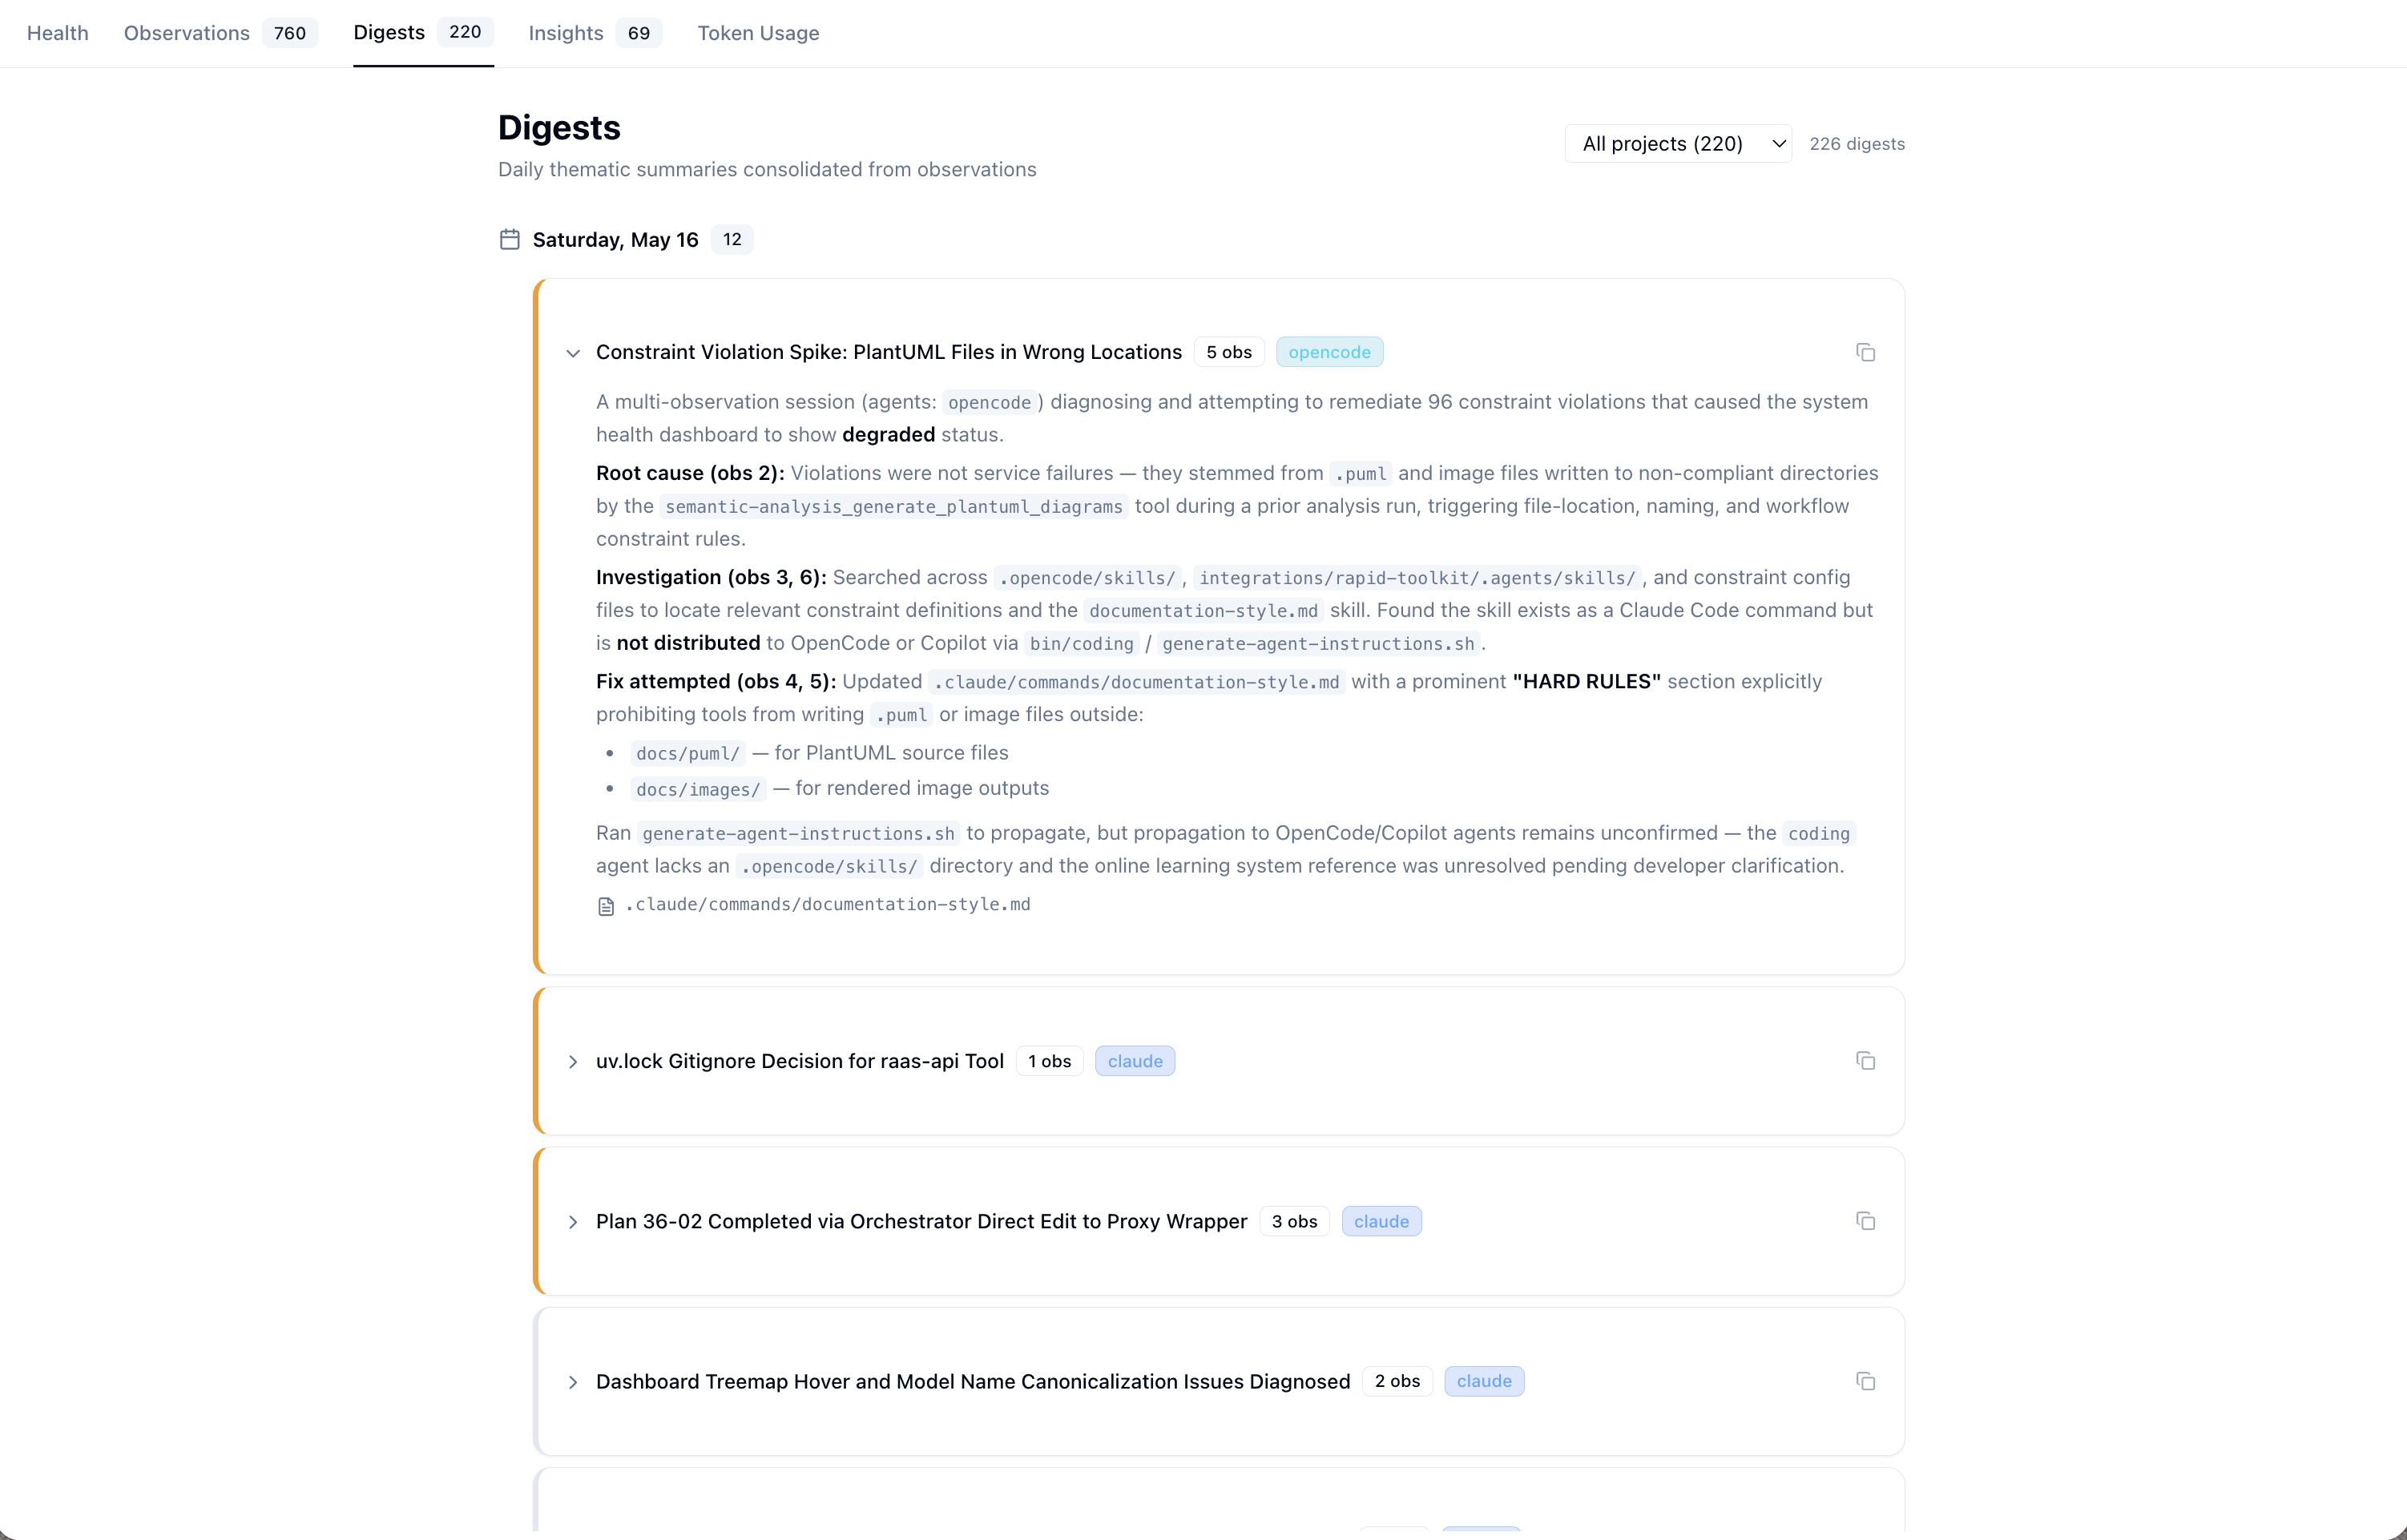
Digests (Tier 2)
Digests group same-day observations by cognitive topic and produce consolidated narratives.
Trigger: End of day via cron (--daemon mode at 02:00), manual run, or dashboard "Consolidate" button. The daemon skips today's observations (still being written); manual triggers include today via includeToday: true.
Process:
- Query undigested observations for a given date (excluding low-quality)
- Chunk into batches of 35 (avoids LLM timeouts on large days)
- LLM groups by theme, merges narratives, extracts files touched
- Write digest entries and mark source observations as
digested_at
Output: Thematic summaries like "ETM pollCount Hardening and Dead Code Removal" or "Frontend Dashboard Observations Display Debugging", each linking back to their source observation IDs.
Insights (Tier 3)
Insights extract persistent project knowledge from accumulated digests.
Trigger: When >= 5 unsynthesized digests exist.
Process:
- Load all unsynthesized digests + existing insights for context
- Chunk into batches of 30 digests per LLM call
- LLM produces structured reference articles per topic — each with Purpose, Architecture, Key Files, Usage, and Troubleshooting sections — optimized for context-priming injection into a reserved 2K token window
- Existing insights with matching topics are updated (merged), new topics create new entries
- Confidence decay: -0.05 per week of inactivity, floor at 0.3
Output: Structured reference articles like "Enhanced Transcript Monitor (ETM) Architecture and Known Failure Modes" (confidence: 0.95) — each a self-contained knowledge document rather than a changelog.
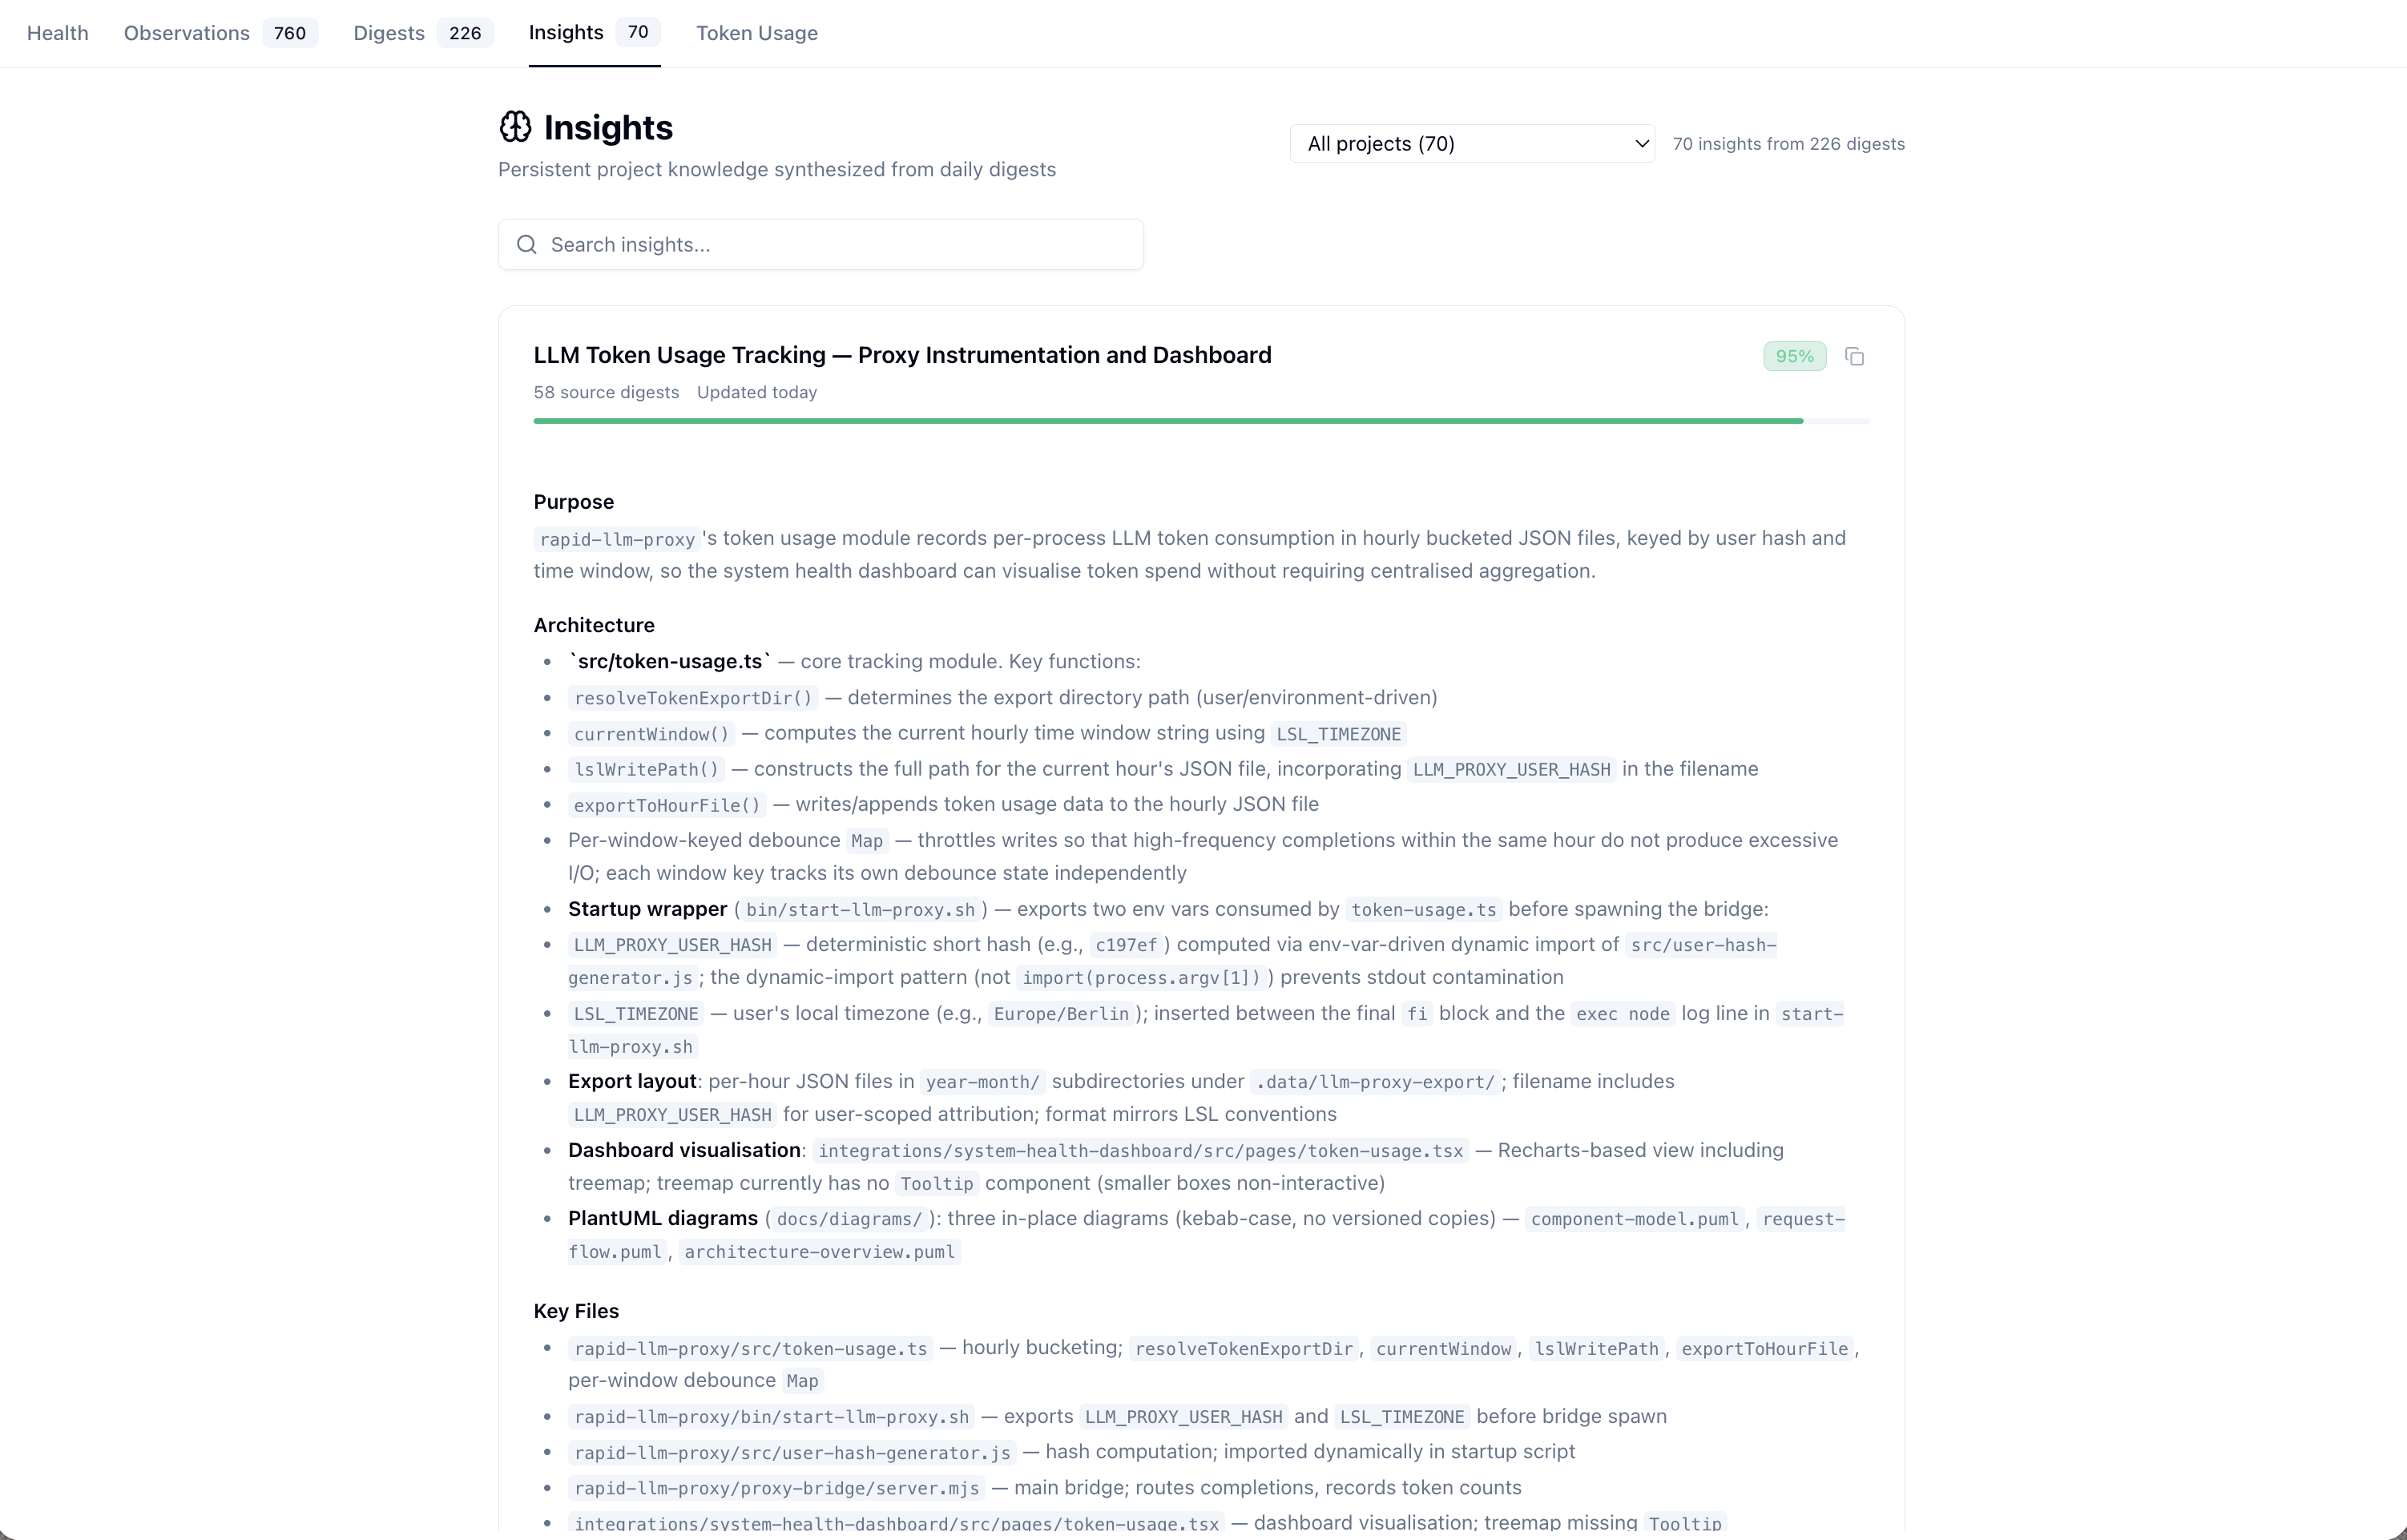
Insights are now generated as structured reference articles with ## Purpose, ## Architecture, ## Key Files, ## Usage, and ## Troubleshooting sections — optimized for context-priming injection rather than changelog-style summaries.
Truthfulness and Project Coverage
Insights age. A file gets renamed, a function disappears, a route moves — and the LLM-synthesized prose that referenced it silently rots. The verifier (scripts/verify-insight-claims.mjs, backed by ObservationConsolidator.verifyInsight) extracts every backticked code claim from an insight summary and checks each against the live codebase. The dashboard surfaces the result.
What is verified. A "claim" is anything in backticks — file paths, function names (funcName()), environment variables (LLM_TIMEOUT), HTTP routes (GET /api/...), and scoped packages (@scope/name). Each is resolved against:
- the project repo itself
- every submodule of it (so
integrations/operational-knowledge-management/viewer/...resolves) - sibling
_work/*checkouts (so cross-repo claims like_work/rapid-llm-proxy/...resolve)
Paths use filesystem existence with a path-suffix fallback (handles insights written relative-to-subproject). Symbols, routes, env vars, and packages use git grep -F. The verifier re-runs every 7 days on a cadence guard; on-demand via the CLI script.
Bands. verificationRatio = verifiedClaims / totalClaims is bucketed:
| Band | Ratio | Pill colour | Consequence |
|---|---|---|---|
| FRESH | ≥ 0.70 | emerald | full retrieval weight |
| PARTIAL | 0.50 – 0.70 | amber | retrieval rrfScore *= 0.3 + 0.7 × ratio for insight tier |
| STALE | < 0.50 | rose | additional one-shot confidence penalty up to -0.20 (floor 0.30); cleared on recovery |
Where you see this in the dashboard. The Insights page now renders a FRESH N% / PARTIAL N% / STALE N% pill next to the confidence pill on every insight card. Below the summary, a collapsible Truthfulness panel lists each stale claim by type (PATH, FUNCTION, ROUTE, …) so you can fix the insight or the underlying code. The freshness pill and the confidence pill are orthogonal — confidence is "how strongly was this supported at synthesis time, decayed since", freshness is "does what it says still exist".
The new Coverage tab aggregates this per project: a tile grid (one tile per insight, sorted stalest-first, colour = ratio), aggregate FRESH/PARTIAL/STALE counts, distinct files referenced across all insights (metadata.codeVerification.referencedFiles), and component coverage against a hardcoded taxonomy with aliases — so e.g. LiveLoggingSystem is satisfied by mentions of "LSL", "transcript monitor", or "specstory". Tiles are deep-links: clicking one navigates to /insights#insight-<uuid>, which scrolls the target card into view and briefly highlights it.
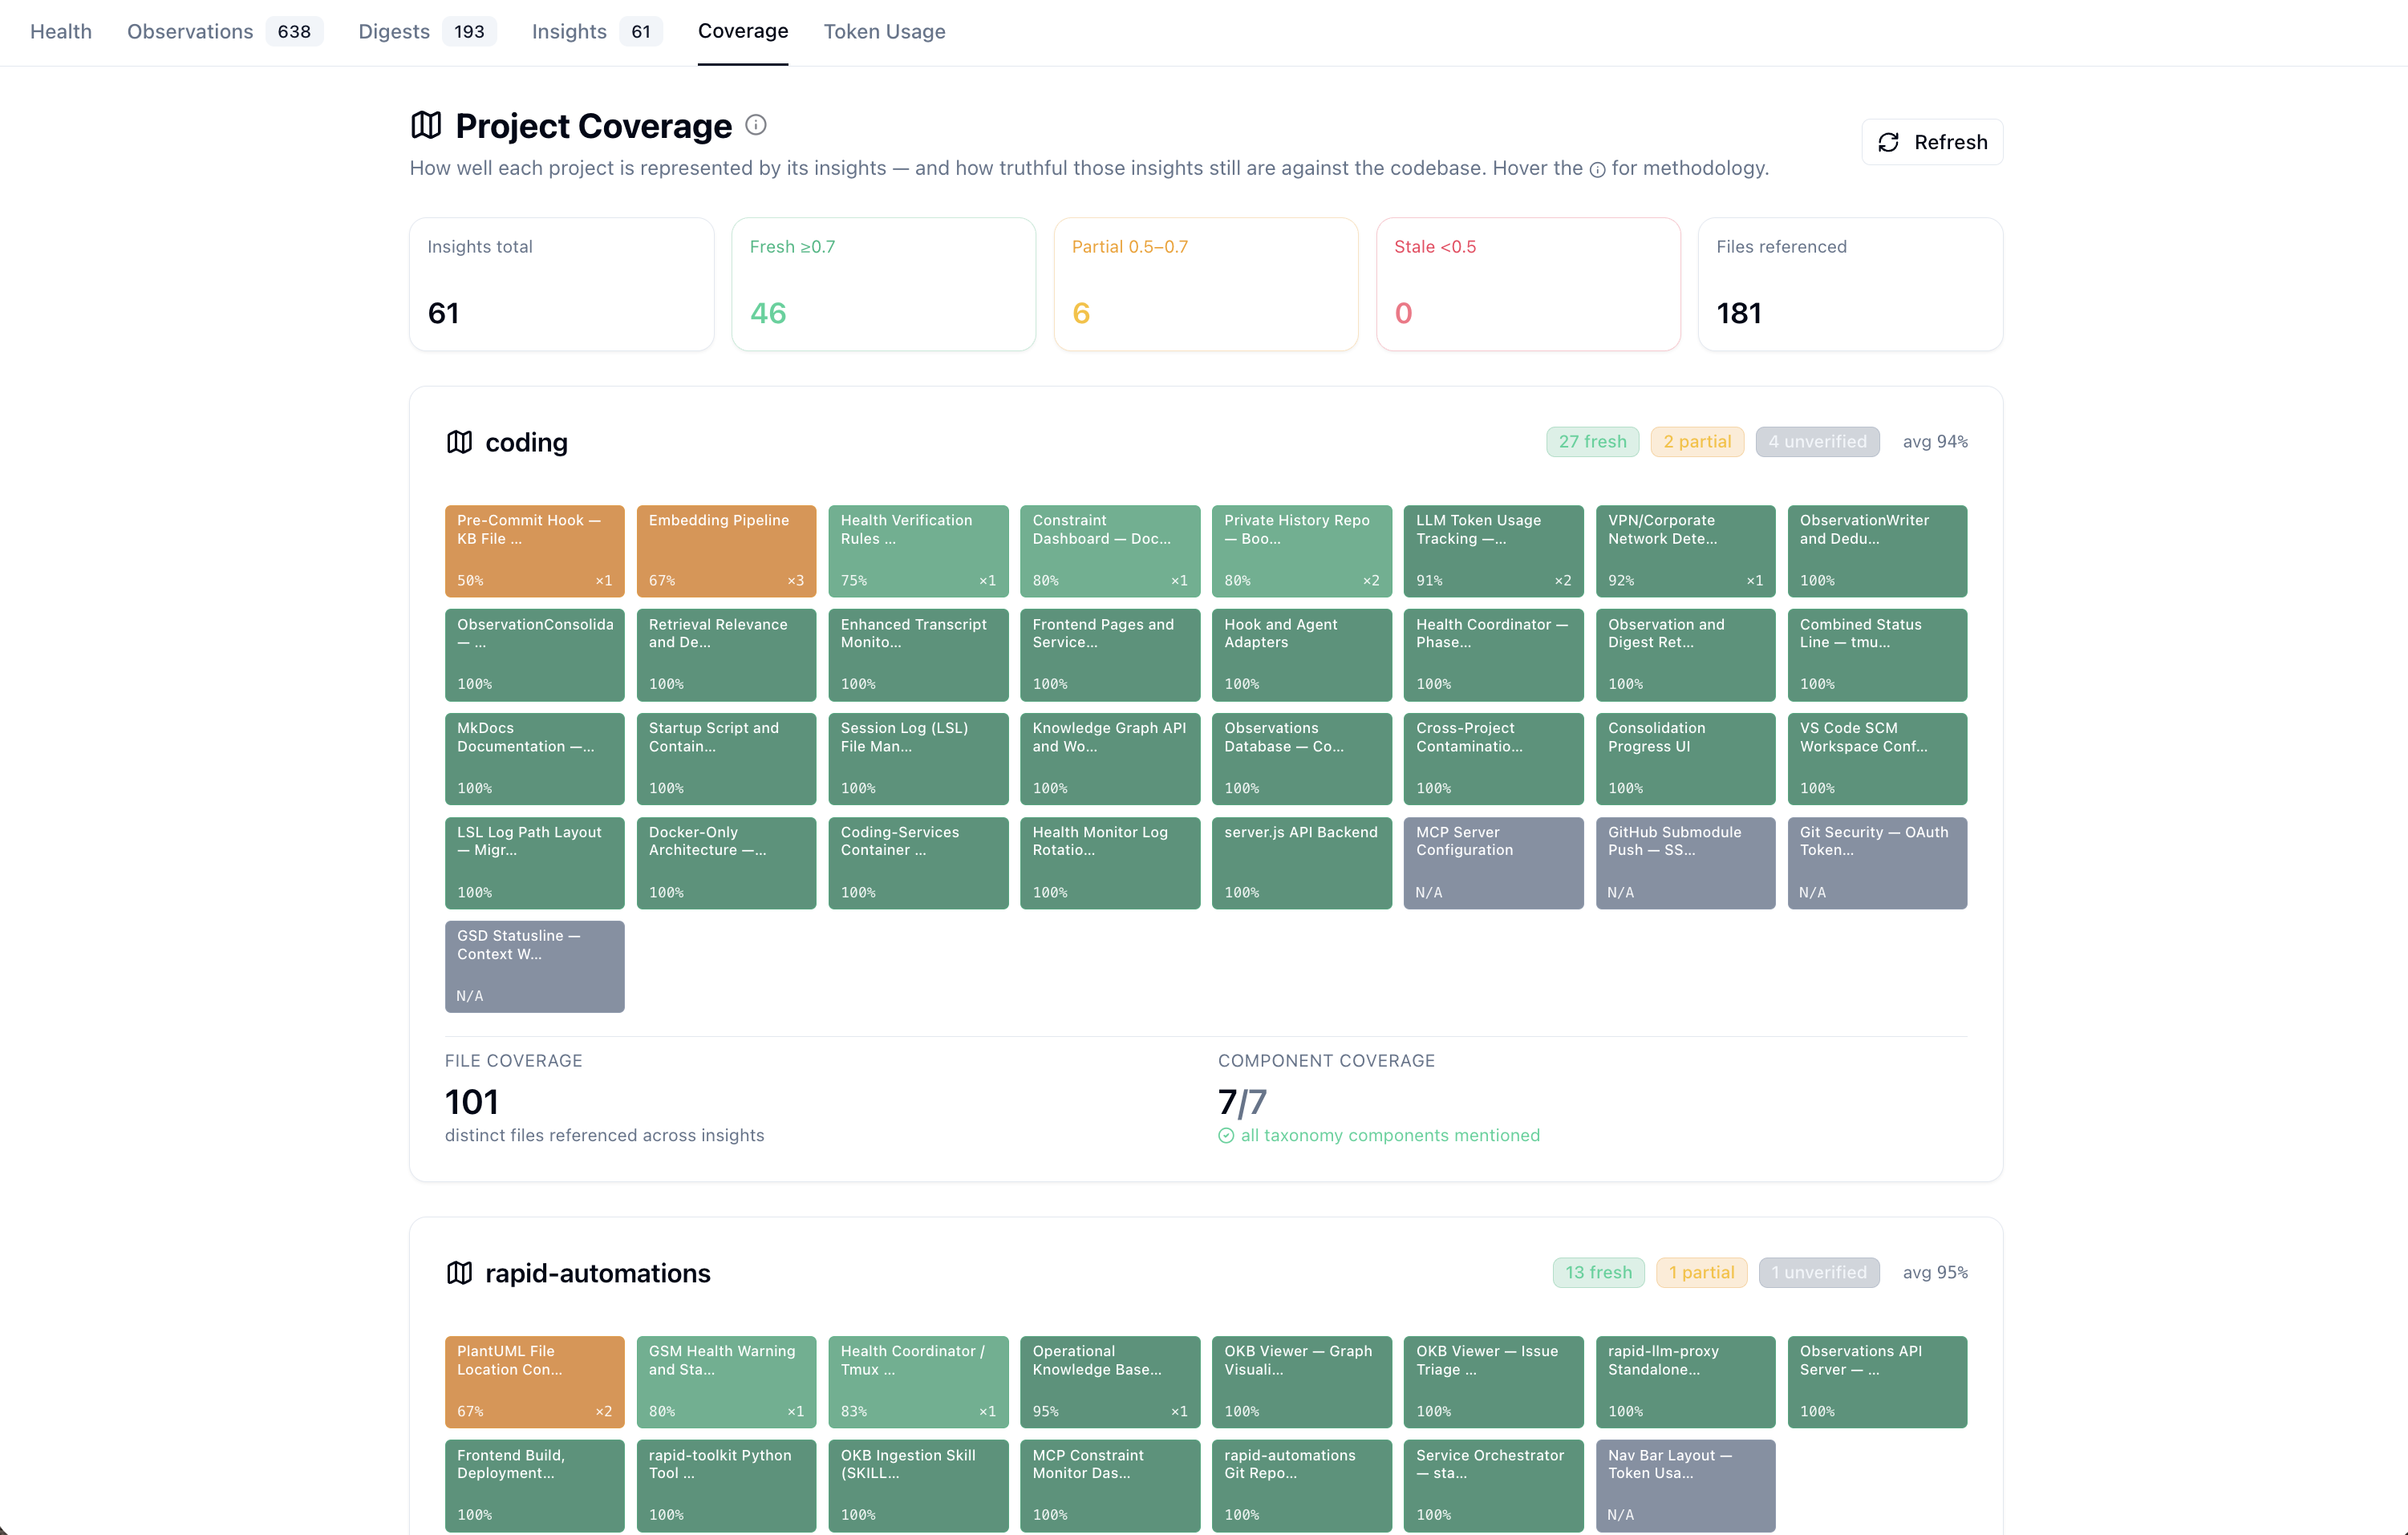
API. GET /api/projects/:project/coverage (exposed on both localhost:12436 and the dashboard's localhost:3033) returns:
{
  "project": "coding",
  "insights":  { "total": 33, "fresh": 31, "partial": 2, "stale": 0, "unverified": 0, "avgRatio": 0.95 },
  "coverage":  { "filesReferenced": 101, "componentsMentioned": [...], "componentsMissing": [] },
  "perInsight": [ { "id", "topic", "ratio", "totalClaims", "verifiedClaims", "staleClaimCount", "verifiedAt", "referencedFiles", ... } ]
}
Running Consolidation
# One-shot: consolidate all past days + synthesize insights
node scripts/consolidate-observations.js

# Consolidate a specific day
node scripts/consolidate-observations.js --date 2026-04-21

# Synthesize insights only (from existing digests)
node scripts/consolidate-observations.js --insights

# Check status
node scripts/consolidate-observations.js --status

# Daemon mode: run immediately, then daily at 02:00
node scripts/consolidate-observations.js --daemon
API Endpoints
All endpoints below are exposed by both the host obs-api server (localhost:12436) and the in-container dashboard (localhost:3033). The dashboard versions are thin HTTP forwarders to the host.
Observations
| Endpoint | Method | Description |
|---|---|---|
/api/observations | GET | Paginated observations with agent/date/project/quality/FTS filters |
/api/observations/projects | GET | Distinct project names for filter dropdown |
/api/observations/messages | POST | (host only) Process a chunk of raw messages: LLM summarize + dedup + insert. Used by the transcript monitor's ObservationApiClient |
/api/observations/patch-artifacts/recent | POST | (host only) Backfill Artifacts: on recent observations whose summaries still say "Artifacts: none" |
/api/observations/patch-artifacts/historical | POST | (host only) One-time pass over up to 500 historical rows to fix the same condition |
Digests
| Endpoint | Method | Description |
|---|---|---|
/api/digests | GET | Paginated digests with date range and text search |
Insights
| Endpoint | Method | Description |
|---|---|---|
/api/insights | GET | All insights, filterable by topic or text search |
/api/insights/projects | GET | Distinct project names for the insights filter dropdown |
/api/projects/:project/coverage | GET | Per-project truthfulness + coverage summary used by the Coverage tab (see Truthfulness and Project Coverage) |
Consolidation
| Endpoint | Method | Description |
|---|---|---|
/api/consolidation/status | GET | Counts: total obs, undigested, pending past/today, digests, insights |
/api/consolidation/run | POST | Trigger consolidation (optional { date } body). Manual triggers include today's observations. |
Error Recovery
The host obs-api server implements automatic error recovery for the observations database:
- Single persistent handle: the writer keeps one RW connection open for the lifetime of the process; a separate handle is opened per consolidation run via
ObservationConsolidator.init() - Corruption invalidation: when any query fails with "malformed", "corrupt", or "disk I/O", the cached writer is closed via
invalidateDb()and the next request lazily reopens.SafeDatabaseruns an integrity check on open and auto-recovers via SHM/WAL deletion orsqlite3 .dump | sqlite3reimport, with the prior corrupt file preserved asobservations.db.corrupted-<ts> - WAL checkpoint: writer runs
PRAGMA wal_checkpoint(TRUNCATE)periodically and on shutdown - Container resilience: the dashboard's HTTP forwarders return 502 when the host obs-api is unreachable; the SPA surfaces this as a transient error rather than corrupting the cached state