Core Systems
Six systems run behind every session. This is what each one is for and how they feed each other.
The seven systems at a glance
| System | Does | You interact with it via |
|---|---|---|
| Live Session Logging | Records every prompt, tool call and response | Nothing — it is automatic |
| Knowledge Management | Extracts a searchable graph from history and git | semantic, and vkb to browse |
| Observational Memory | Captures observations across all four agents, consolidated into digests and insights | The knowledge base |
| OKB | Cross-repo root-cause analyses and runbooks | Its own viewer |
| Constraints | Blocks a violating tool call before it executes | The dashboard at :3030 |
| Health Monitoring | Supervises services and restarts what dies | coding --health, :3032 |
| Status Line | Live health, cost and logging state | Your tmux bar |
Commands you will actually type
coding --health                                      # is everything up
vkb                                                  # browse the knowledge graph
semantic workflow run wave-analysis --team coding     # refresh that graph
semantic workflow status                              # how far it has got
Logging and constraints need no commands at all — they are hooks and daemons that start with the session.
Reading the room
If the status bar shows red, or coding --health disagrees with what you are seeing, start at Health Monitoring. If a tool call was blocked and you think it should not have been, Constraints explains the rule and the override.
What each system is for
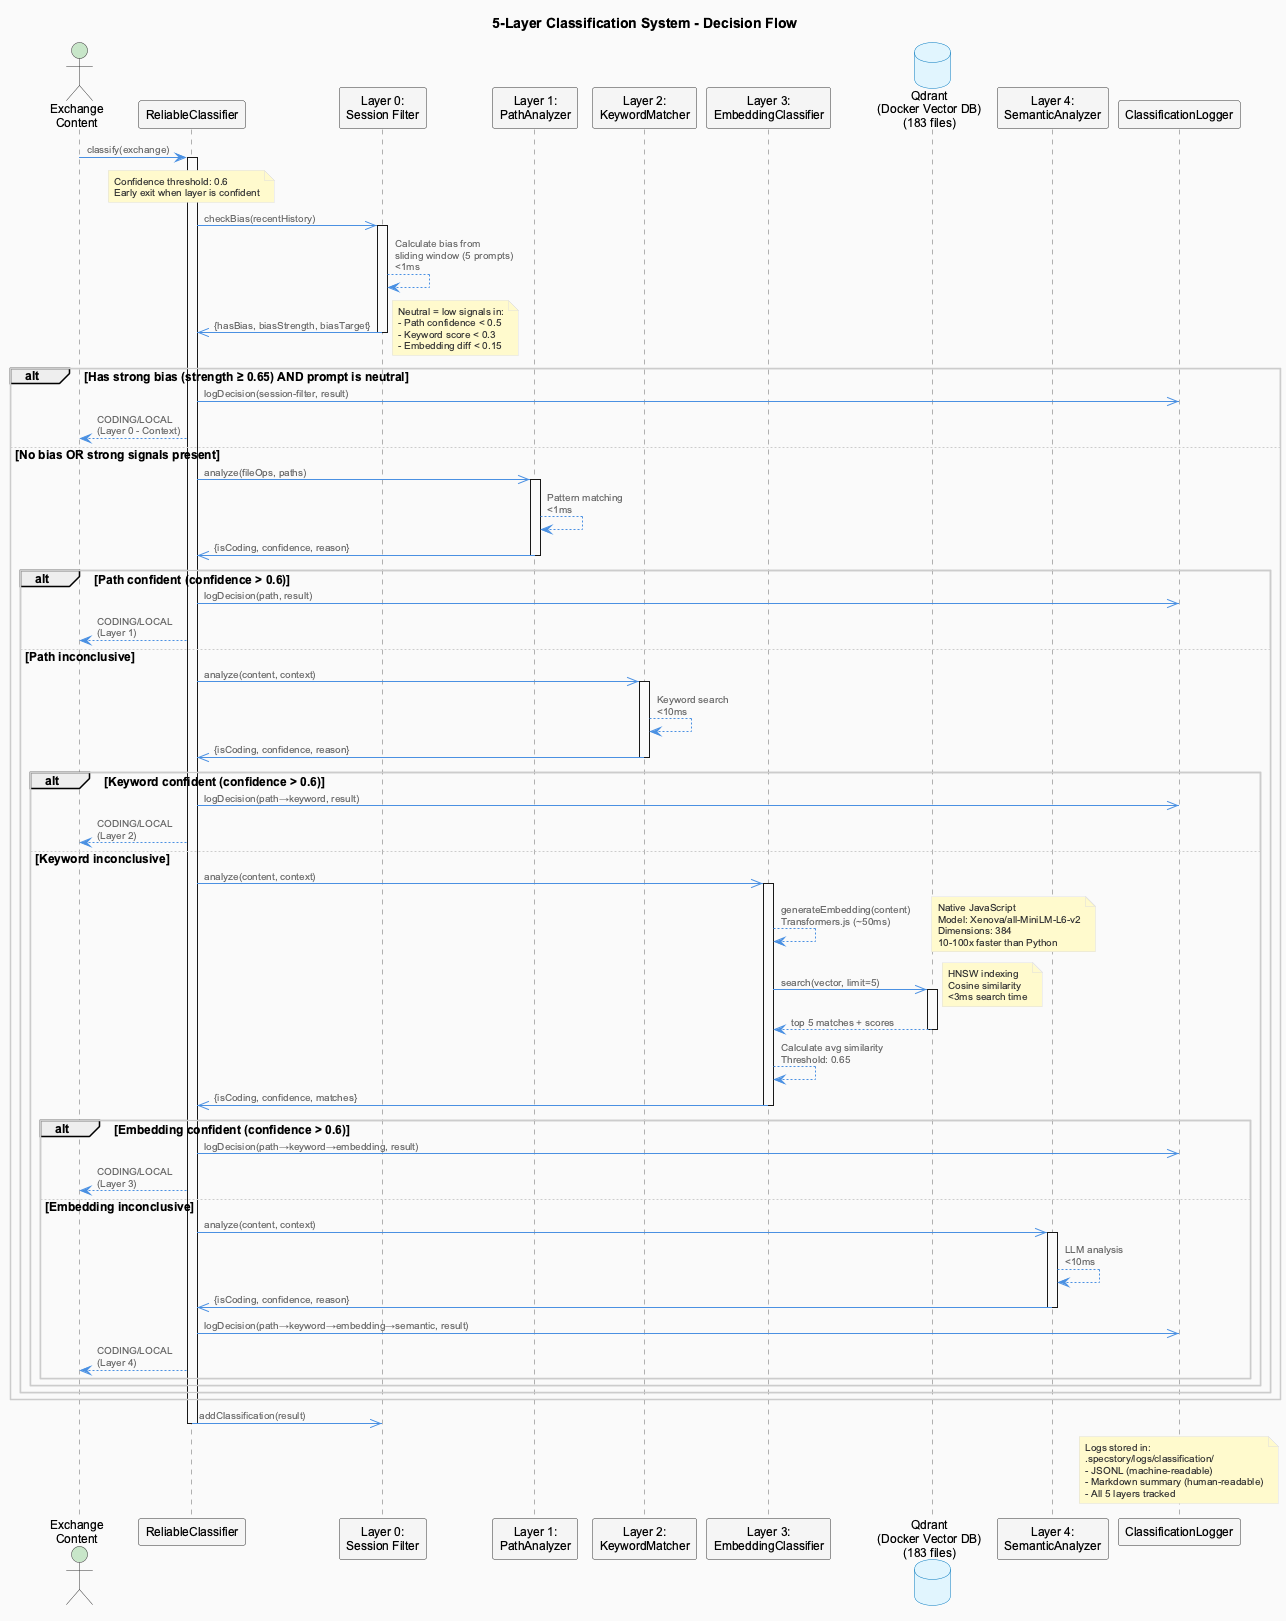
Live Session Logging captures every conversation into .coding/history/ without being asked. A five-layer classifier decides which project each piece of content belongs to, so work that spans repositories is filed where it will be found again, and a redactor strips secrets before anything is written.
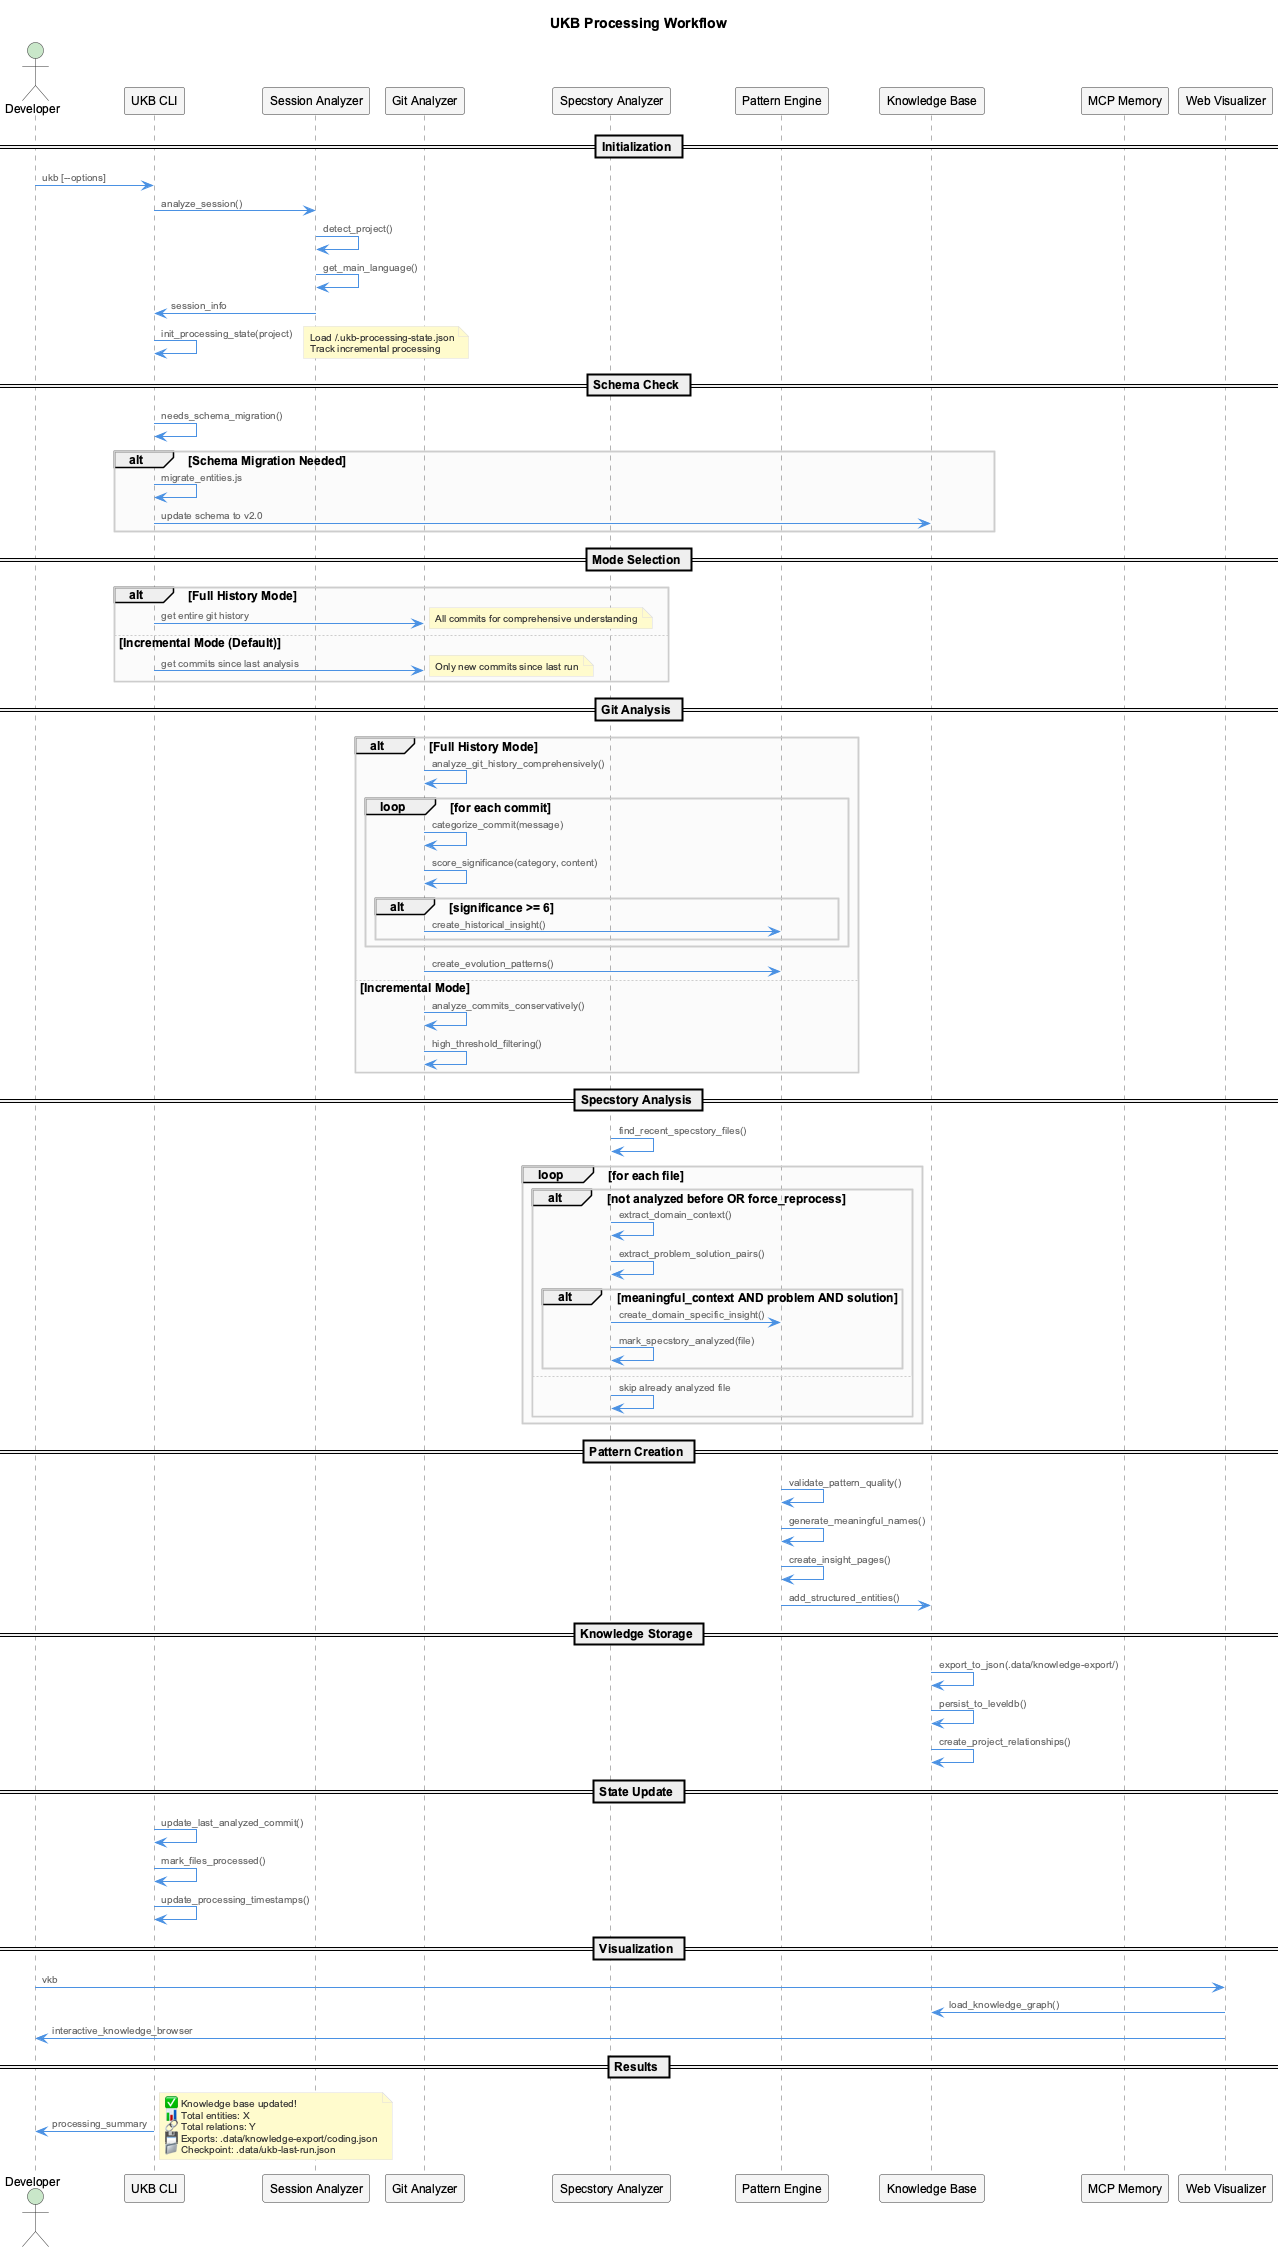
Knowledge Management is a 14-agent extraction pass over your git history and session logs, producing a knowledge graph. Persistence goes through @fwornle/km-core, the kernel shared by all three knowledge systems.
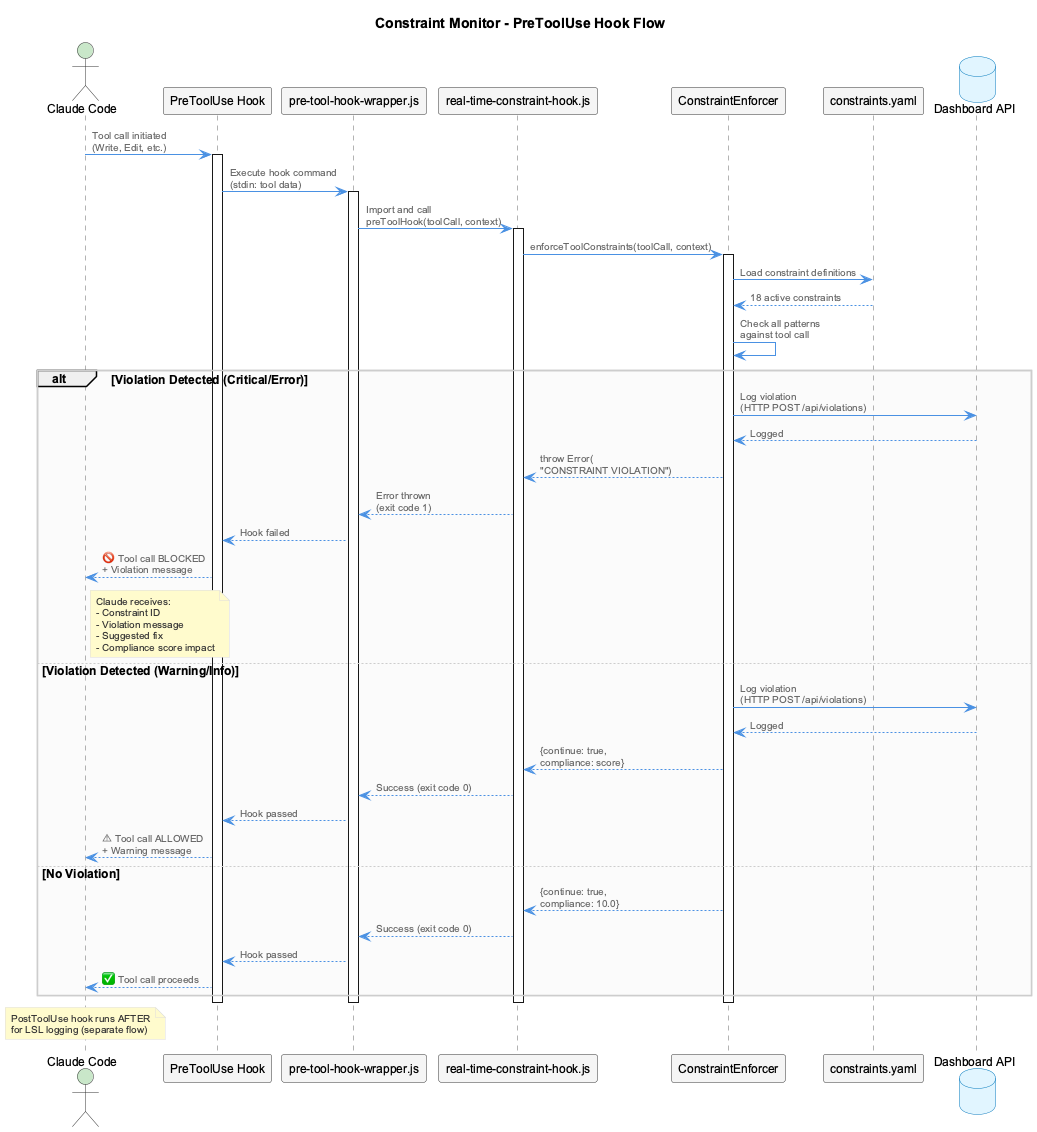
Constraints are PreToolUse hooks: they see a tool call before it runs and can block it. That timing is the whole design — a rule that reports afterwards documents damage instead of preventing it.
Observational Memory watches for patterns across sessions and feeds them back into the knowledge base, so repeated friction becomes something the system knows rather than something you re-discover.
Health monitoring and the status line close the loop by making the state of all of the above visible without asking.
How a session flows through them
A prompt enters the agent. The session monitor records it and everything that follows. Each tool call passes the constraint hook first, which either blocks it with a suggested fix or lets it through. The resulting session log becomes input to the next knowledge extraction pass, whose graph is what the viewer shows and what gets injected back into later sessions. Health monitoring supervises every service in that chain and reports to the status line.
That is the self-improving loop: today's session is tomorrow's context.
Commands
| System | Command | Description |
|---|---|---|
| Logging | (none) | Runs in the background |
| Knowledge | semantic workflow run wave-analysis --team coding | Extraction pass, async, 10–20 min |
| Knowledge | semantic workflow status | Progress of the current run |
| Knowledge | vkb | Viewer at 127.0.0.1:12436/viewer/coding |
| Constraints | (dashboard) | localhost:3030 |
| Health | coding --health | Check every service |
| Health | (dashboard) | localhost:3032 |
Add --debug to the extraction pass to run it with a mocked LLM, single-stepped — useful for watching the agent workflow without spending tokens.
Reading the system state
The dashboards and the status line agree by construction — they read the same health files. When they disagree, that is itself the diagnosis: a stale status line means the process writing it has stopped, not that the service it describes is down. Detail on the supervision layers is in Health Monitoring, and the data path between all six systems is drawn in Data Flow.
The coding infrastructure consists of seven interconnected systems that work together to create a self-improving development experience.
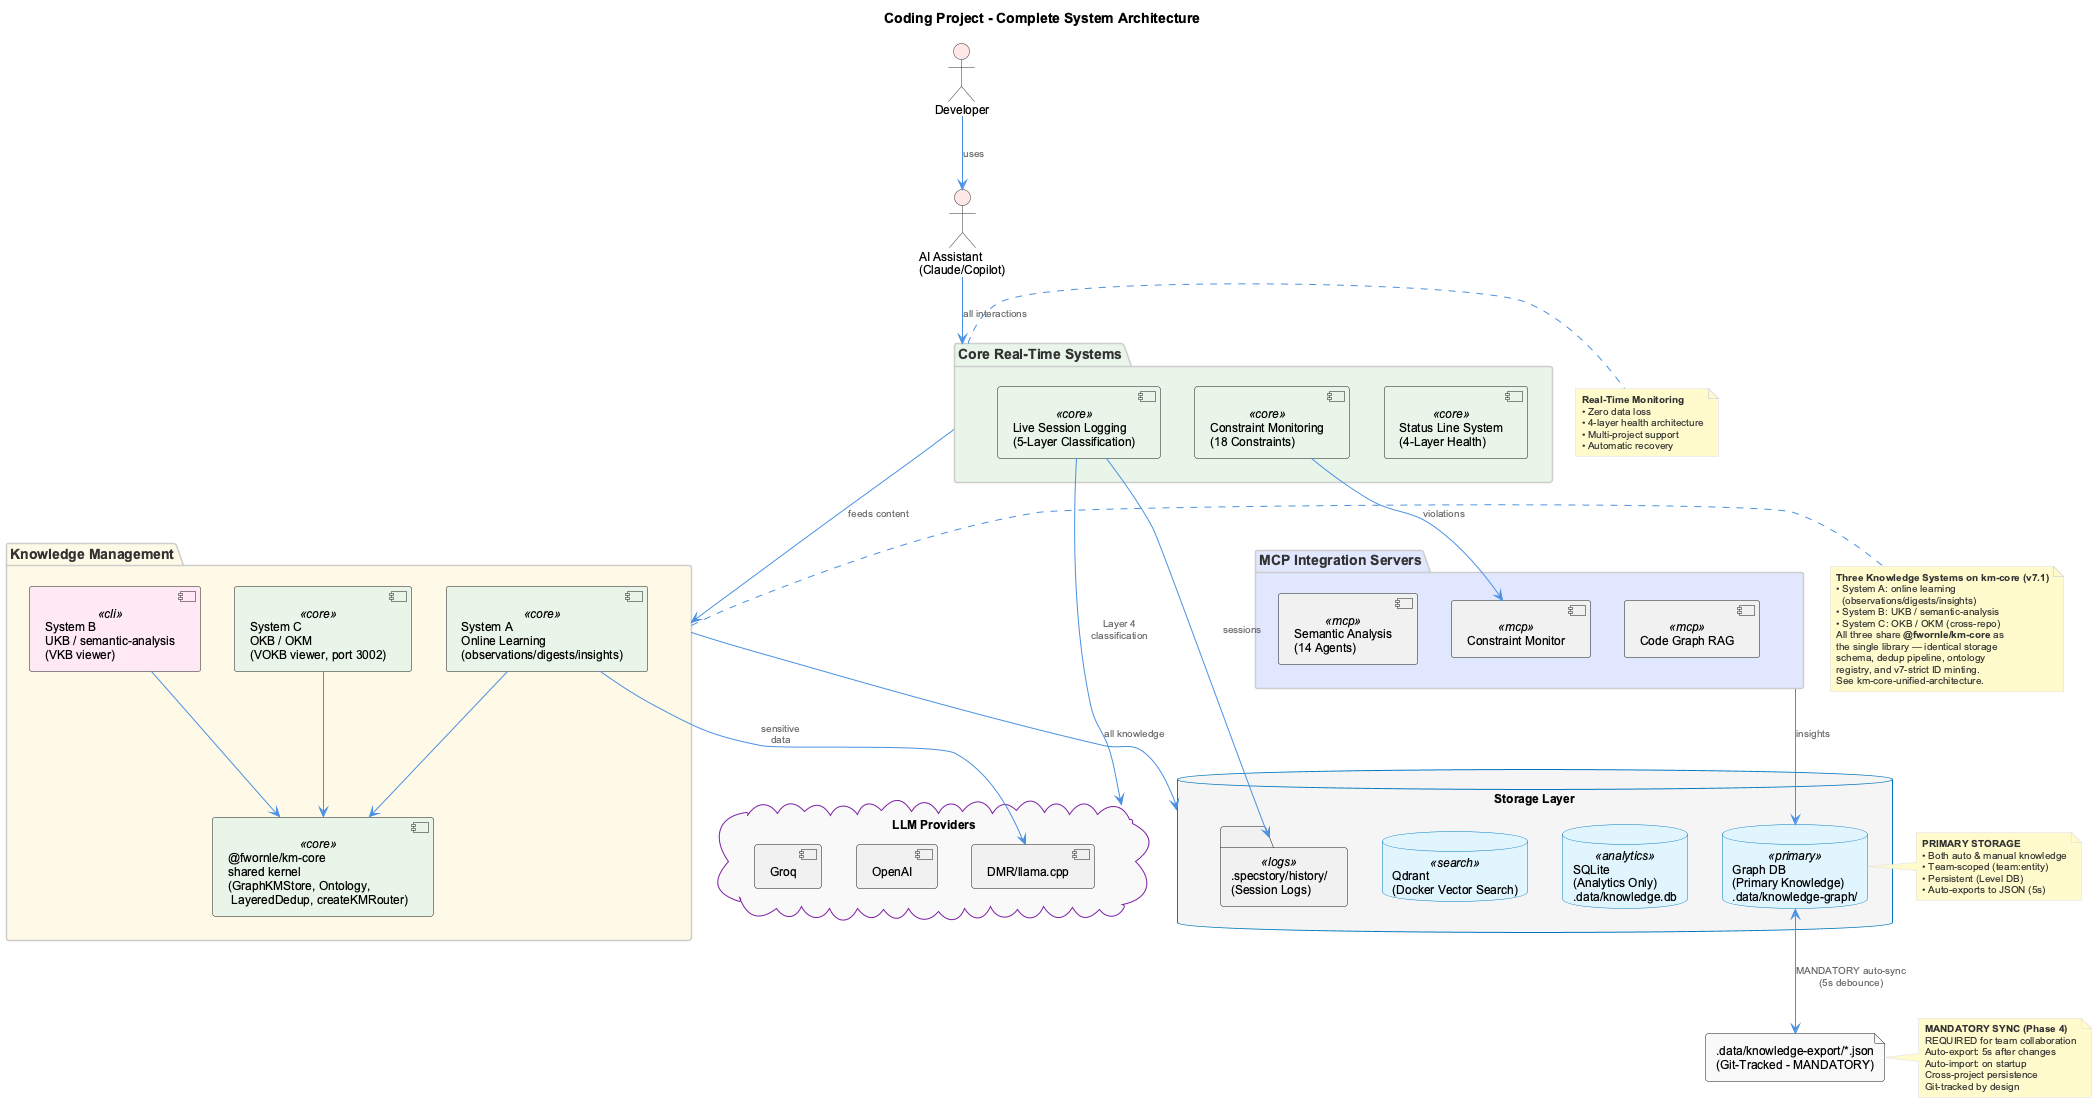
System Overview
-
Live Session Logging (LSL)
Captures every Claude conversation automatically with intelligent 5-layer classification that routes content between projects.
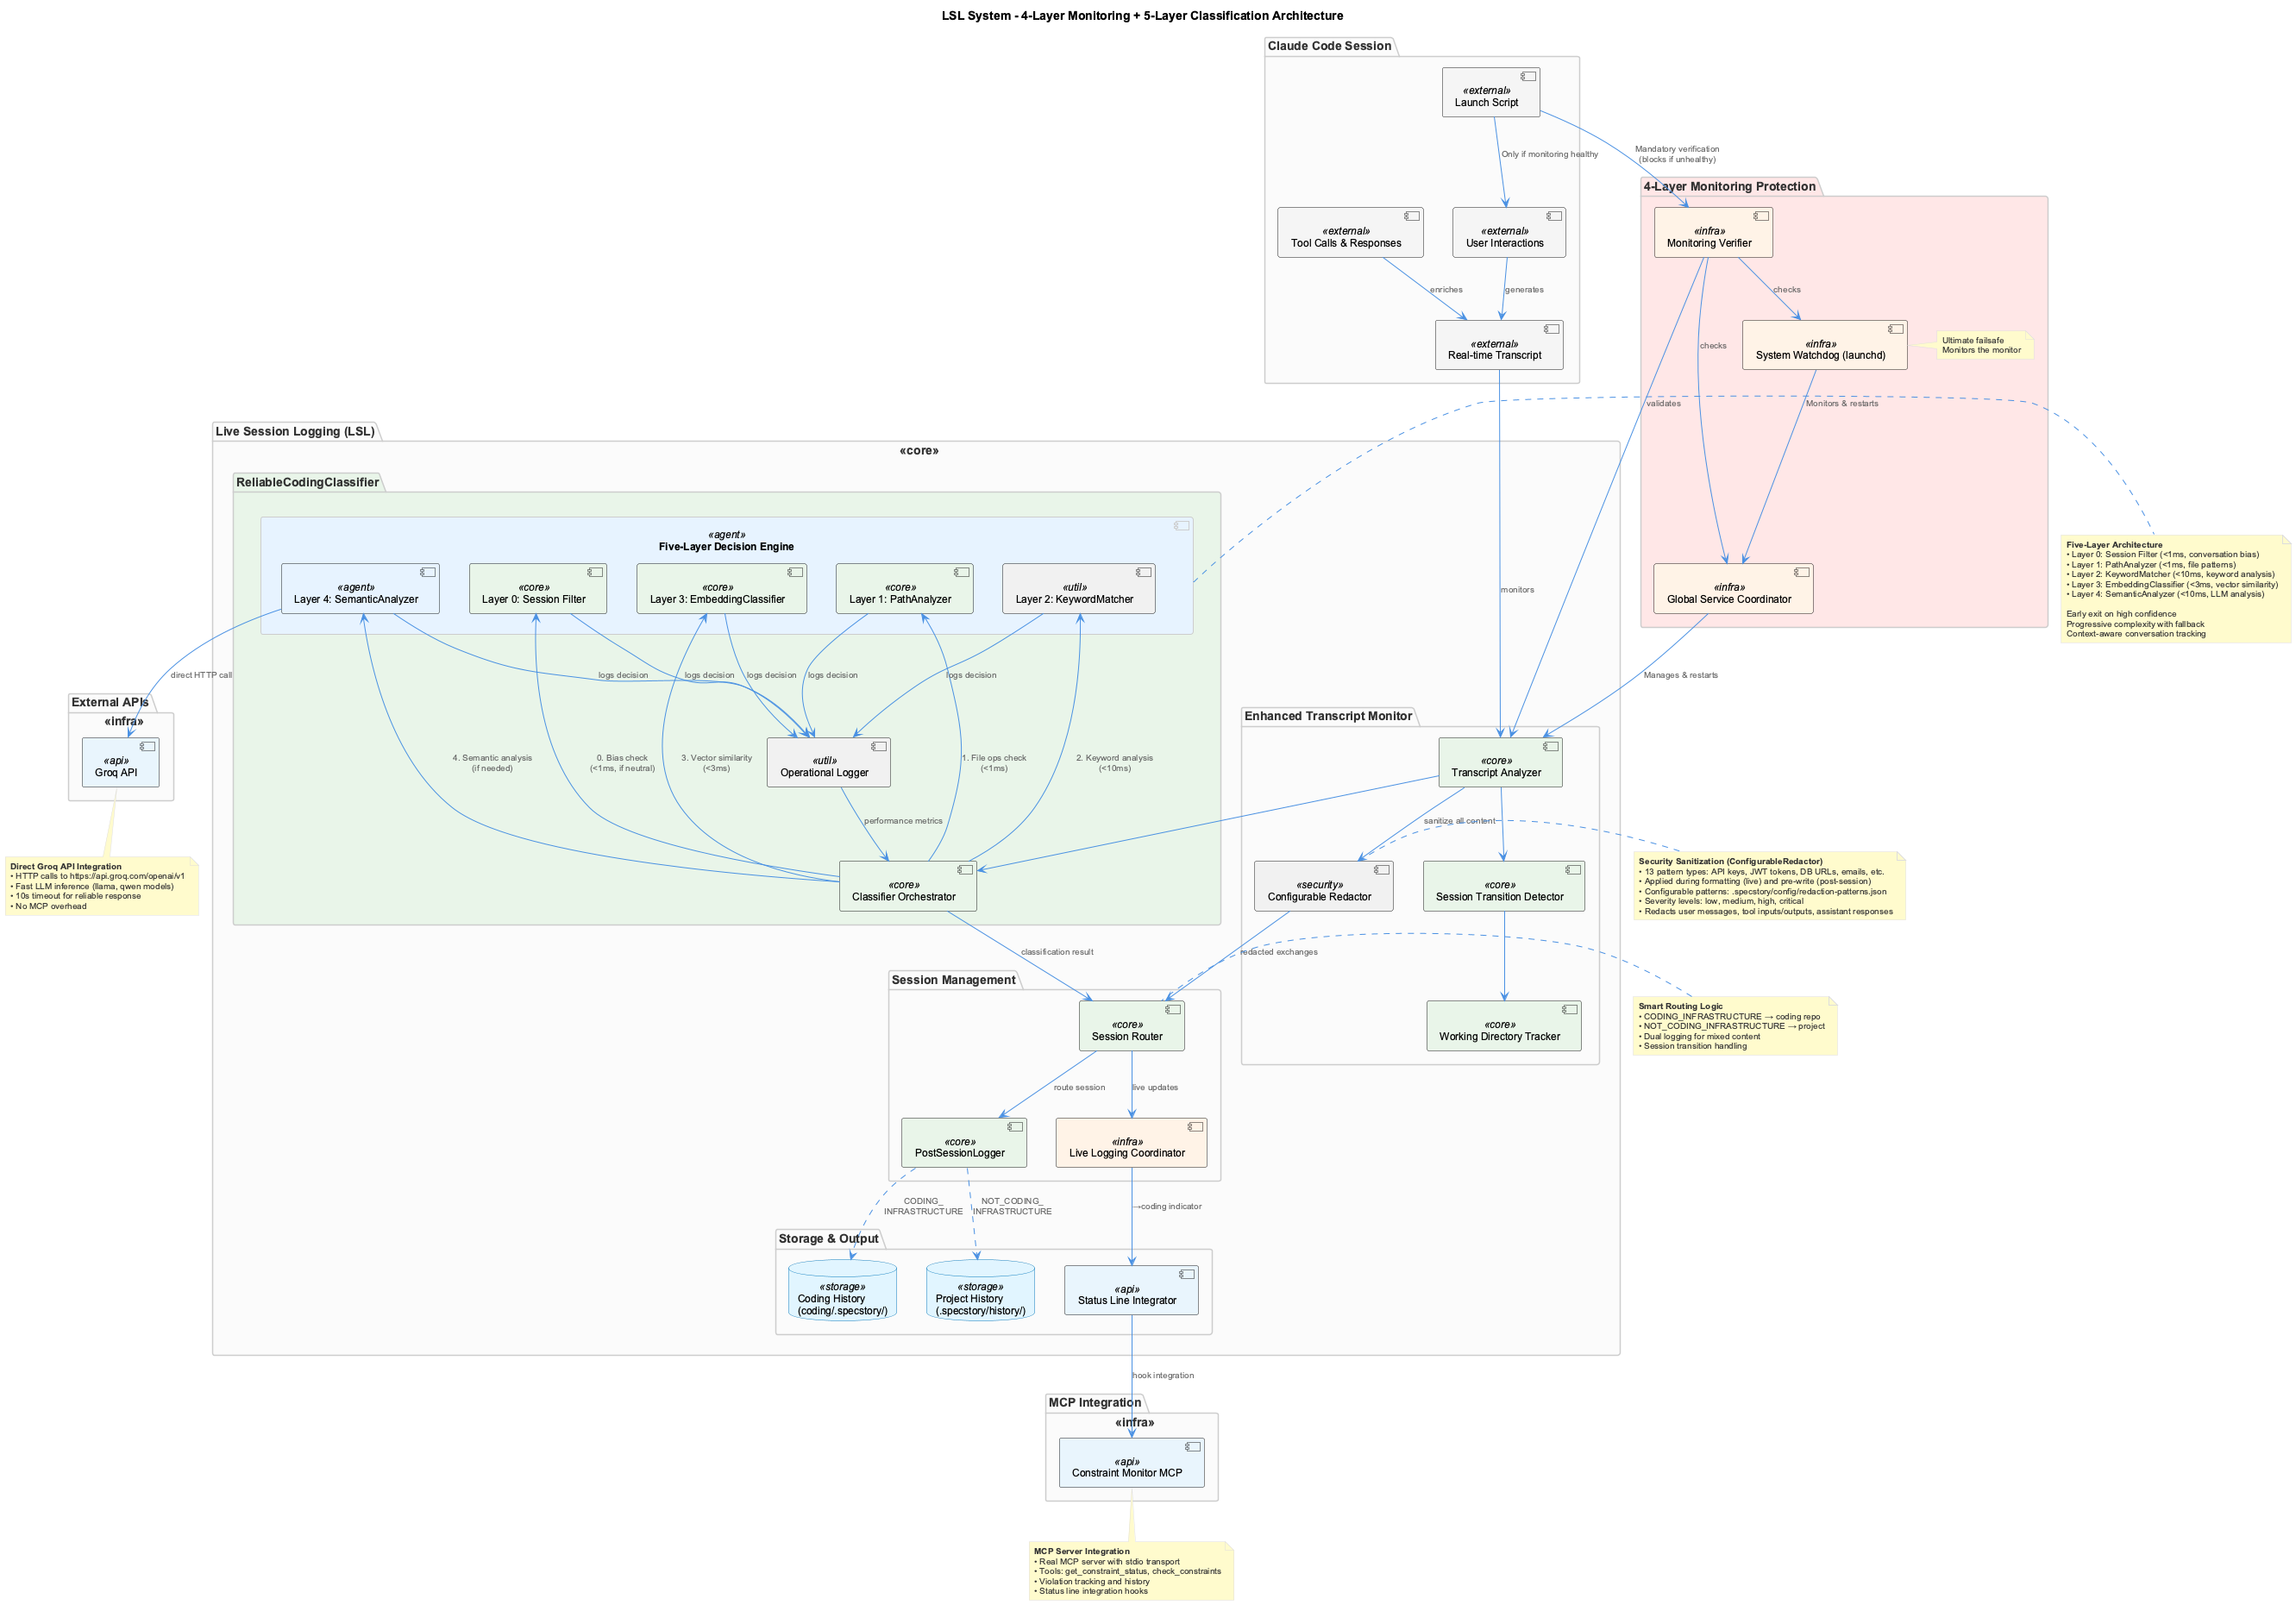
- Real-time monitoring with zero data loss
- Automatic secret redaction
- Multi-project content routing
-
Knowledge Management (UKB/VKB)
14-agent AI system extracts insights from git history and conversation logs, building a searchable knowledge graph. Persistence is delegated to @fwornle/km-core, the shared kernel that backs all three knowledge systems.
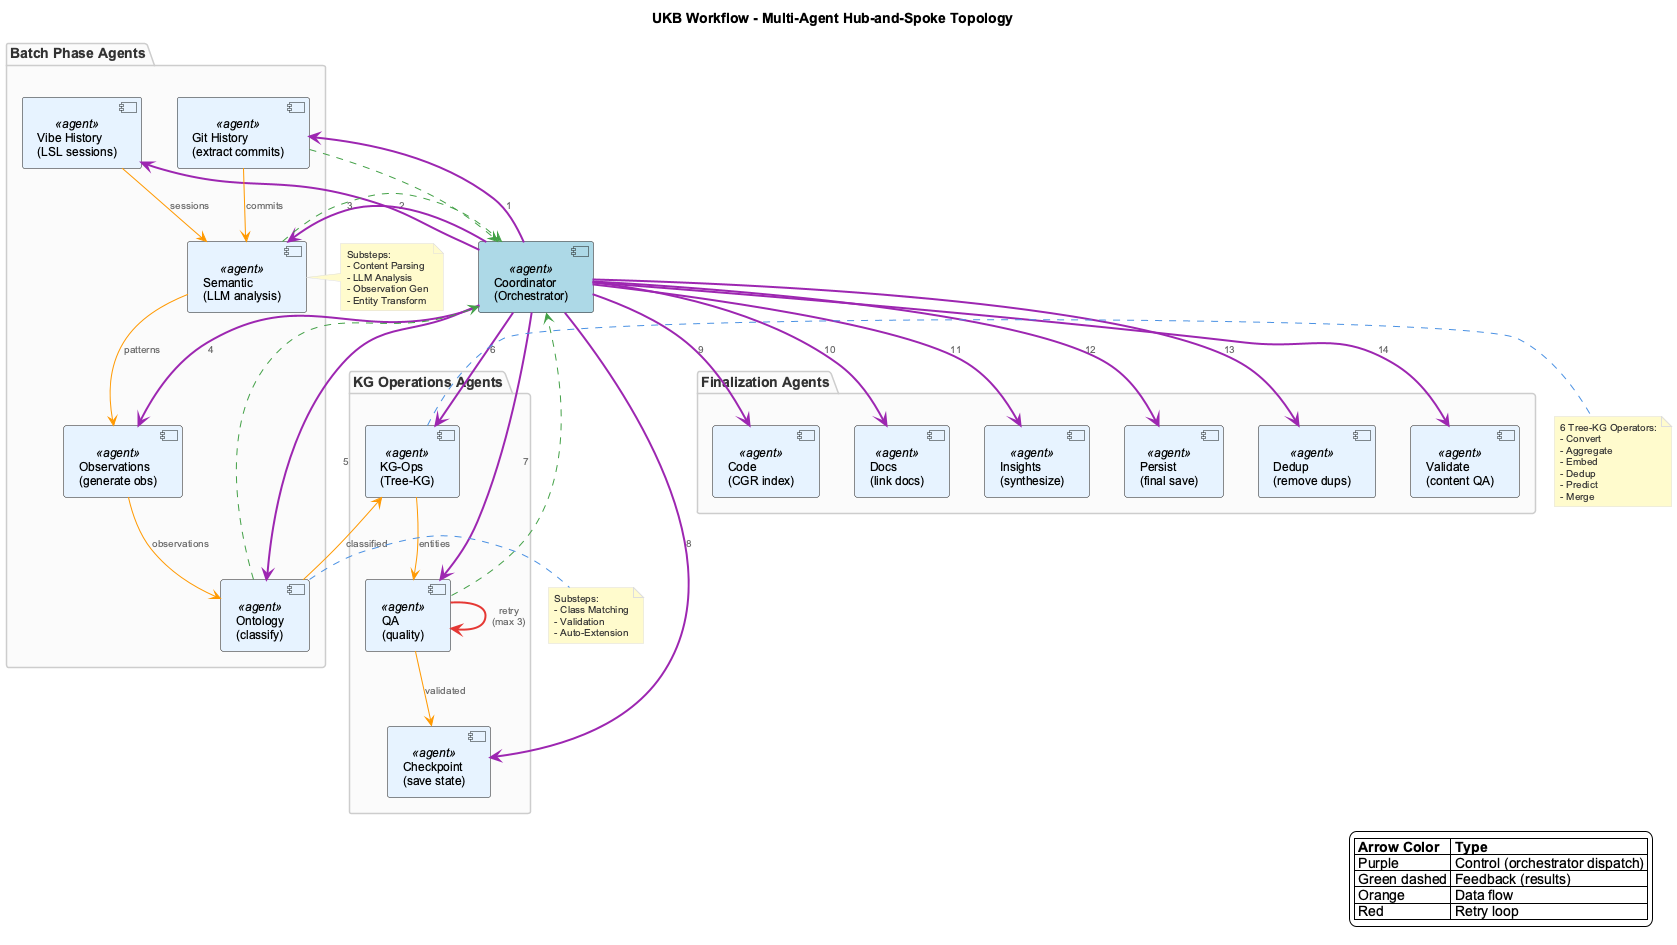
- Incremental and full analysis modes
- Graph + vector database storage
- Interactive web visualization
-
Observational Memory (online learning)
Real-time observation capture across all four agents (Claude, Copilot, OpenCode, Pi), consolidated daily into thematic digests and weekly into persistent project insights.
- Three-tier memory hierarchy
- Single-owner SQLite + km-core graph store
- Truthfulness verification and coverage tracking
Port: 12436 (observations API, mounts km-core
/api/km/) -
OKB (Operational Knowledge Base)
Cross-repo knowledge base of root-cause analyses, runbooks, and operational documents. Lives in
_work/rapid-automations/integrations/operational-knowledge-management/; consumes the same @fwornle/km-core library used by the UKB and the online-learning pipeline.- LLM-driven ingestion + governance
- Four-tier ontology (upper + RaaS + KPI-FW + business)
- VOKB graph viewer
Ports: 8090 (OKB API), 3002 (VOKB viewer)
-
Constraint System
20+ configurable constraints enforce code quality via PreToolUse hooks - preventing mistakes before they happen.
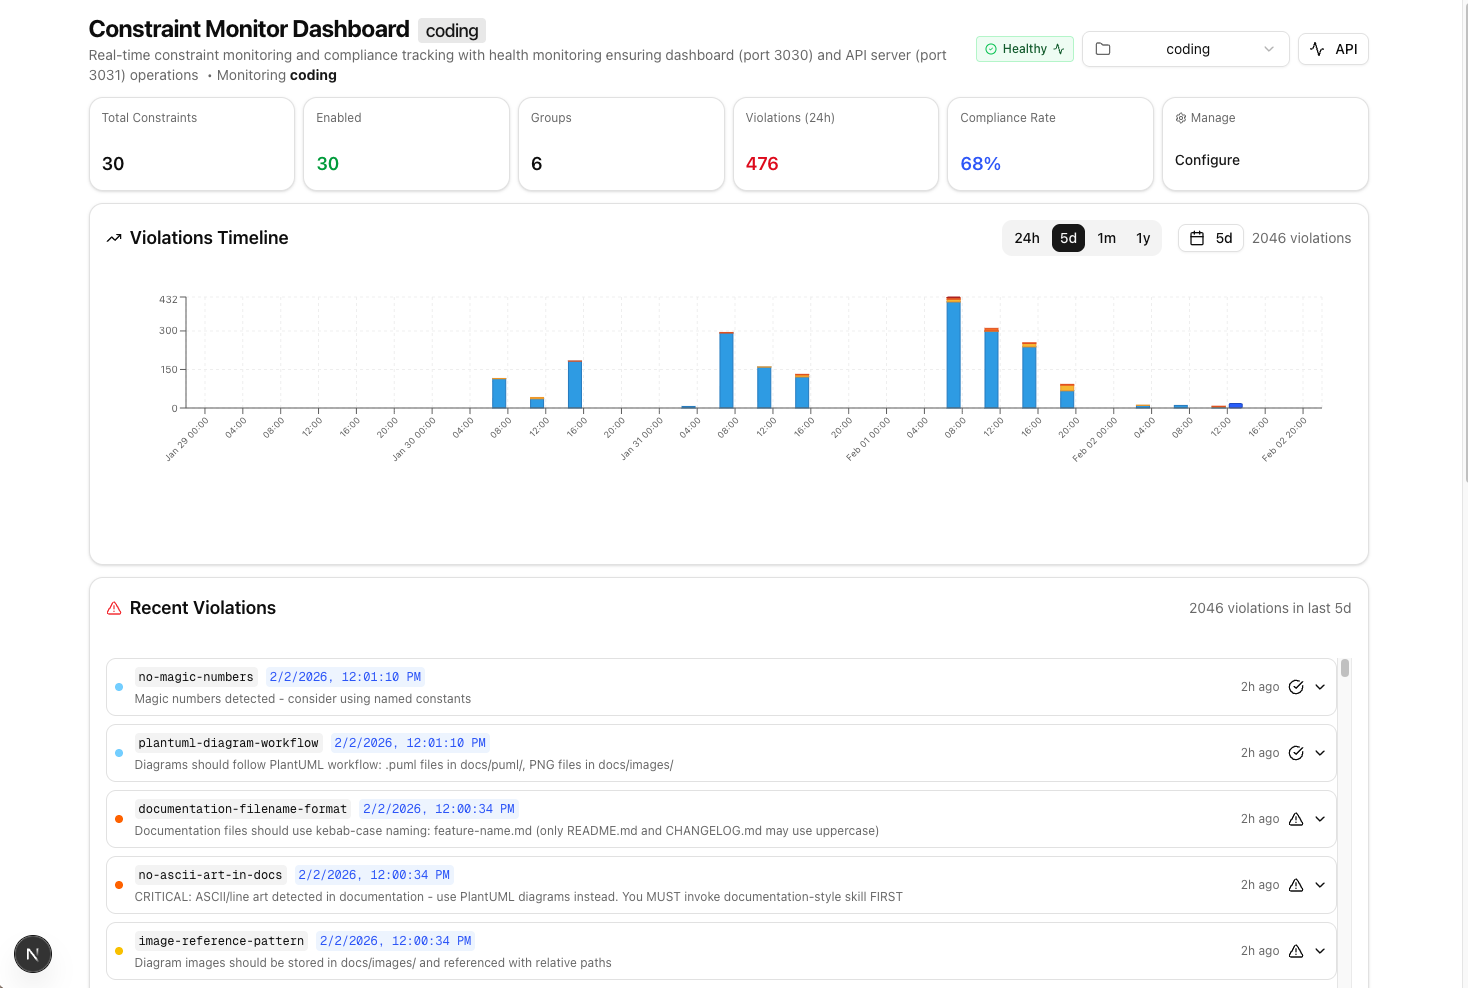
- Real-time violation detection
- Web dashboard monitoring
- Auto-correction suggestions
-
Health Monitoring
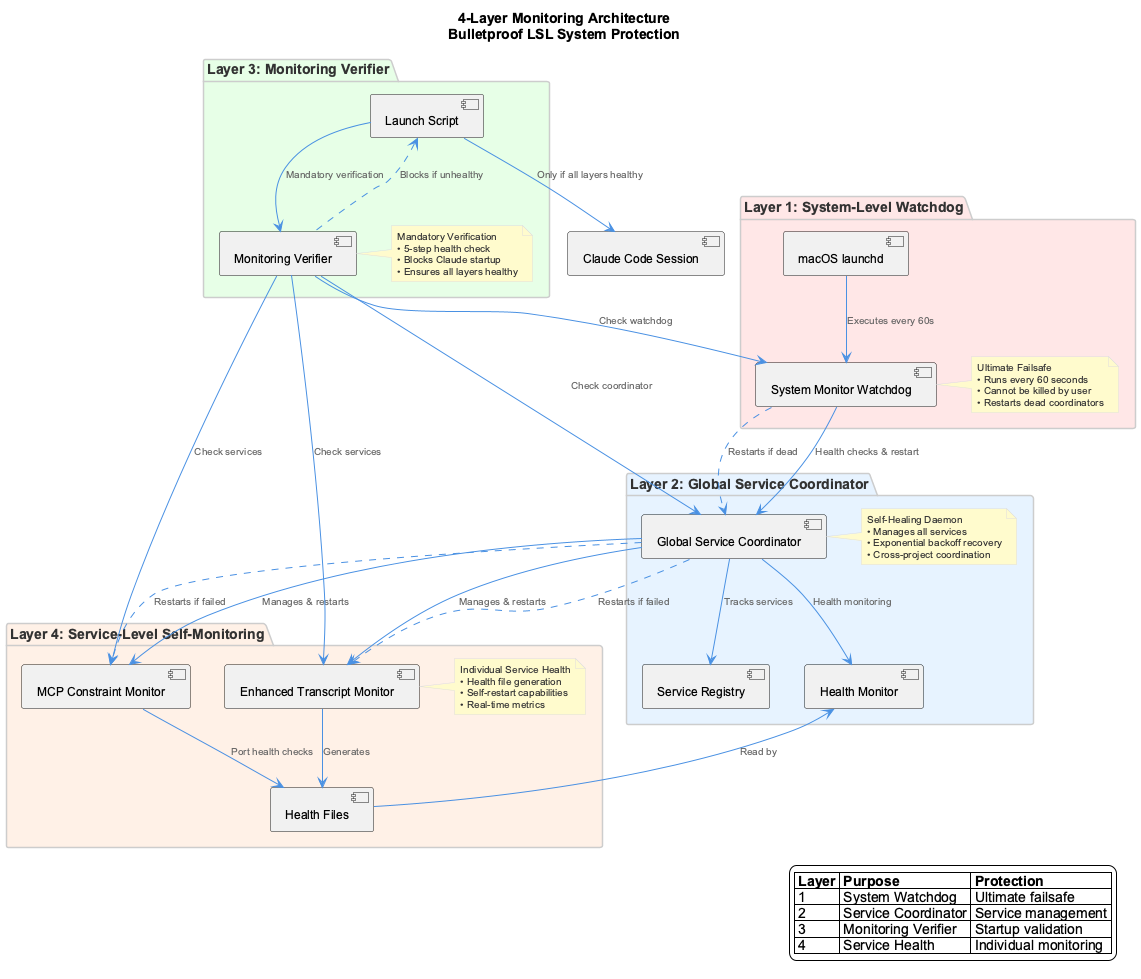
4-layer watchdog architecture ensures system reliability with automatic recovery.
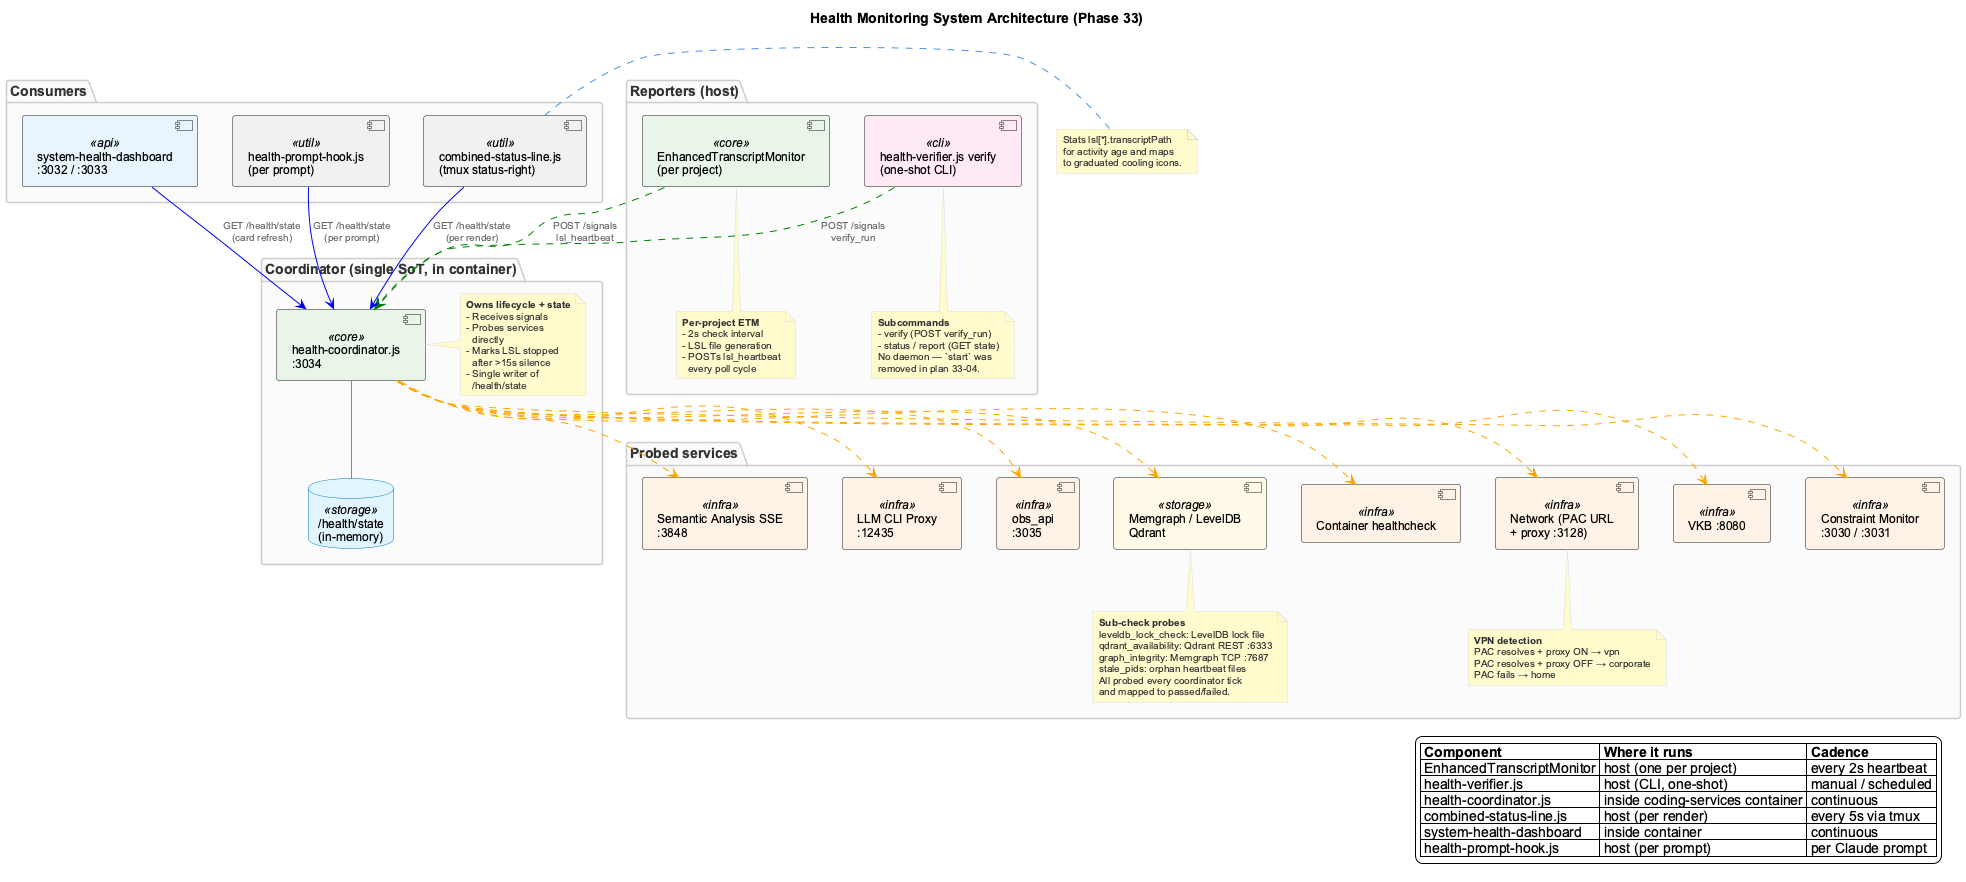
- Process health monitoring
- Automatic restart on failure
- Multi-agent workflow visualization
-
Status Line
Real-time feedback in your terminal showing system health, API costs, and development state.

- Service health indicators
- Cost tracking display
- LSL status
How They Work Together
flowchart TB
    subgraph Input["Claude Session"]
        A[User Prompt]
        B[Tool Calls]
        C[Responses]
    end

    subgraph LSL["Live Session Logging"]
        D[Monitor] --> E[5-Layer Classifier]
        E --> F[Redactor]
        F --> G{Route}
        G -->|Local| H[Project History]
        G -->|Coding| I[Coding History]
    end

    subgraph KB["Knowledge Management"]
        J[UKB Workflow] --> K[14 Agents]
        K --> L[Graph DB]
        K --> M[Vector DB]
        L --> N[VKB Viewer]
    end

    subgraph Constraints["Constraint System"]
        O[PreToolUse Hook] --> P[Validator]
        P --> Q{Compliant?}
        Q -->|No| R[Block + Suggest Fix]
        Q -->|Yes| S[Allow]
    end

    subgraph Feedback["Feedback Systems"]
        T[Status Line]
        U[Health Monitor]
    end

    A --> D
    B --> O
    H --> J
    I --> J
    U --> T
Quick Command Reference
| System | Command | Description |
|---|---|---|
| LSL | Automatic | Runs in background, no commands needed |
| UKB | semantic workflow run wave-analysis --team coding | Knowledge extraction pass (async, 10–20 min) |
| UKB | semantic workflow run wave-analysis --team coding --debug | Same pass with a mocked LLM, single-stepped |
| UKB | semantic workflow status | Progress of the current run |
| VKB | vkb | Open the knowledge viewer (127.0.0.1:12436/viewer/coding) |
| Constraints | Dashboard | View at localhost:3030 |
| Health | coding --health | Check all service health |
| Health | Dashboard | View at localhost:3032 |
Data Flow
The systems interact through shared data stores:
flowchart LR
    subgraph Storage["Data Storage"]
        A[(".coding/history/\nLSL Files")]
        B[(".data/knowledge-graph/\nGraph DB")]
        C[(".data/vector-store/\nVector DB")]
        D[(".health/\nHealth Files")]
    end

    subgraph Systems
        E[LSL Monitor] --> A
        A --> F[UKB Workflow]
        F --> B
        F --> C
        G[Health Monitor] --> D
    end

    subgraph Viewers
        B --> H[VKB Web UI]
        D --> I[Health Dashboard]
    end
System States
Each system reports its status through health files and the status line:
| State | Icon | Meaning |
|---|---|---|
| Healthy | Green | Service running normally |
| Degraded | Yellow | Service running with issues |
| Failed | Red | Service not responding |
| Transitioning | Blue | Mode switch in progress |
Architecture Diagrams
LSL 5-Layer Classification
UKB Multi-Agent Workflow
Constraint Monitoring Flow
Health Monitoring Architecture
Related Documentation
- Architecture Overview - System design principles
- Data Flow - Detailed data flow diagrams
- Integrations - MCP server details