Token Usage Dashboard
Where the tokens went: per process, per model, per account, over any window you choose.
Open it
localhost:3032/token-usage. Every LLM call that goes through the proxy is logged with its provider, model, calling process, token counts, latency and a prompt preview.
Three tabs
| Tab | Answers |
|---|---|
| Overview | Who is consuming — a treemap by process, plus donuts by provider and model |
| Evolution | How consumption changes over time, stacked by process, model, provider or in/out |
| Recent Calls | The last 50 calls, individually |
A time-window dropdown (1h through All time) drives every number on the page at once.
Read totals with the cache columns added back
total_tokens counts fresh input plus output. Cache reads and writes are additive and live in their own columns, so the raw total can understate real consumption by orders of magnitude on a cache-heavy session. The dashboard's own helper adds them back — do the same in any query you write.
One quick query
What the page is built on
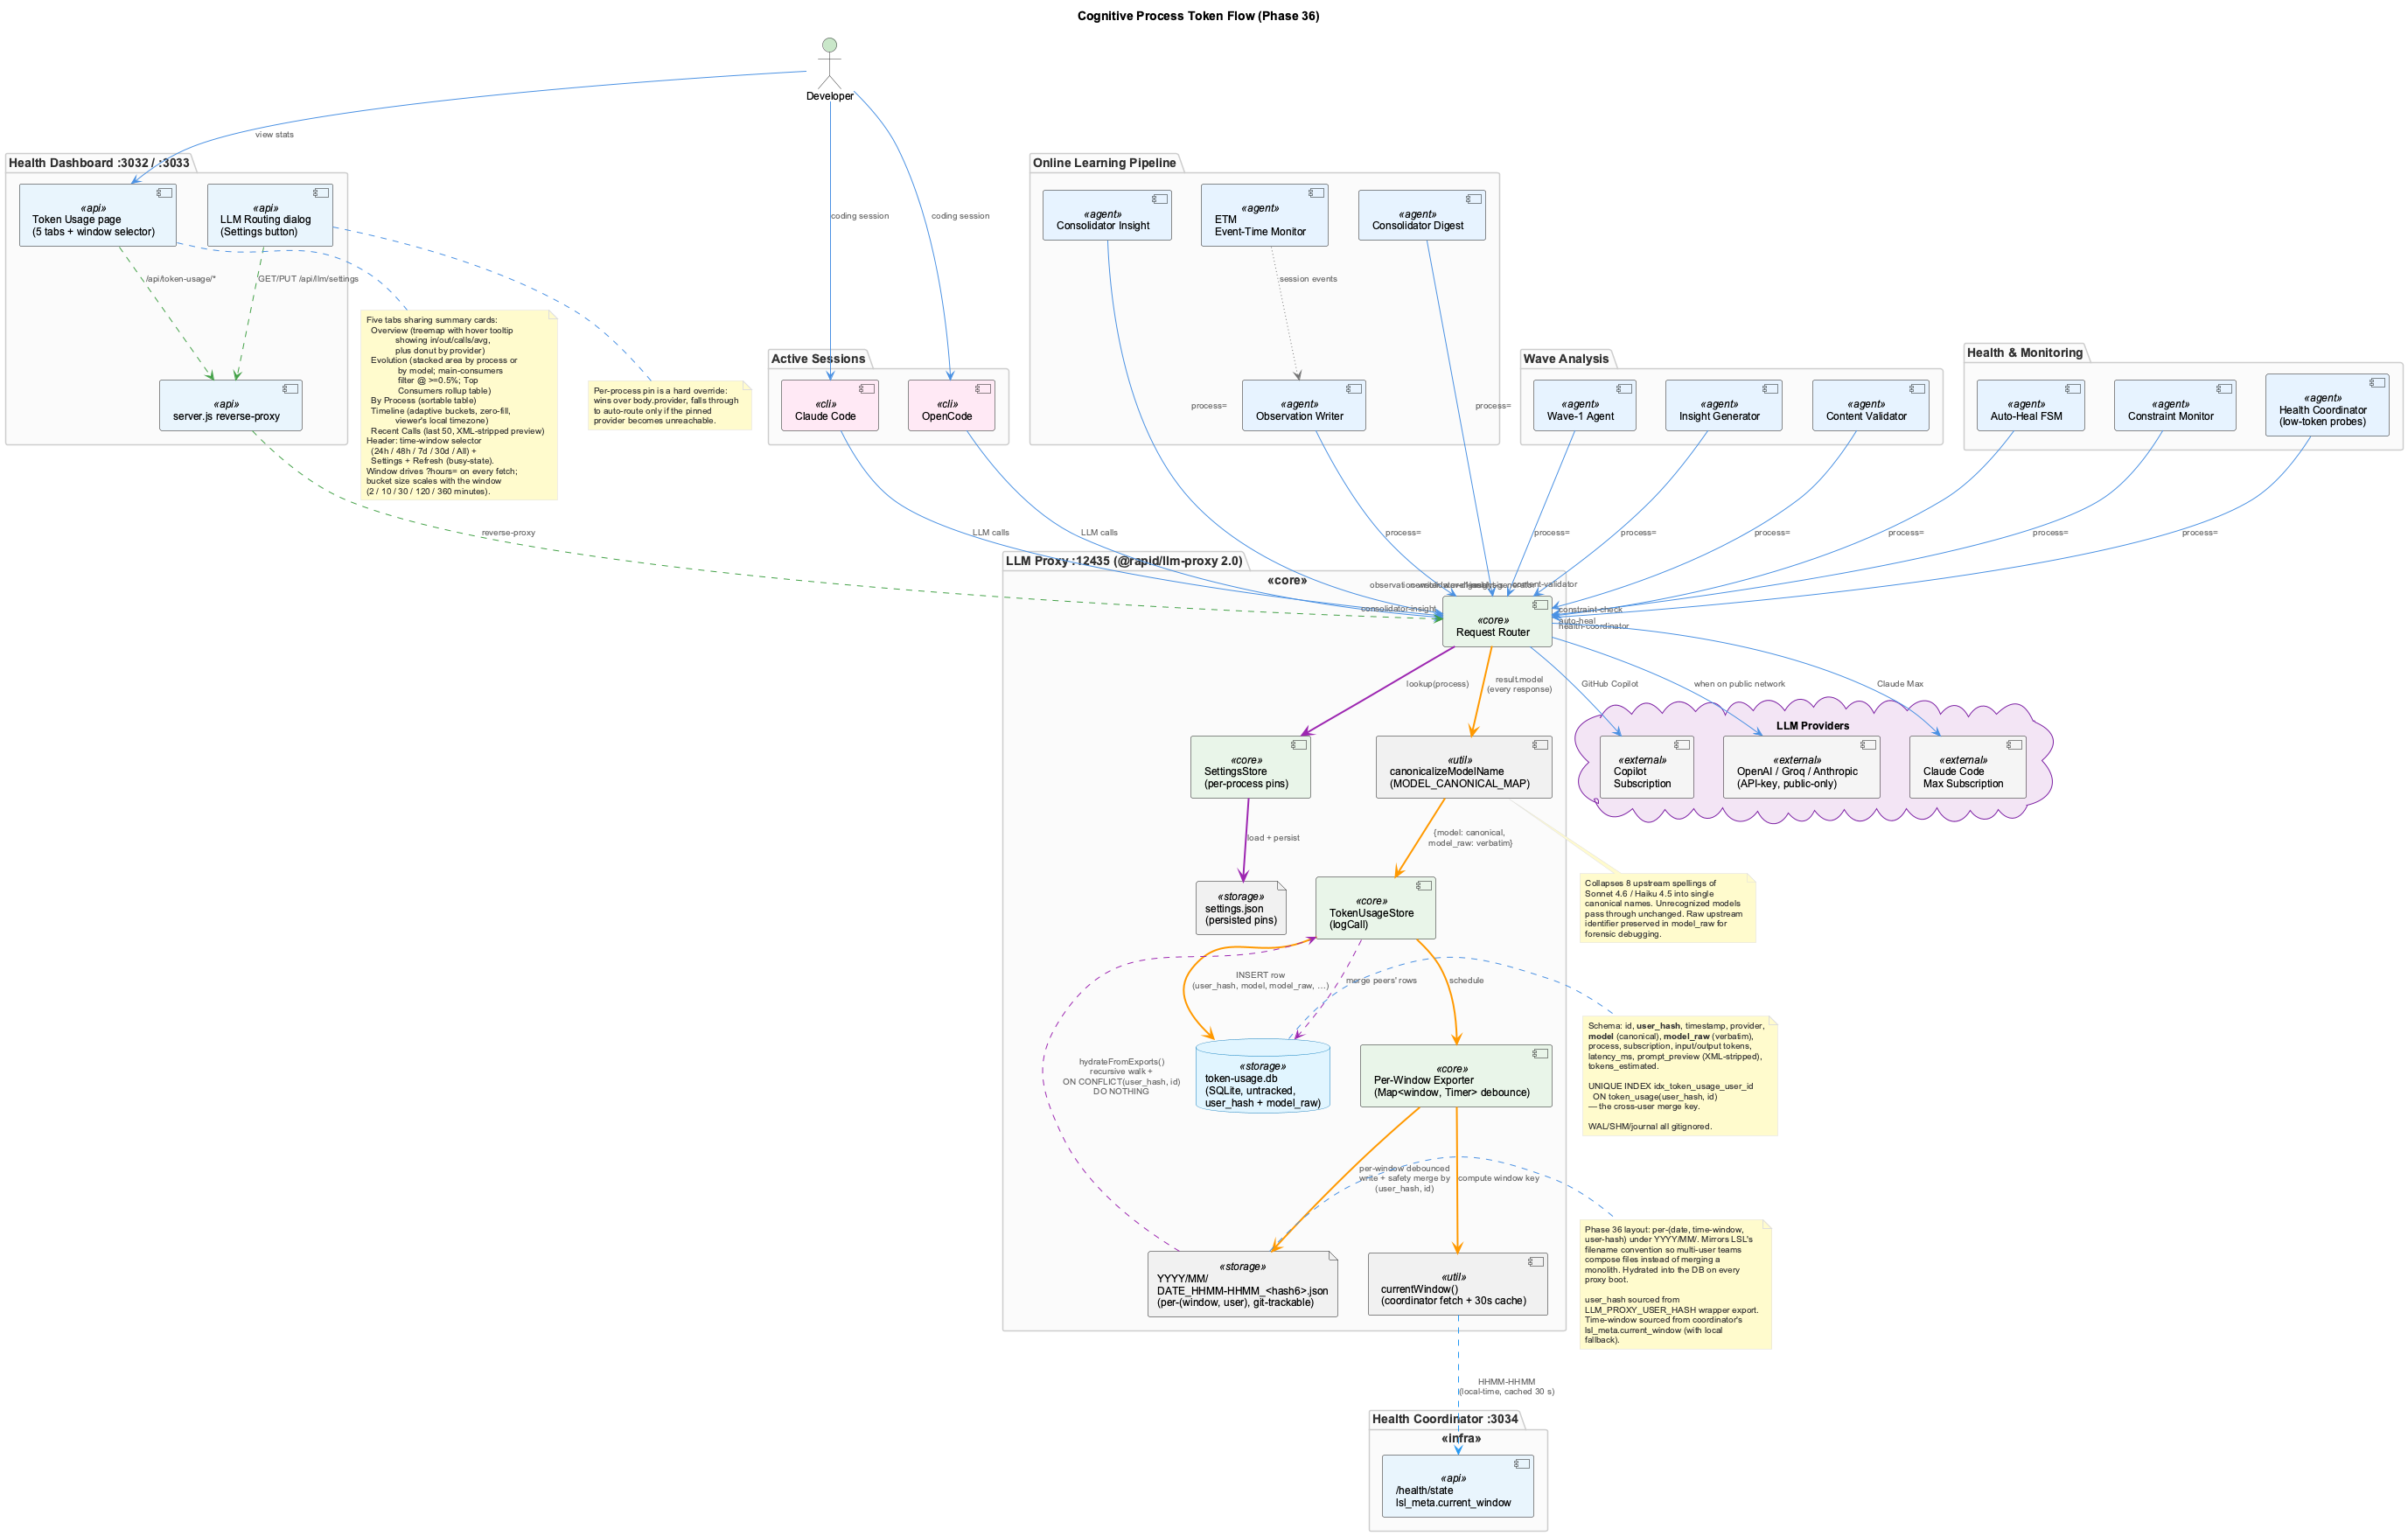
Every request through the proxy carries a process identifier naming the cognitive service that made it. That single field is what makes per-process attribution possible, and it is why a call arriving without one shows up as unknown rather than being dropped.
Reading each tab
Overview shows a treemap where area is tokens — hover any rectangle, including the ones too small to label, for the process, split, call count and average latency. Beside it, donuts break the same totals down by provider and by canonical model name.
Evolution is a stacked area chart over the selected window, with the stacking axis switchable between four lenses on the same data: by process (which subsystem is driving spend), by model (the model mix), by provider (which account is being billed — the only view that separates flat-rate subscription spend from metered API spend), and by input versus output (prompt bloat against generation share).
Two rules keep it readable: series contributing under 0.5% of the window are dropped, and bucket size adapts to the window (2-minute buckets over 24h, up to 6-hour over all time) so the chart never exceeds a few hundred points. The active bucket size is printed under the title.
Recent Calls lists the latest 50, with XML wrapper tags stripped from the preview column.
Model names are canonicalised, providers are accounts
Upstreams spell the same model several ways — claude-sonnet-4-6, claude-sonnet-4.6, Claude Sonnet 4.6, a bare sonnet, a dated snapshot. All collapse to one canonical row at the persistence boundary, with the verbatim string kept in model_raw for forensics.
Providers are accounts, not companies. A flat-rate subscription and a metered API key can serve the same model and are entirely different money, so always read a provider column as "who is being billed".
Where the data lives
Two stores, deliberately:
| Path | Role | In git? |
|---|---|---|
.data/llm-proxy/token-usage.db | SQLite WAL — authoritative locally | no |
.data/llm-proxy-export/YYYY/MM/…json | Per-hour, per-user snapshot | yes |
SQLite WAL files do not merge across machines; per-hour JSON files do. On every proxy boot the exports are re-ingested with a conflict-ignoring insert keyed on (user_hash, id), so after a git pull a teammate's rows simply appear alongside yours. Idempotency comes from that composite index, not from skipping the hydration.
Useful queries
# Tokens in the last 24 hours, fresh input and output
sqlite3 .data/llm-proxy/token-usage.db \
"SELECT SUM(input_tokens), SUM(output_tokens) FROM token_usage \
WHERE timestamp > datetime('now', '-24 hours')"
# Which account served the traffic
sqlite3 .data/llm-proxy/token-usage.db \
"SELECT provider, COUNT(*), SUM(total_tokens) FROM token_usage GROUP BY provider"
When you write your own, add cache_read and cache_write to total_tokens — otherwise a cache-heavy foreground session reads as a fraction of its real consumption.
Changing where a service routes
The ⚙ button opens the routing settings, which is the dashboard side of the proxy's own config. Full explanation of how a route is chosen — and how to diagnose a surprise — is in LLM Routing.
Overview
The Token Usage page provides real-time visibility into LLM token consumption across every cognitive process in the project. Every call through the LLM Proxy Bridge is logged with provider, model, process attribution, token counts, latency, and a prompt preview. The page makes it possible to spot runaway consumers, see provider mix at a glance, and force a specific service to a specific provider+model when auto-routing picks wrong.
Dashboard URL: http://localhost:3032/token-usage
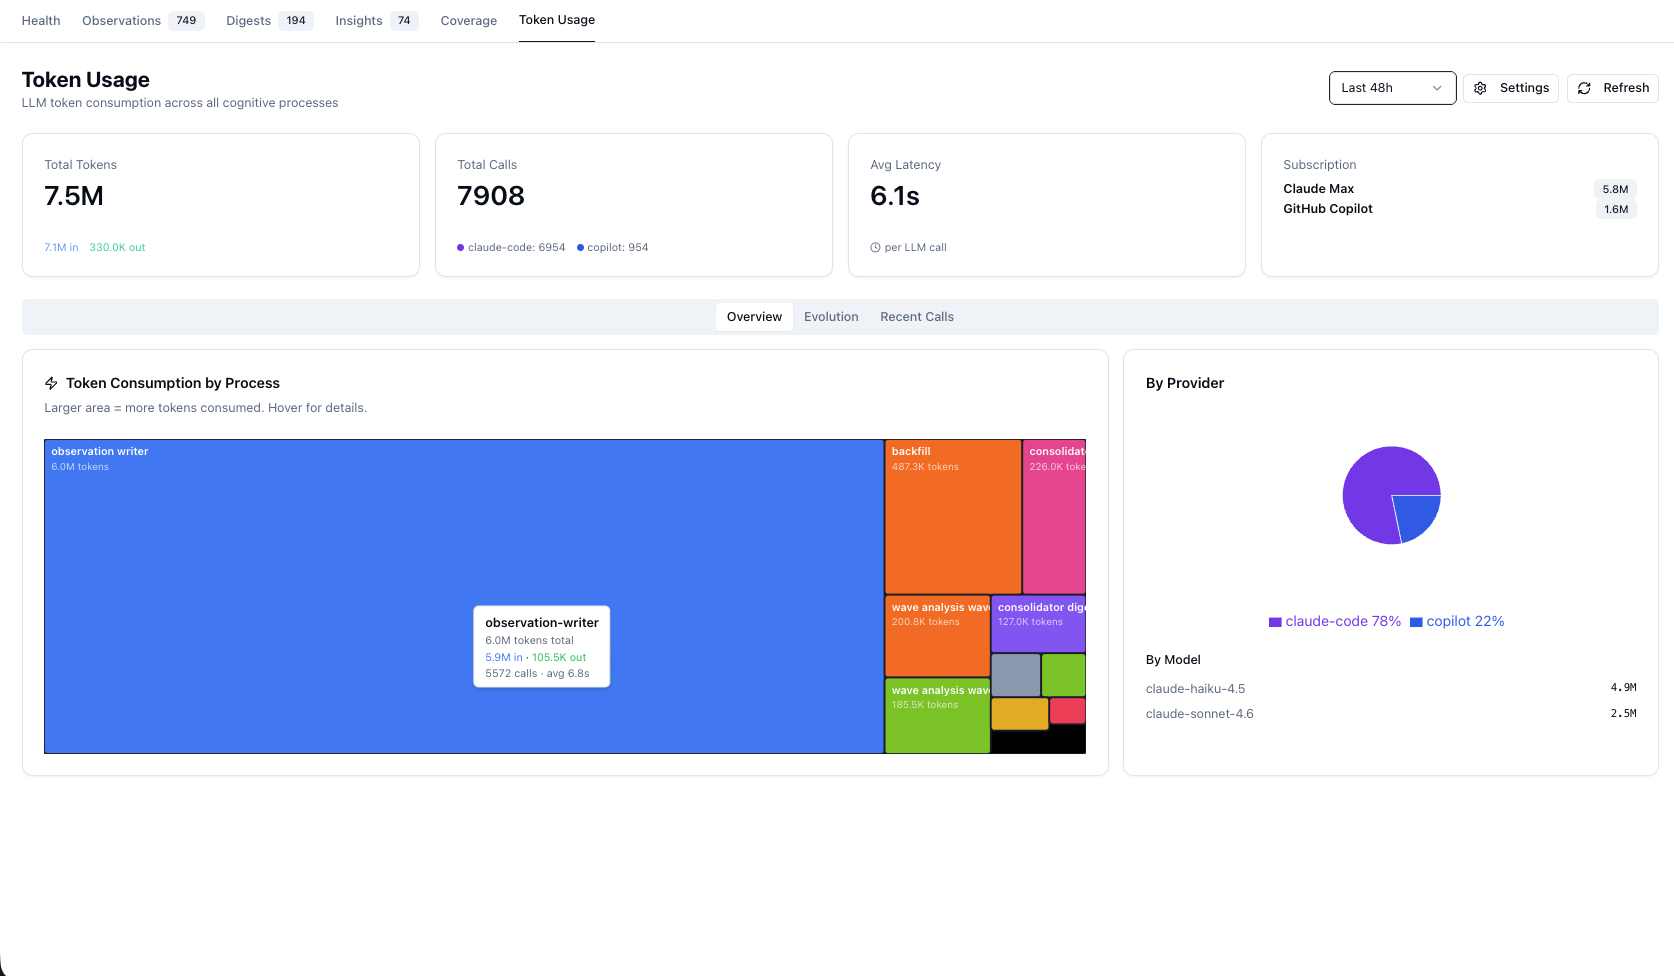
Page layout
The page is organized into three tabs sharing a single header bar:
- Summary cards (always visible): Total Tokens, Total Calls, Avg Latency per LLM call, and a Subscription summary (Claude Max + GitHub Copilot quotas). Every card respects the active time window (see header actions below).
- Tabs: Overview · Evolution · Recent Calls. (The earlier dedicated By Process and Timeline tabs were folded into Overview's Treemap and Evolution's By Tokens (in/out) toggle respectively — see below.)
- Header actions: Time window dropdown (
Last 1h · 24h · 48h · 7 days · 30 days · All time) · ⚙ Settings (opens the LLM Routing dialog) · ⟳ Refresh (re-fetches summary + recent; shows a busy spinner while the request is in flight).
Time window selector
The window dropdown drives ?hours= on the /api/token-usage/summary request. Every metric on the page — summary cards, treemap, By-Process table, Timeline, and the Evolution stacked chart — re-aggregates for the chosen window. The default is Last 24h so the page matches the historical "trailing 24 h" behavior on first load; switching to All time aggregates the full retained DB without changing any other UI.
Bucket size for the stacked chart adapts to the window so the timeline never balloons past ~500 data points: 2-min buckets for Last 24h, 10-min for 48h, 30-min for 7 days, 2-hour for 30 days, 6-hour for All time. The active bucket size is shown beneath the Evolution chart's title (e.g. "Last 7 days · 30-minute buckets").
Overview tab
The header cards plus two side-by-side panels:
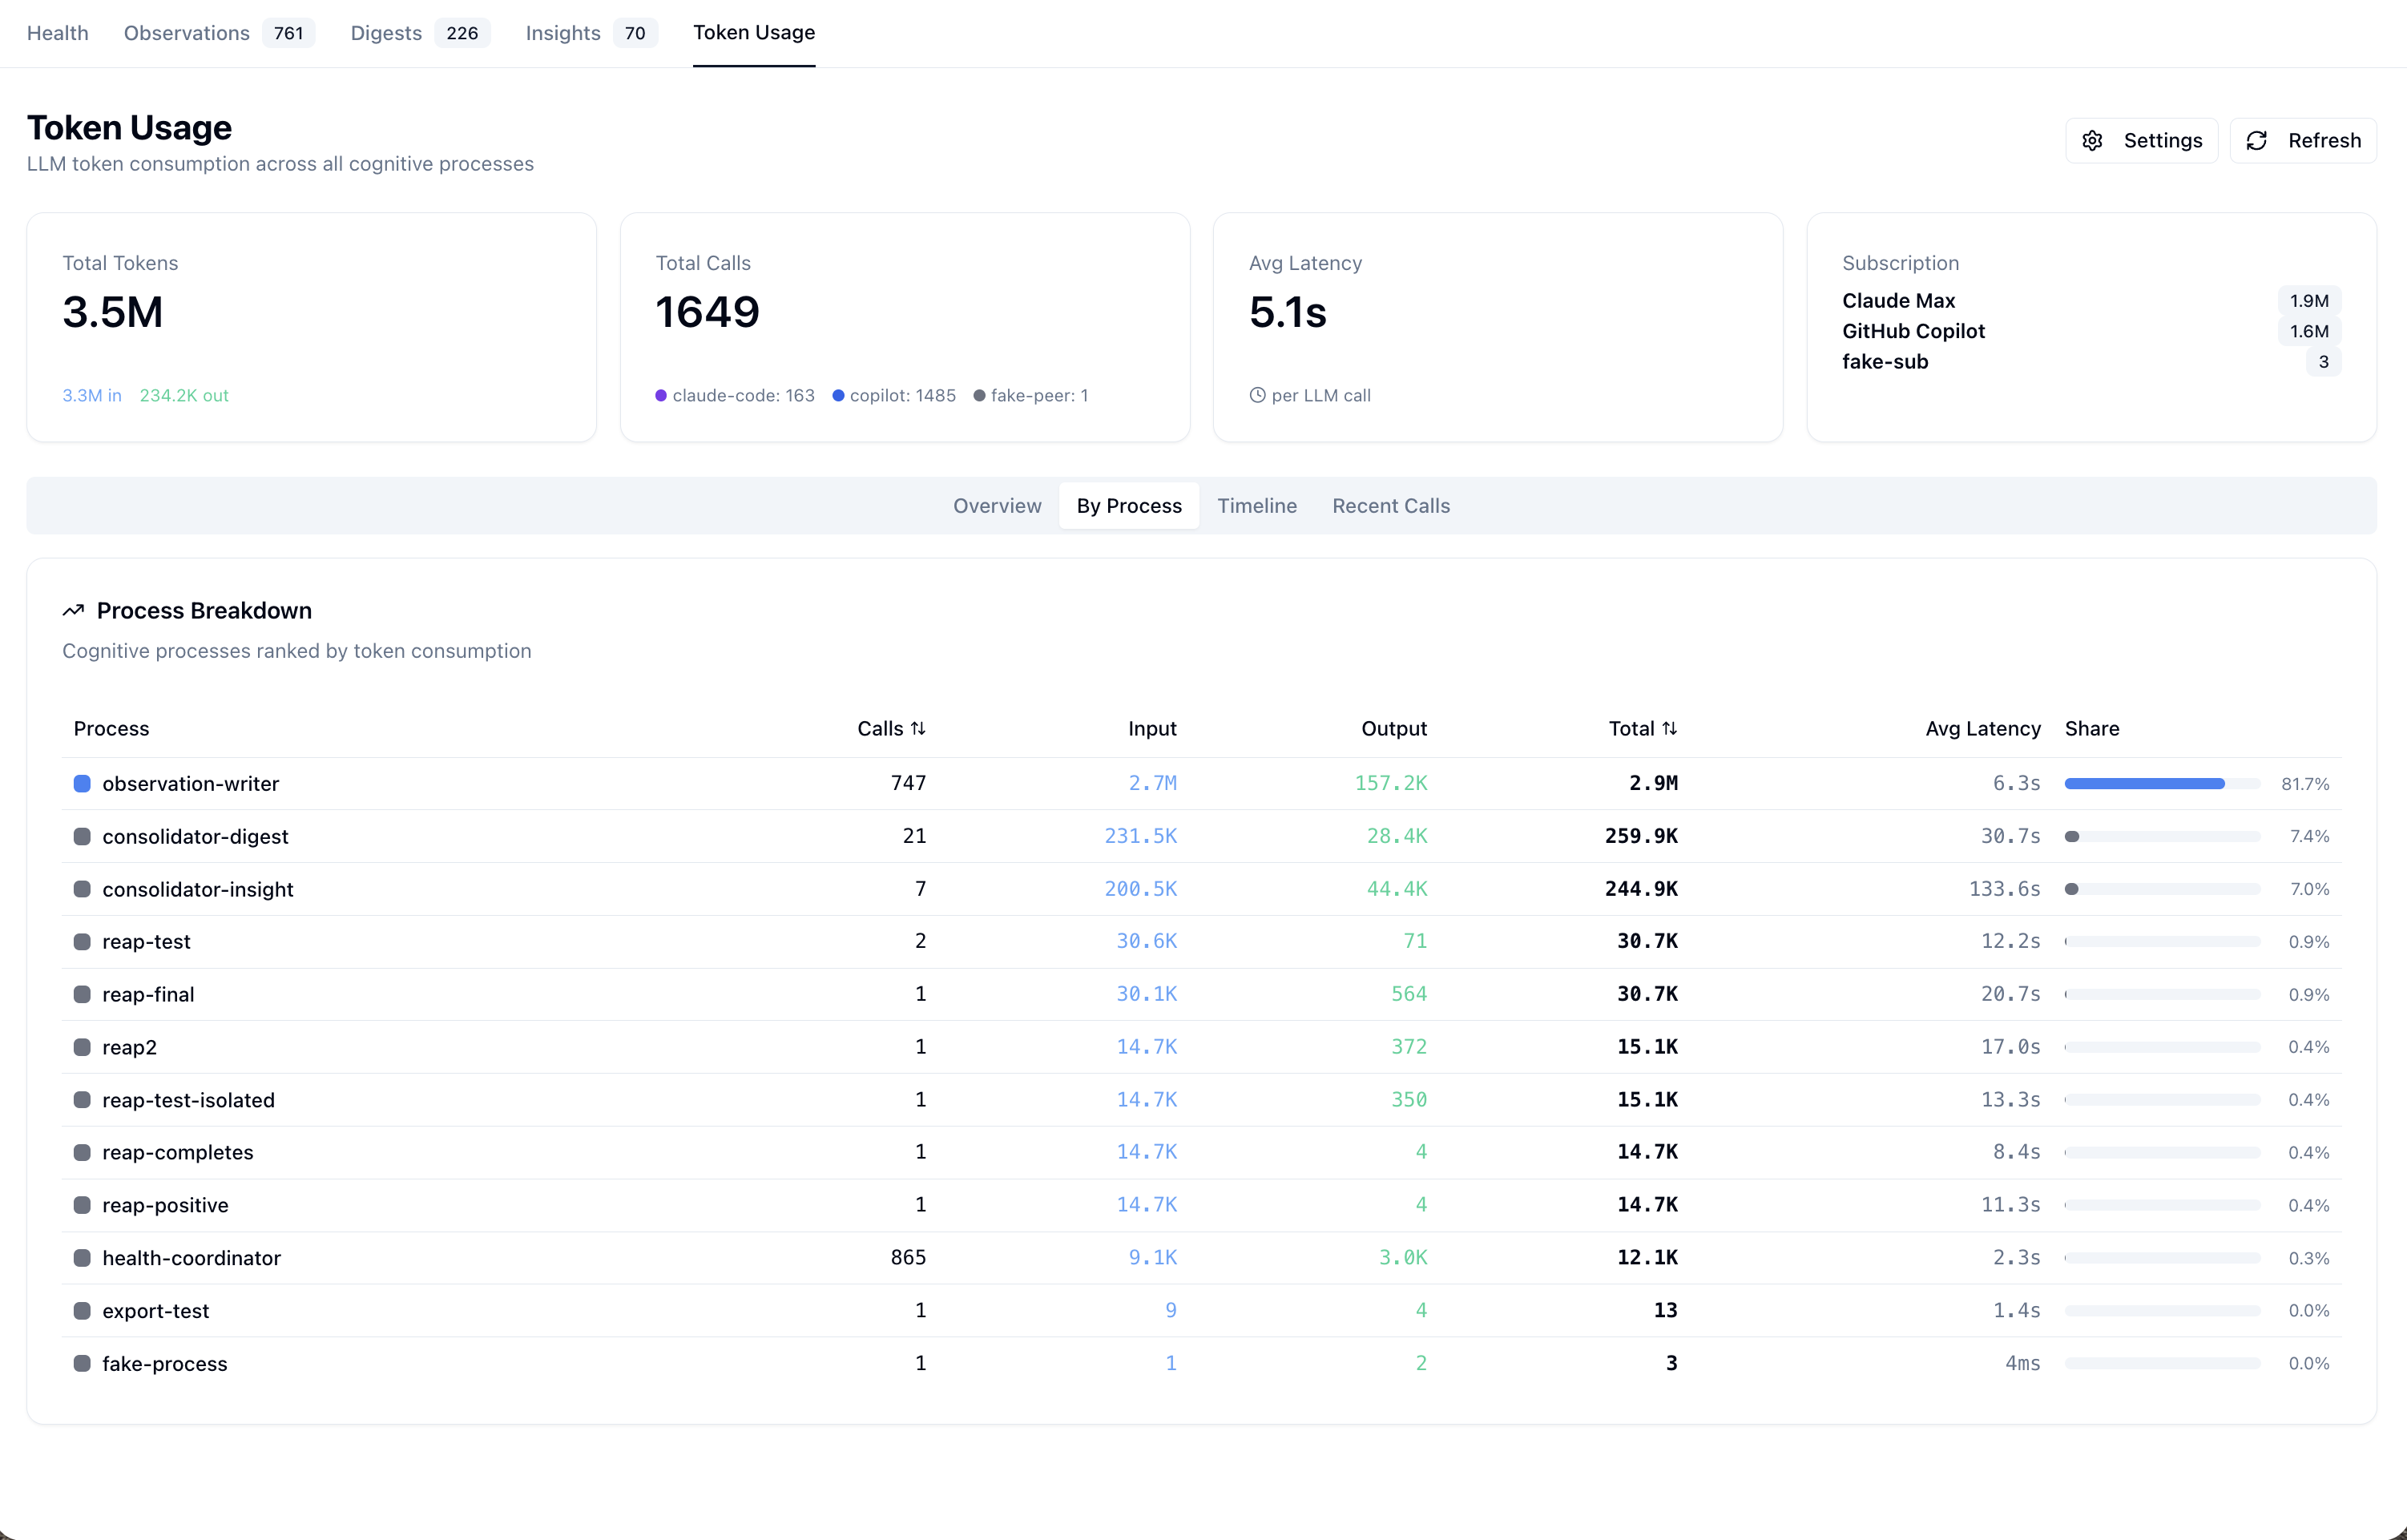
- Token Consumption by Process — a treemap where larger rectangles mean more tokens. Top of the page in the screenshot above shows
observation-writer(≈ 2.6 M tokens) dominating, withconsolidator-digestandconsolidator-insightas distant runners-up. Hover any box for a tooltip with process, total tokens, input/output split, call count, and avg latency — including the small boxes that don't fit an inline label. The same payload is also rendered as an SVG<title>element so screen readers and native-browser hover work even when the recharts tooltip is unavailable. - By Provider — a donut chart split by provider (claude-code 67 % / copilot 33 % under normal conditions on this host).
- By Model — the same totals broken down by canonical model name (
claude-haiku-4.5,claude-sonnet-5,claude-opus-5). The proxy canonicalizes whatever spelling each upstream returns —claude-sonnet-4-6(Claude CLI dash-version),claude-sonnet-4.6(Copilot dot-version),Claude Sonnet 4.6(Anthropic title-case), baresonnet(CLI fallback whenmodelUsageis empty),claude-haiku-4-5-20251001(Copilot dated snapshot) all collapse to the same row. The raw upstream identifier is preserved per call in themodel_rawcolumn.
Evolution tab
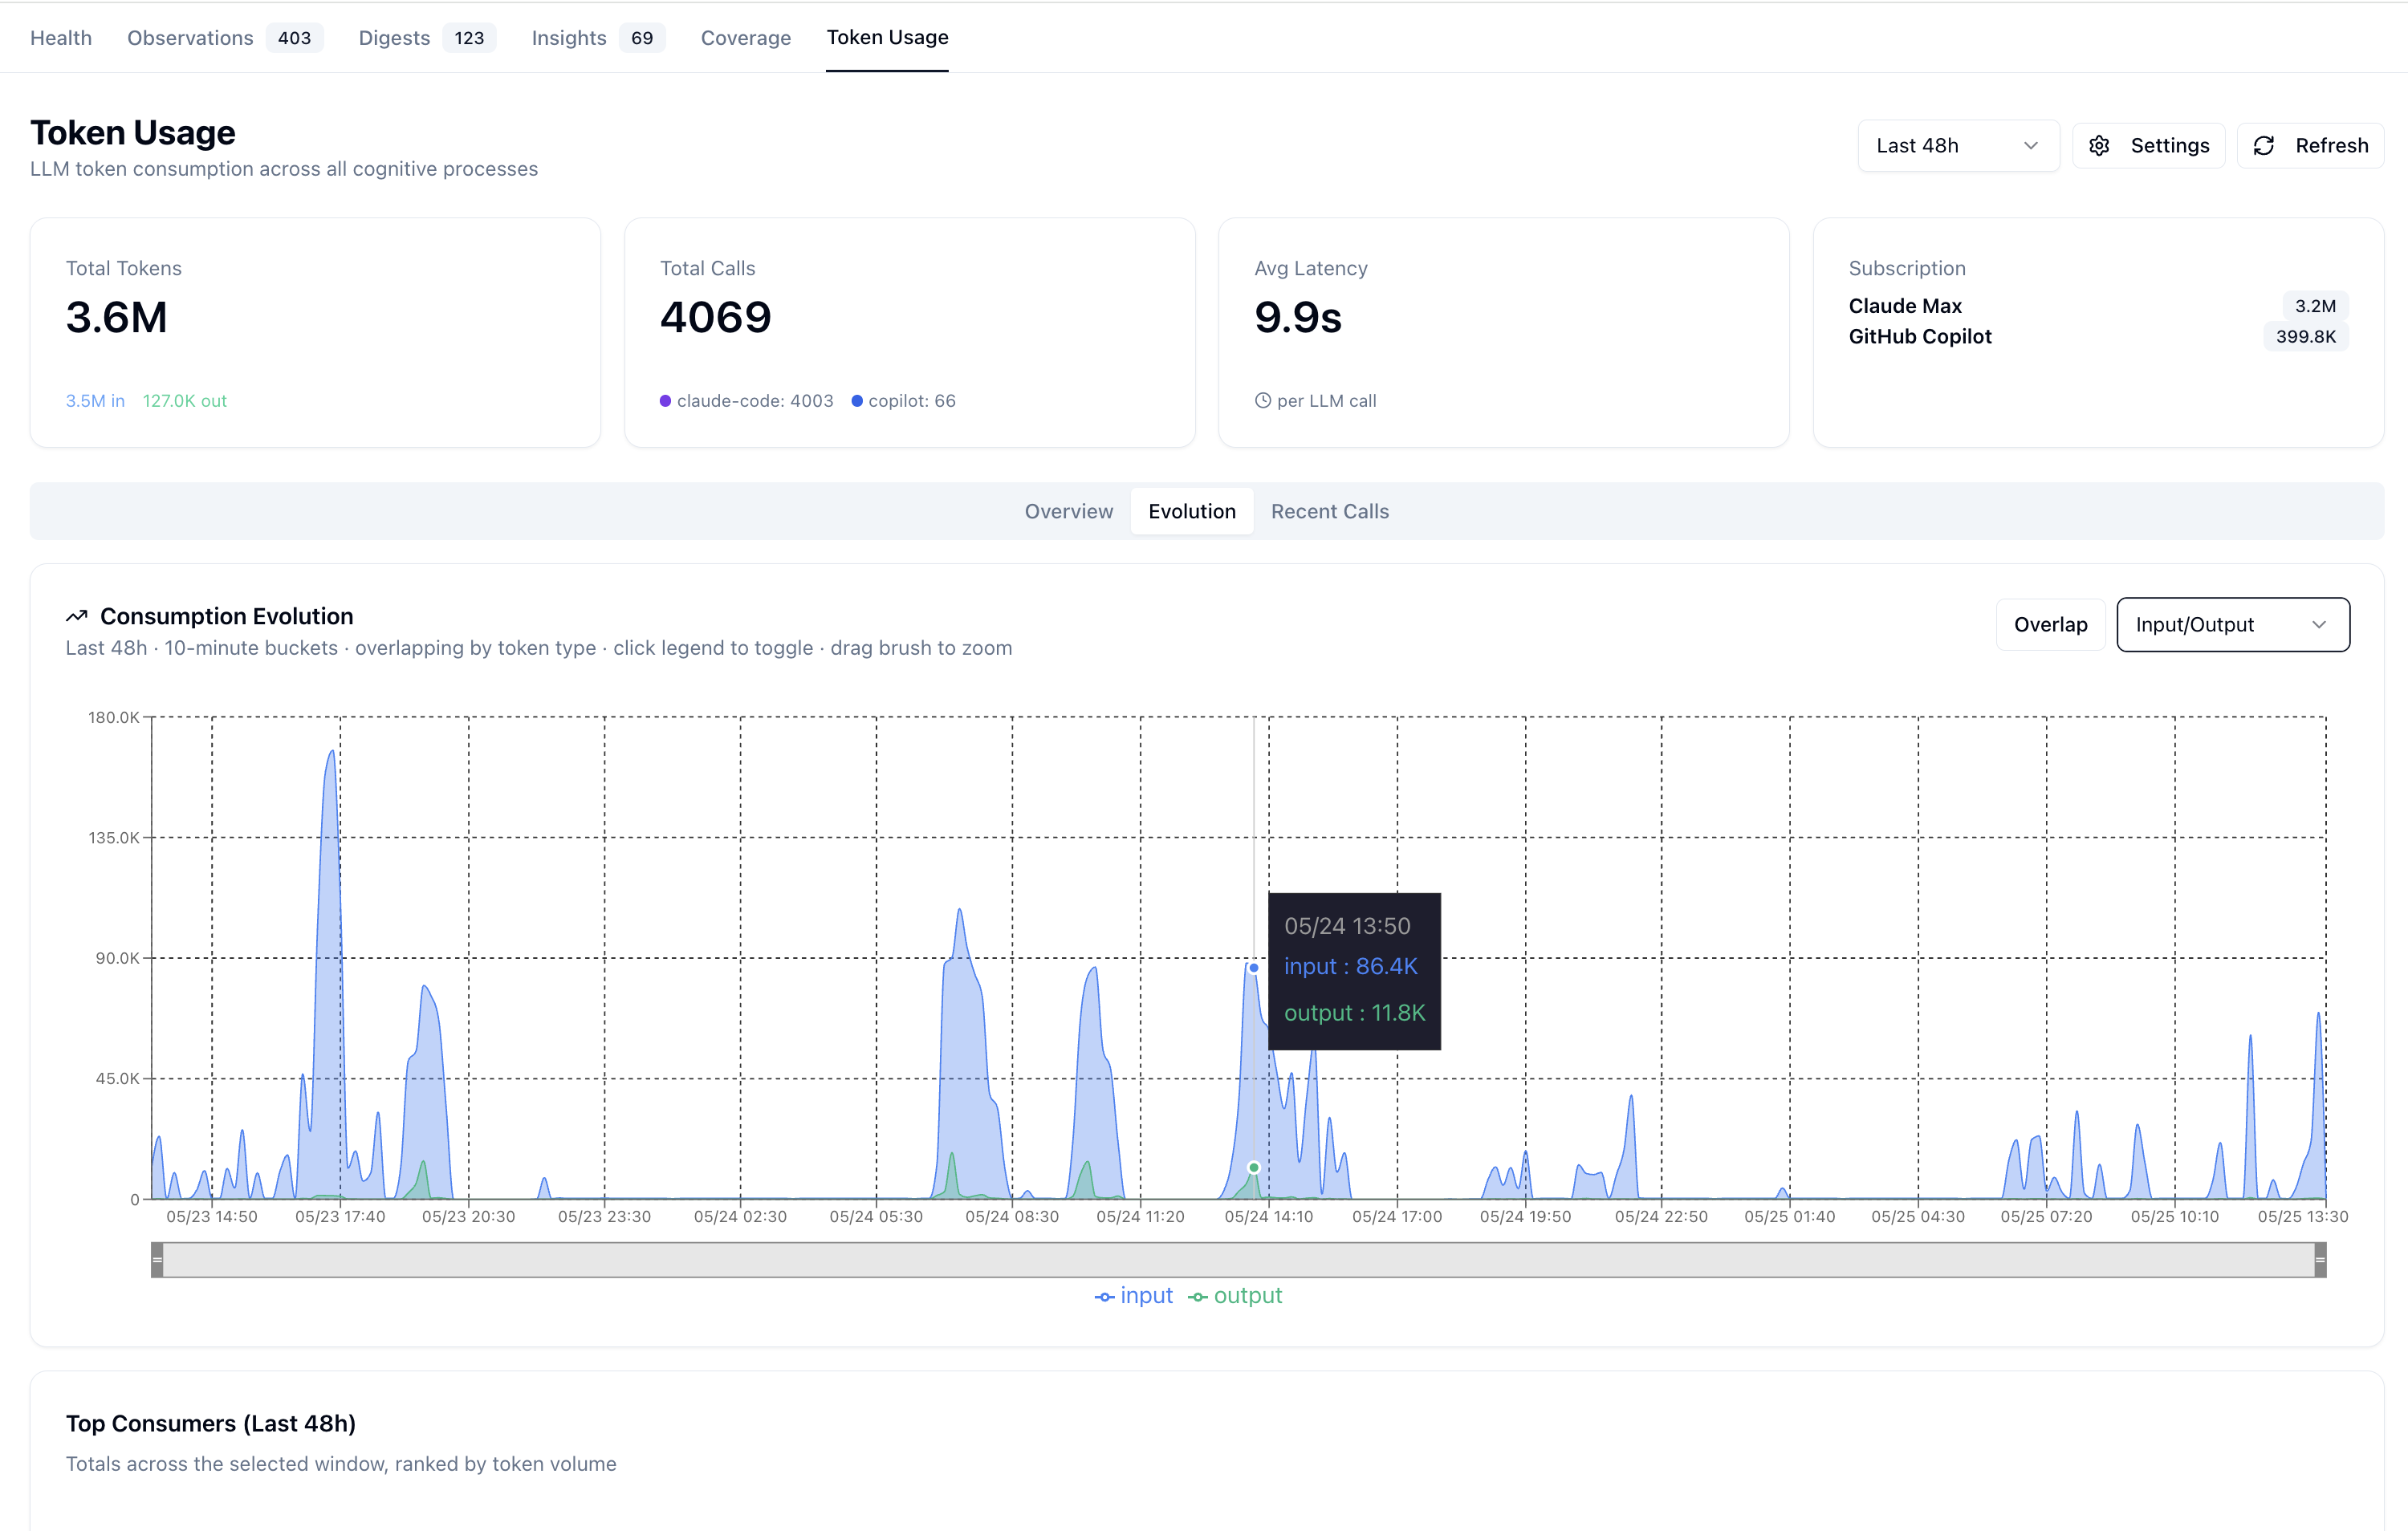
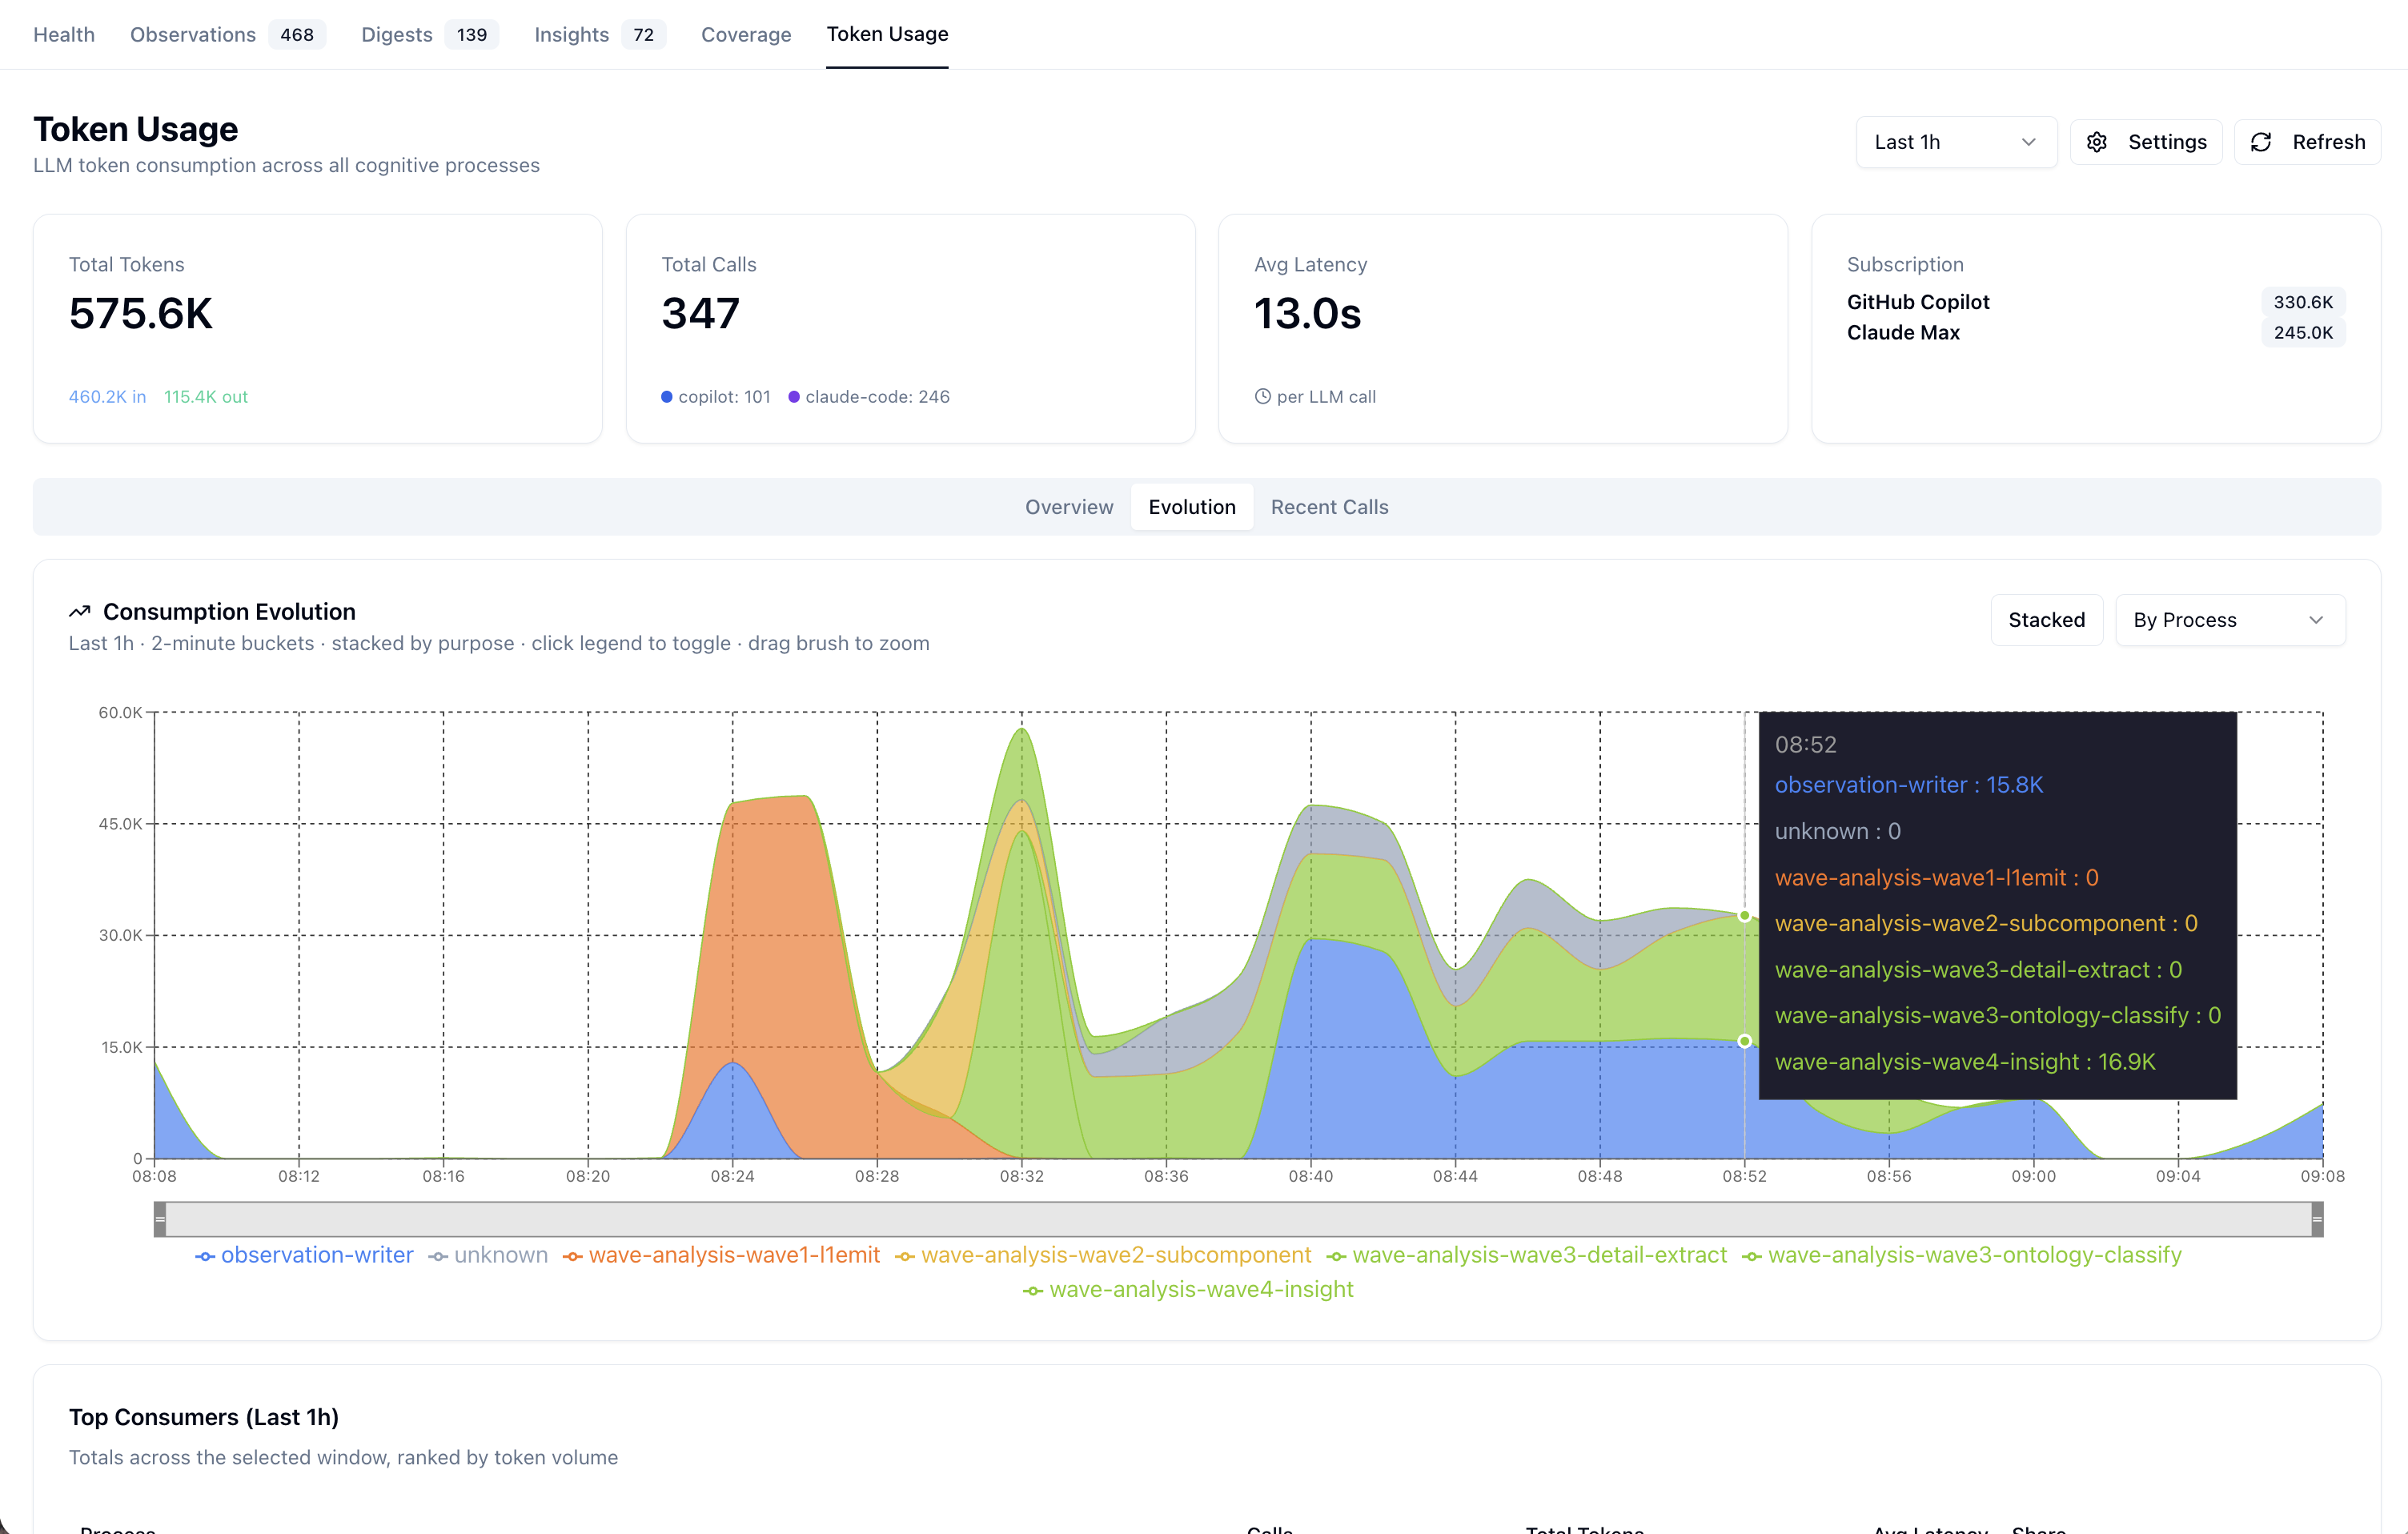
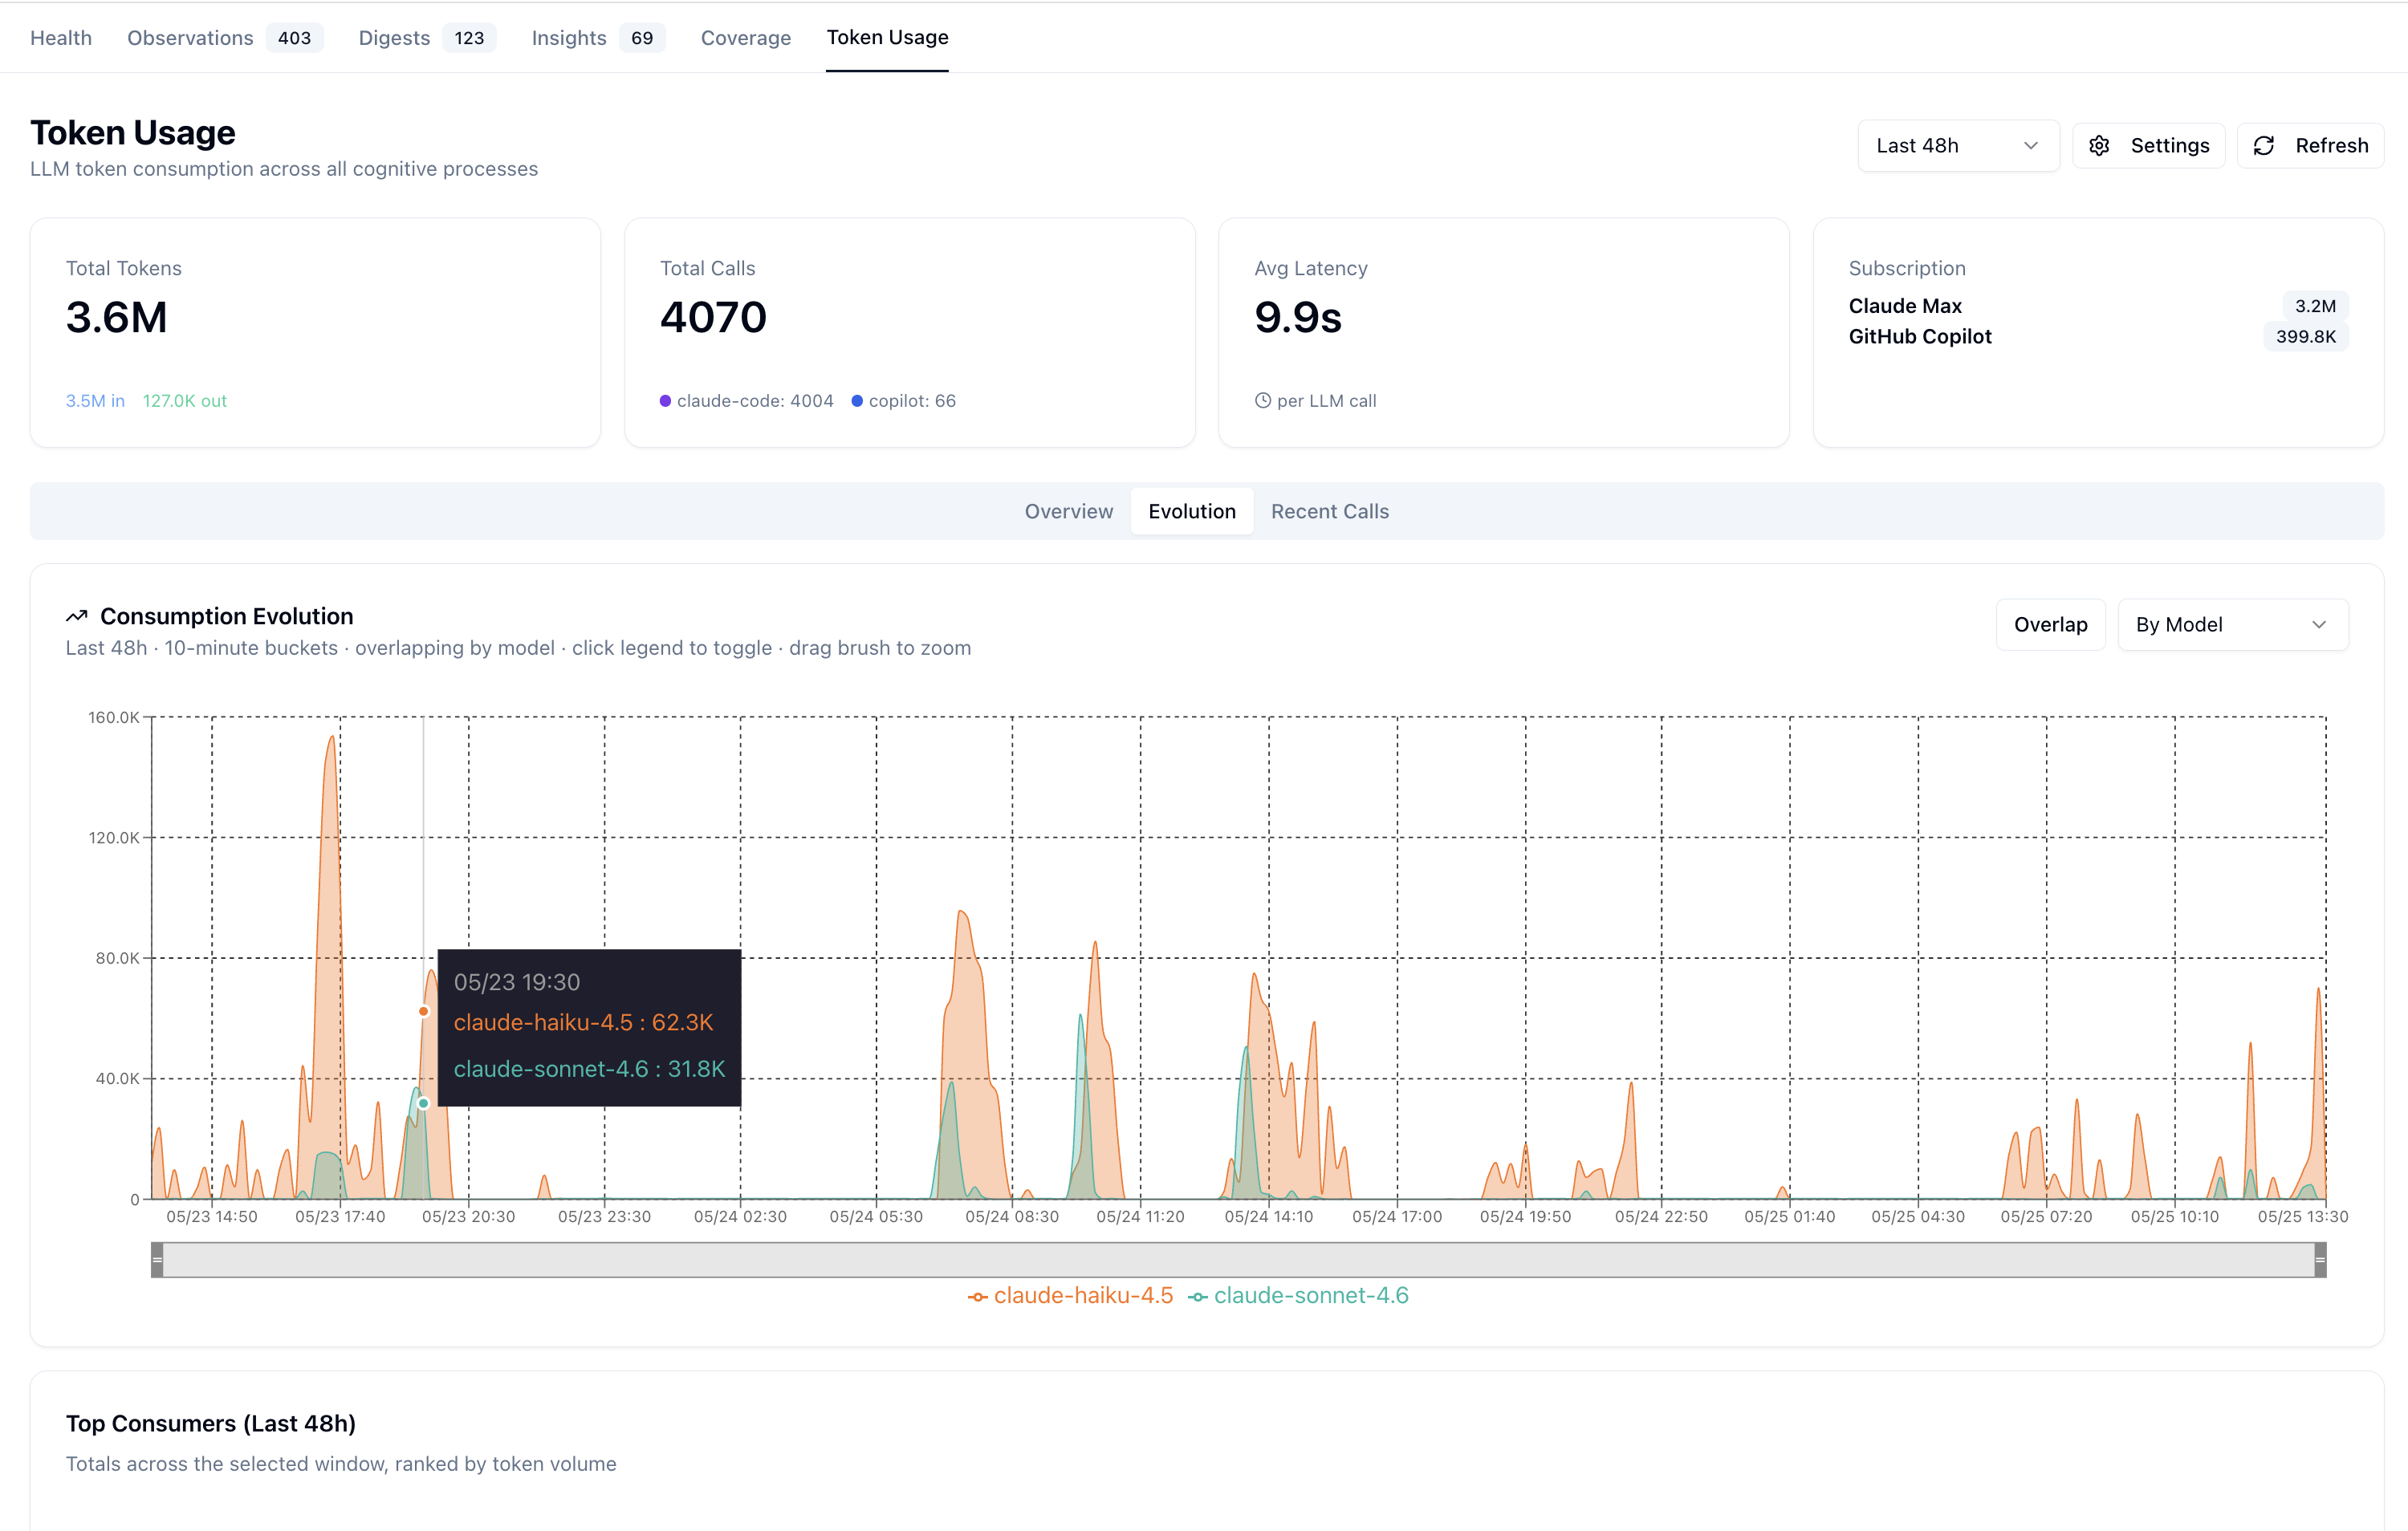
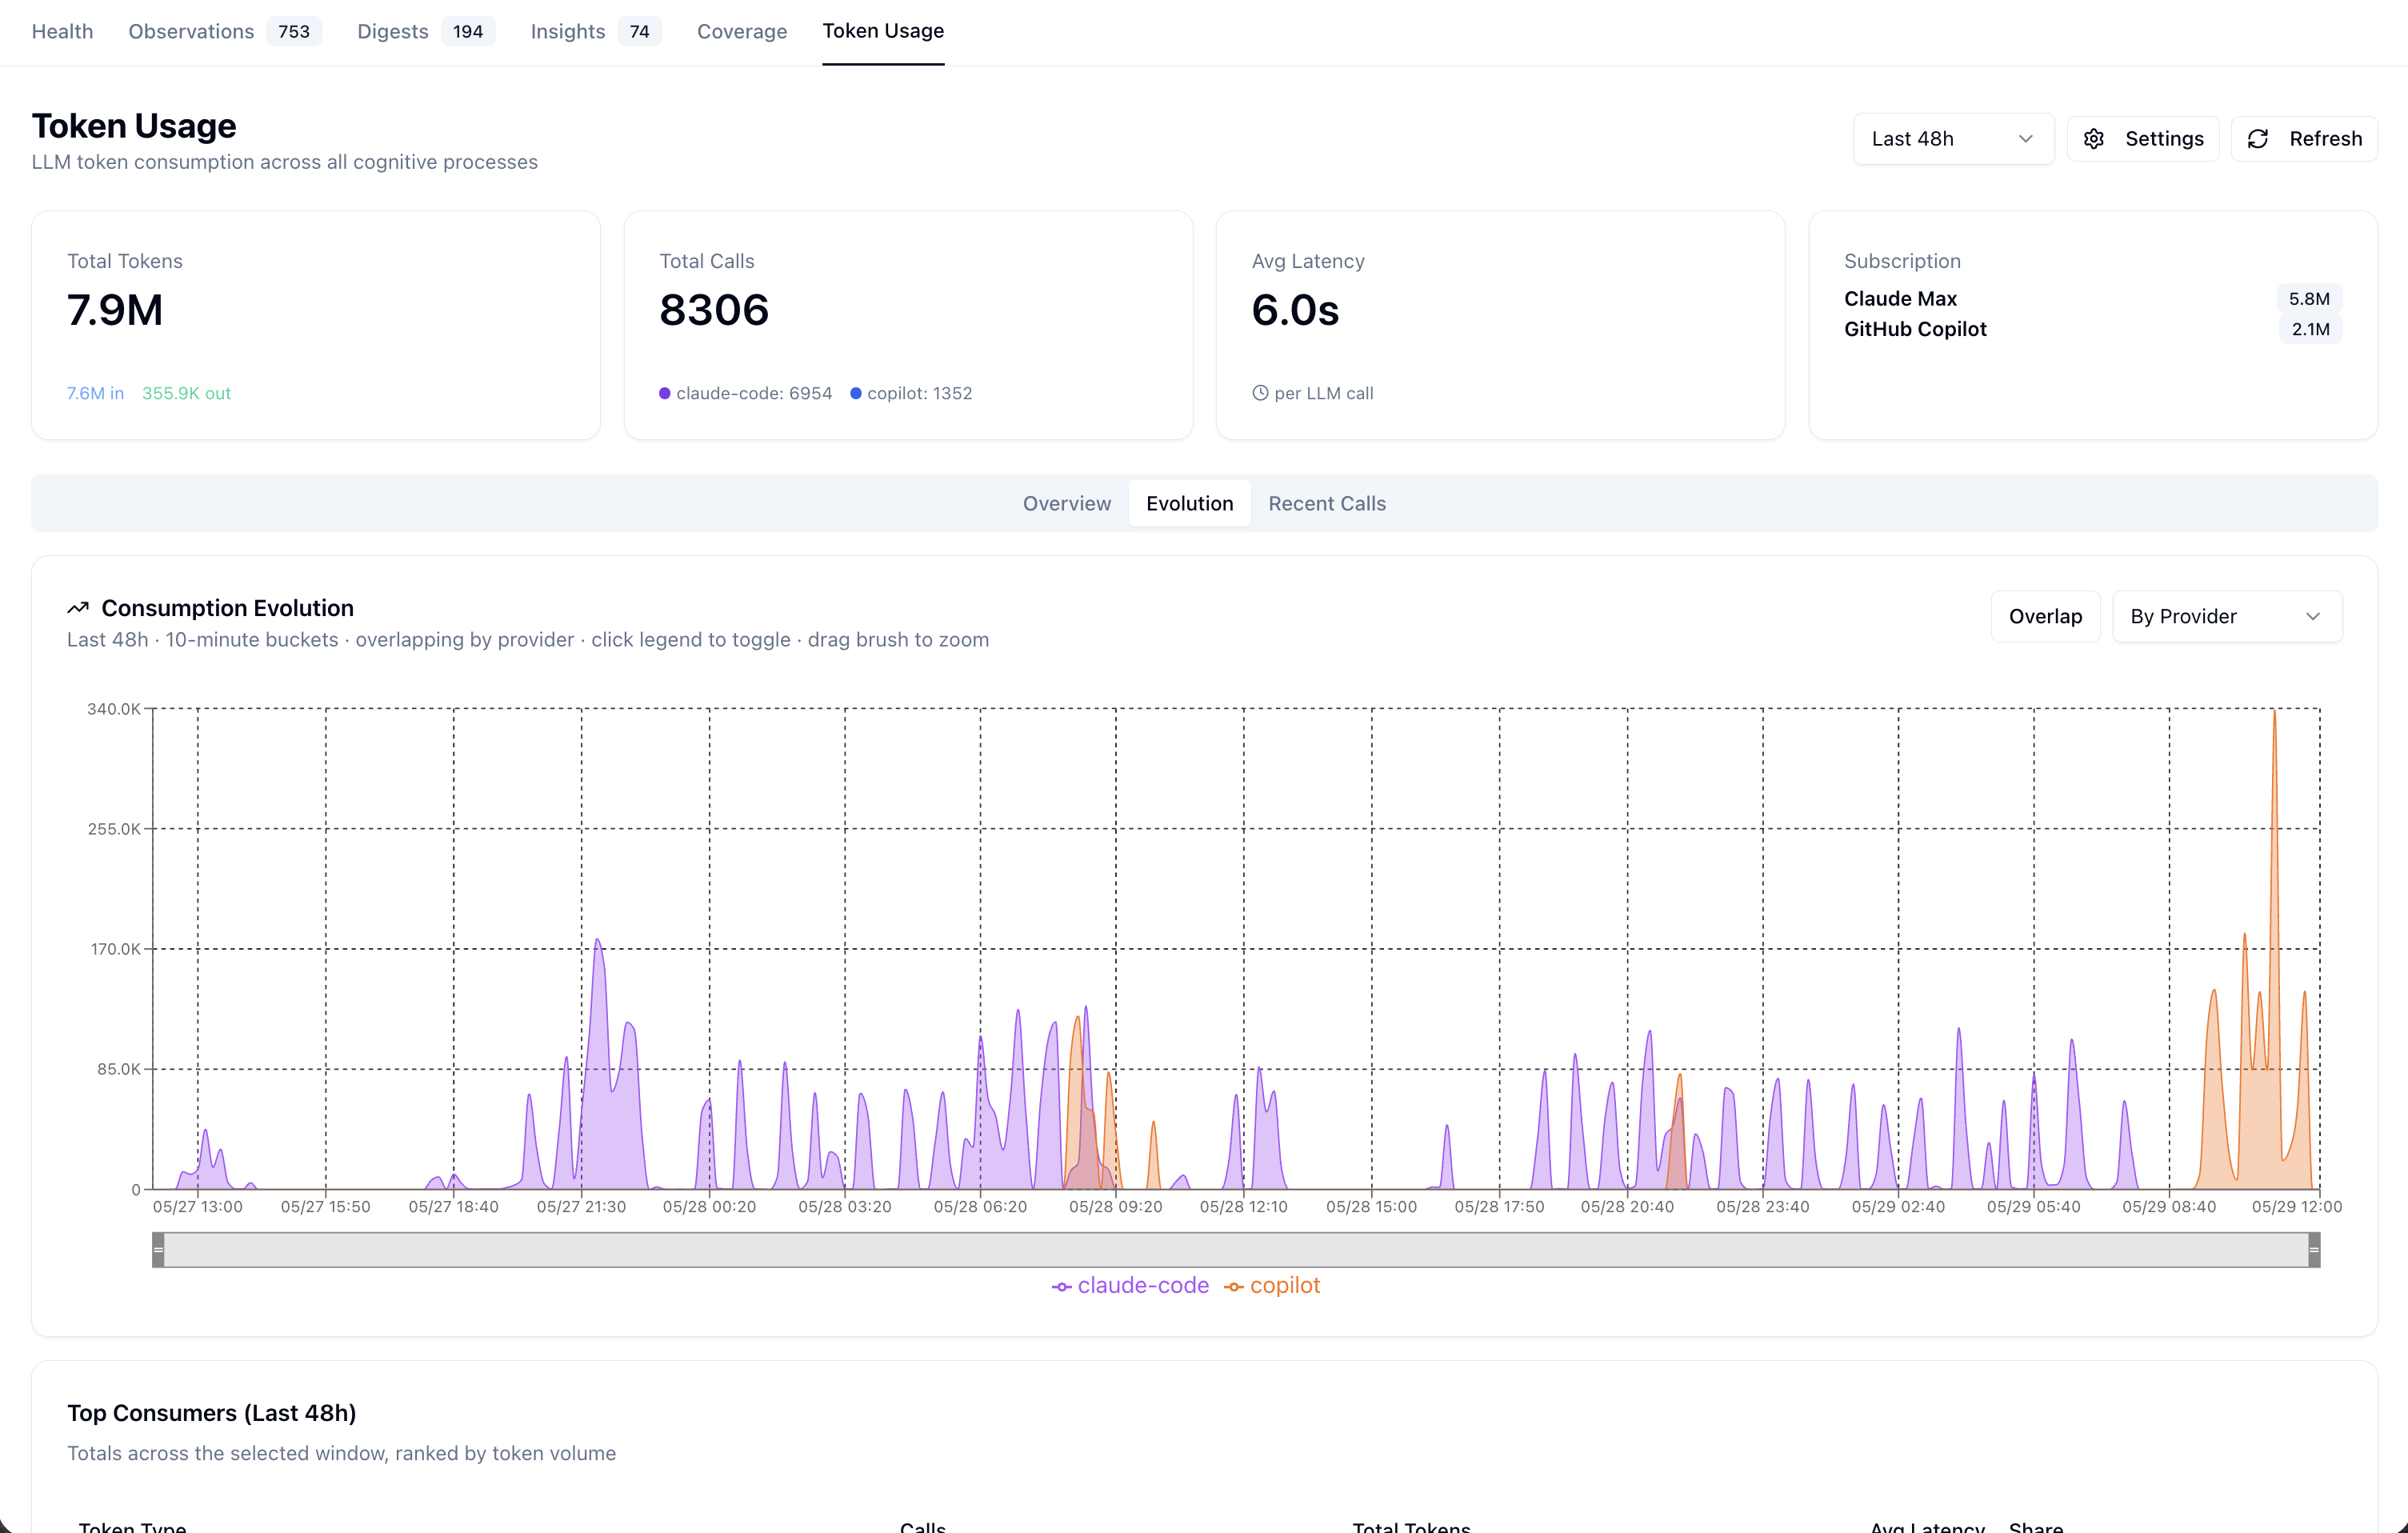
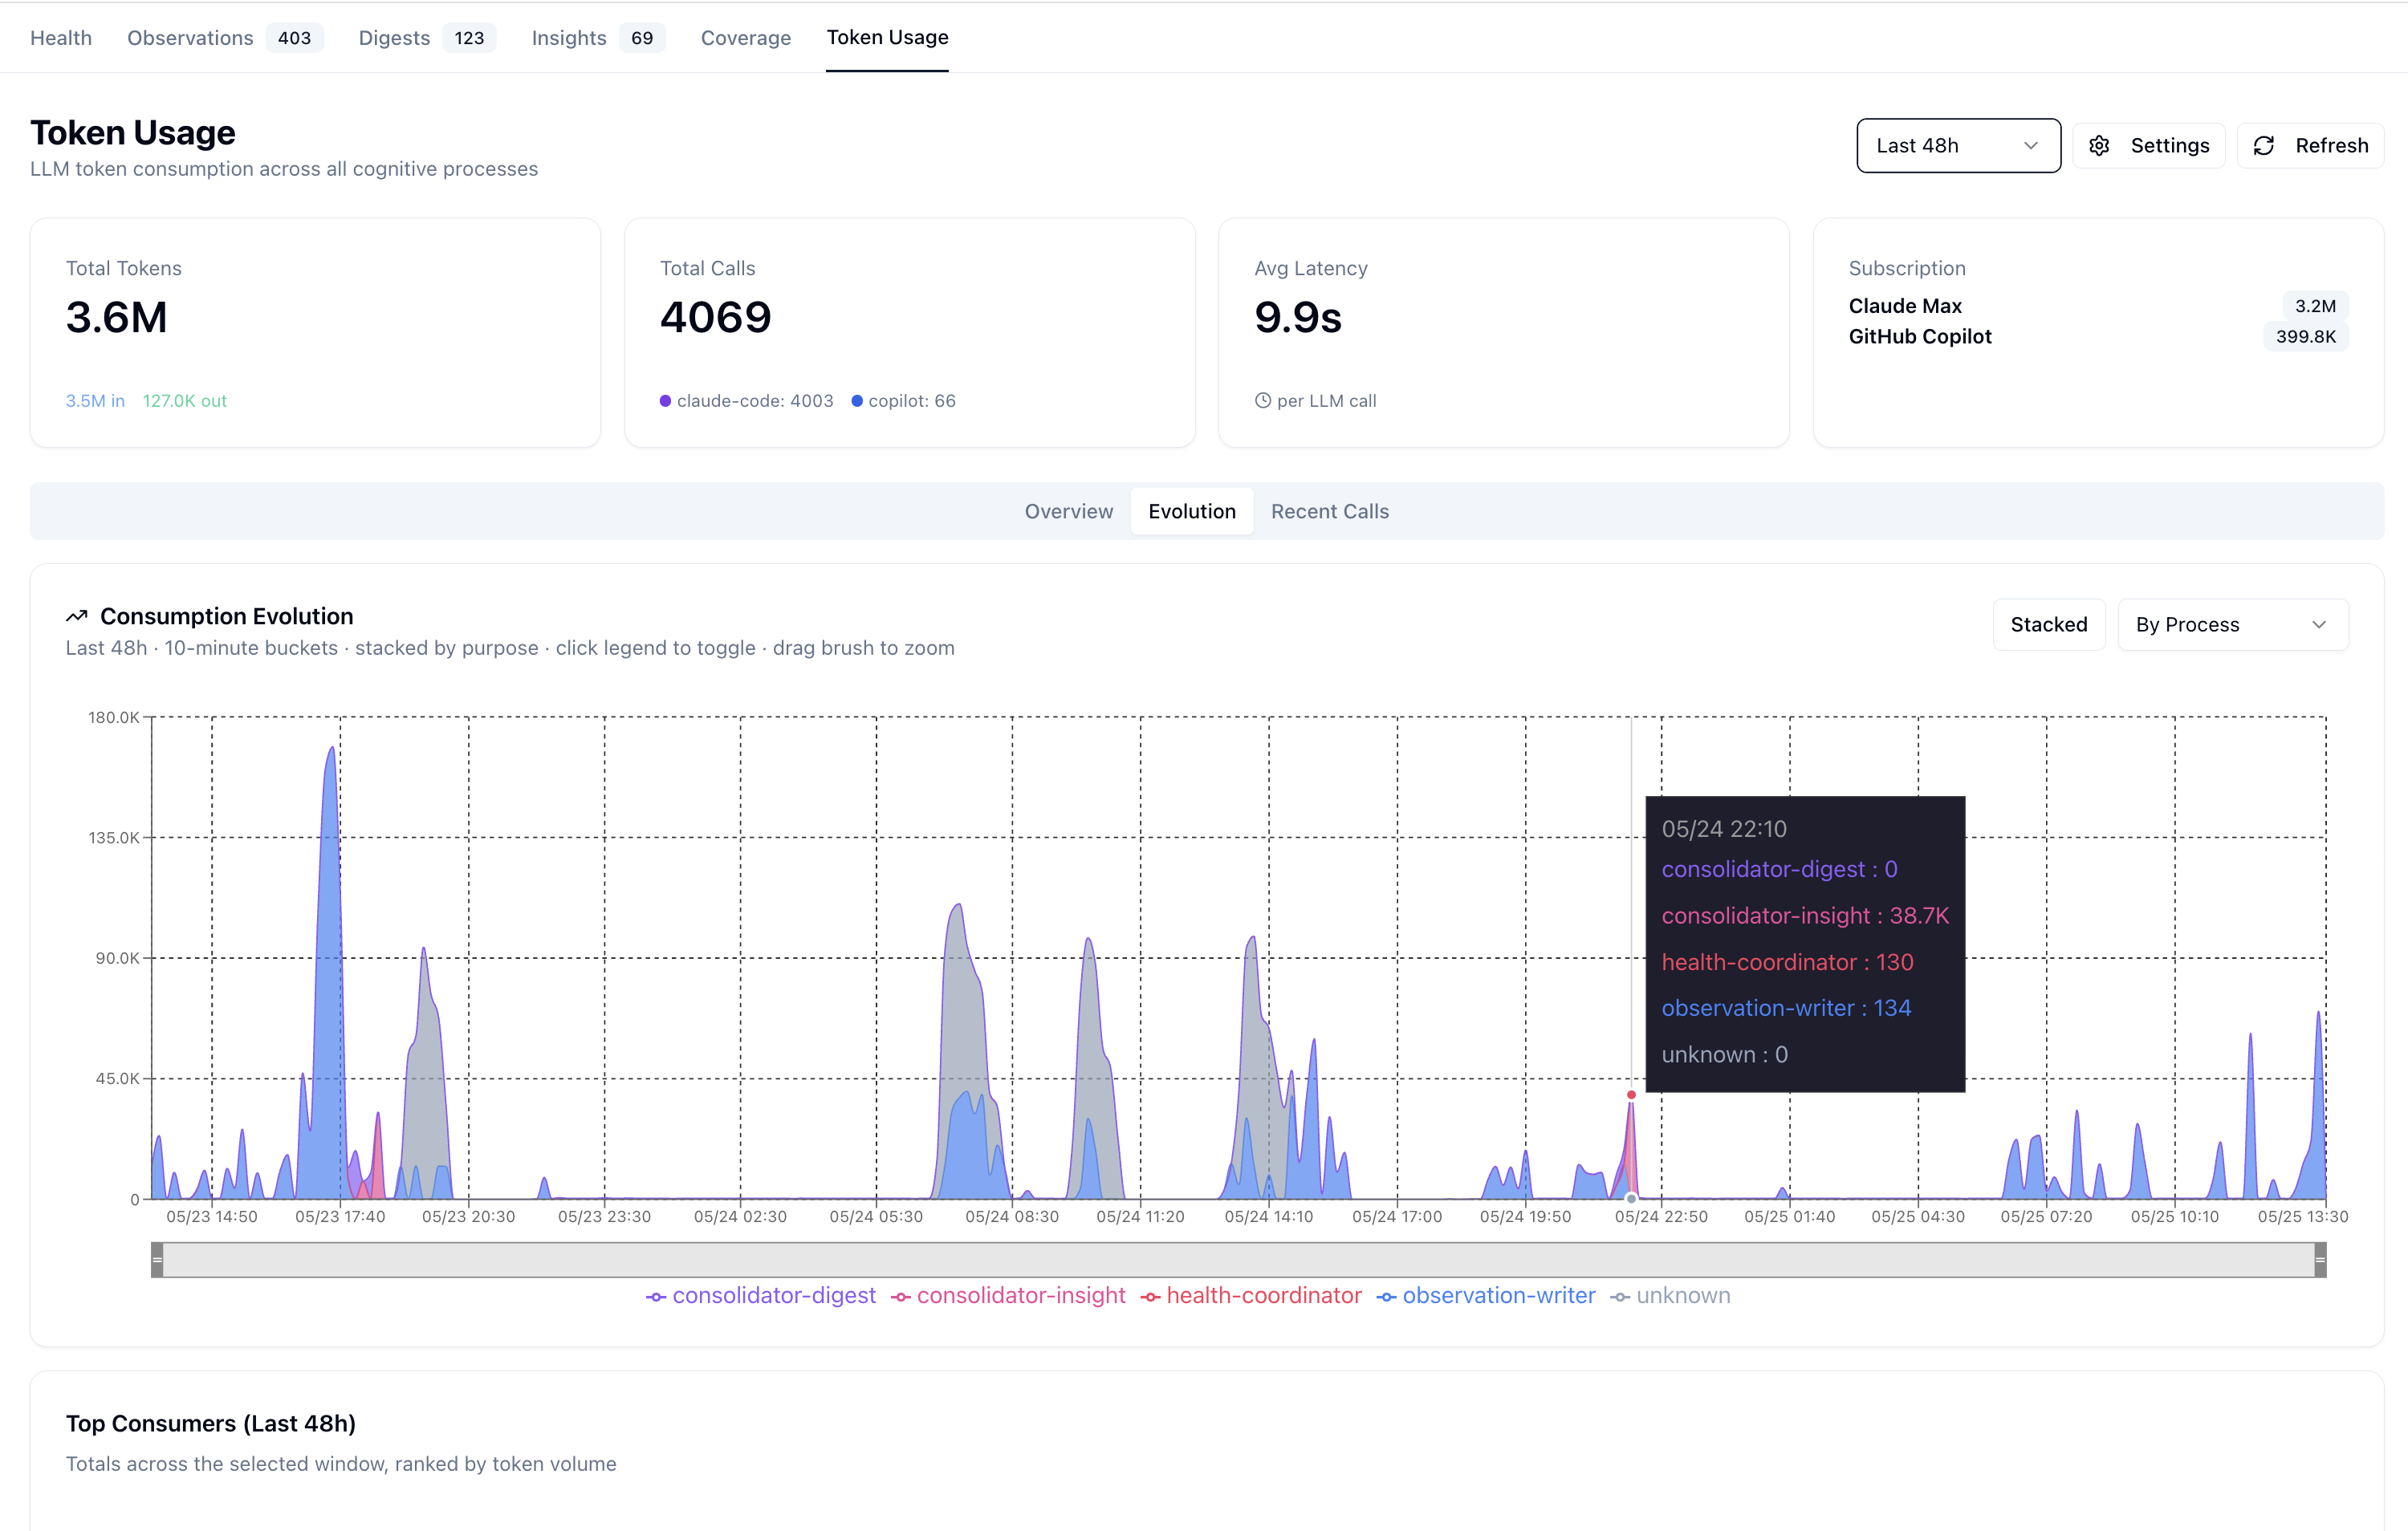
The Evolution tab answers "how does my consumption evolve over time, and who are the main consumers?" It renders a stacked area chart across the selected window with three independently-toggled axes — By Process, By Model, and By Tokens (in/out) — plus a Stacked / Overlapping render mode.
Stack axis toggle
The dropdown at top-right of the chart card switches what each band represents. Same window, same data, three lenses:
| Mode | One band per | Use when |
|---|---|---|
| By Process (default) | Cognitive process (observation-writer, wave-analysis-wave1, health-coordinator, …) | Identifying which subsystem is driving consumption |
| By Model | Canonical model name (claude-haiku-4.5, claude-sonnet-5, claude-opus-5) | Assessing the model mix and per-model spend |
| By Provider | The account that gets billed (claude-code-max, gh-copilot, anthropic-api) | Seeing which account is serving the traffic — useful after routing changes, and the only view that separates flat-rate subscription spend from metered API spend |
| By Tokens (in/out) | input_tokens vs output_tokens only | Tracking prompt-bloat vs generation share — this is what the retired Timeline tab used to show |
Design rules
- Main-consumer threshold. The chart only renders series contributing ≥ 0.5 % of the window's total tokens. Test/diagnostic processes (
reap-test,reap-final,fake-process,export-test, …) routinely satisfy> 0but contribute fractions of a percent — they're dropped here to keep the legend readable. The full unfiltered breakdown is still available via thesummary.process_keys/summary.model_keysAPI fields for callers that want it. - Stable colors per process / model. Canonical processes (
observation-writer,consolidator-digest, etc.) keep the same color across every chart on the page viaPROCESS_COLORS. Unmapped processes (e.g.wave-analysis-wave1/wave2/wave3) fall through to a deterministic hash → SAFE_EVOLUTION_PALETTE mapping — every key gets a stable slot across re-renders, never the all-gray fallback that used to make competing stacks indistinguishable. The same hash logic now drives the Overview Treemap and Recent Calls left-border, so the legend you learn here matches across every panel. - Adaptive bucket size. Driven by the header time window. The bucket-minutes value is echoed in the card subtitle so the reader can sanity-check the granularity.
Below the chart, Top Consumers is a compact table showing each visible series's total tokens in the window plus its share bar — same data the chart stacks, but in tabular form so you can read exact totals without hovering through the chart.
Recent Calls tab
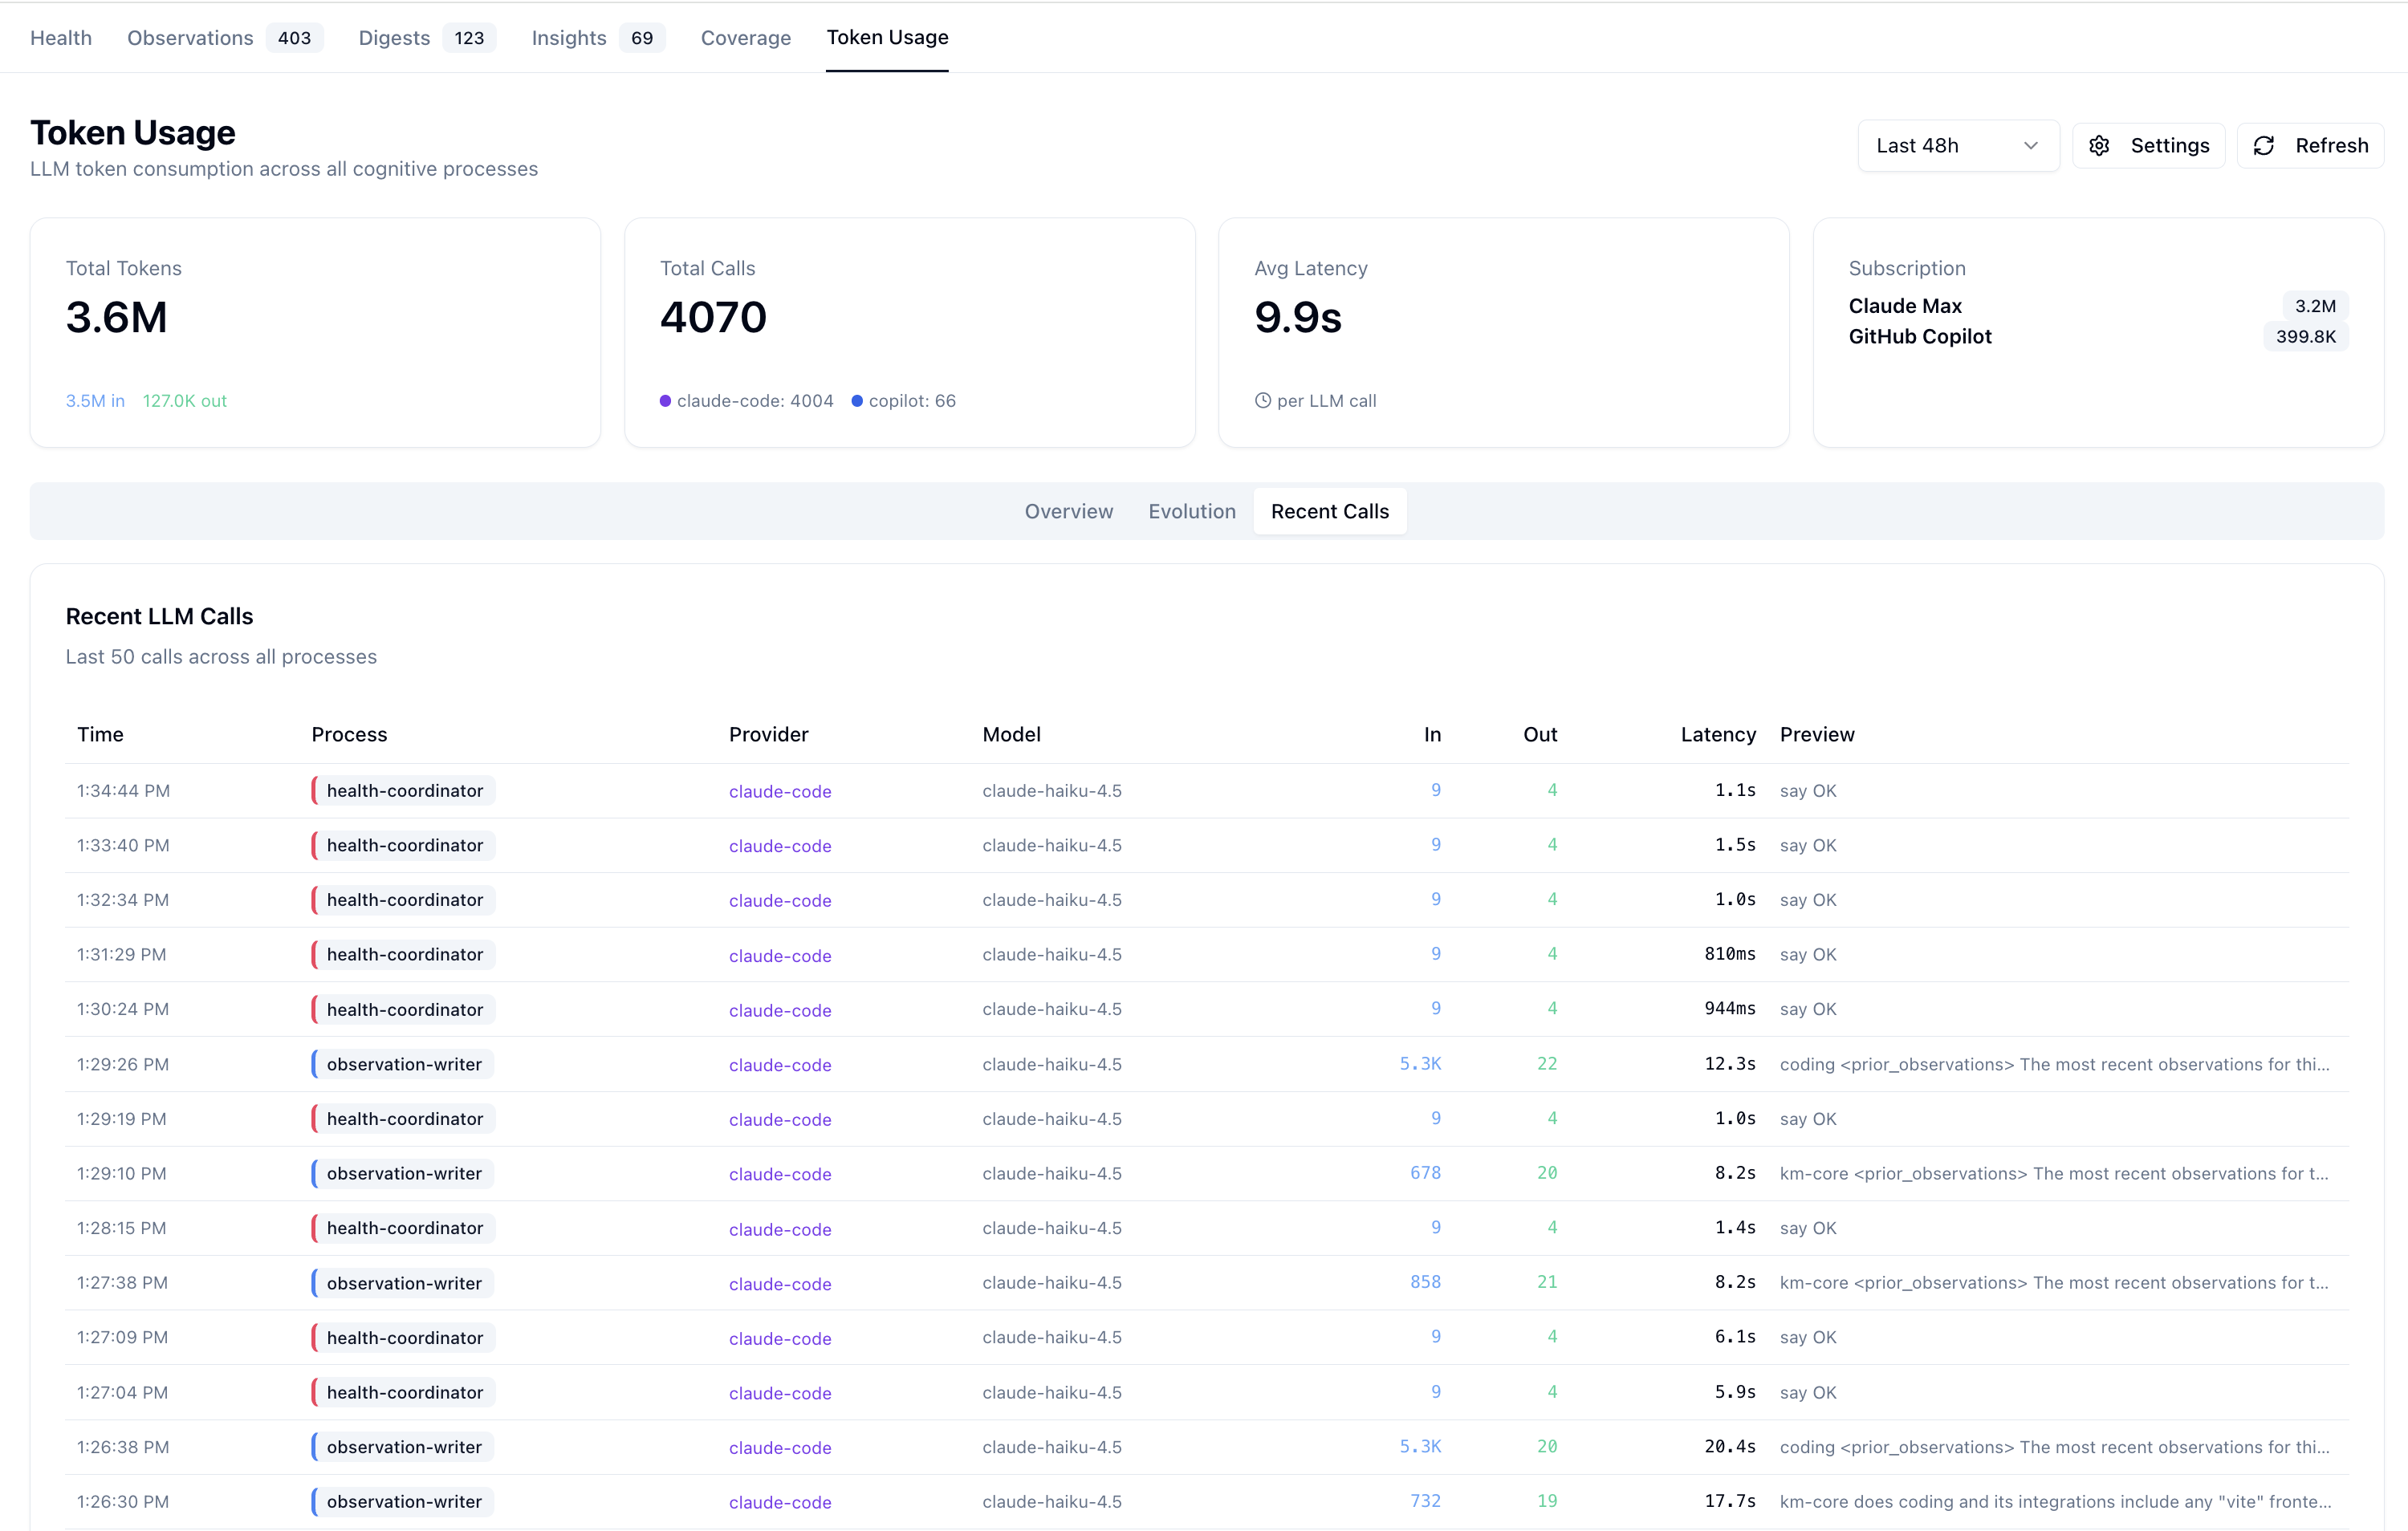
Latest 50 calls across all processes. Columns: Time · Process · Provider · Model · In · Out · Latency · Preview. The Preview column shows the leading characters of the prompt with any XML wrapper tags (<system-prompt>, <task>, <inputs>, etc.) stripped — those wrappers swallowed most of the visible width before the fix and made the column unreadable.
Where routing is actually configured
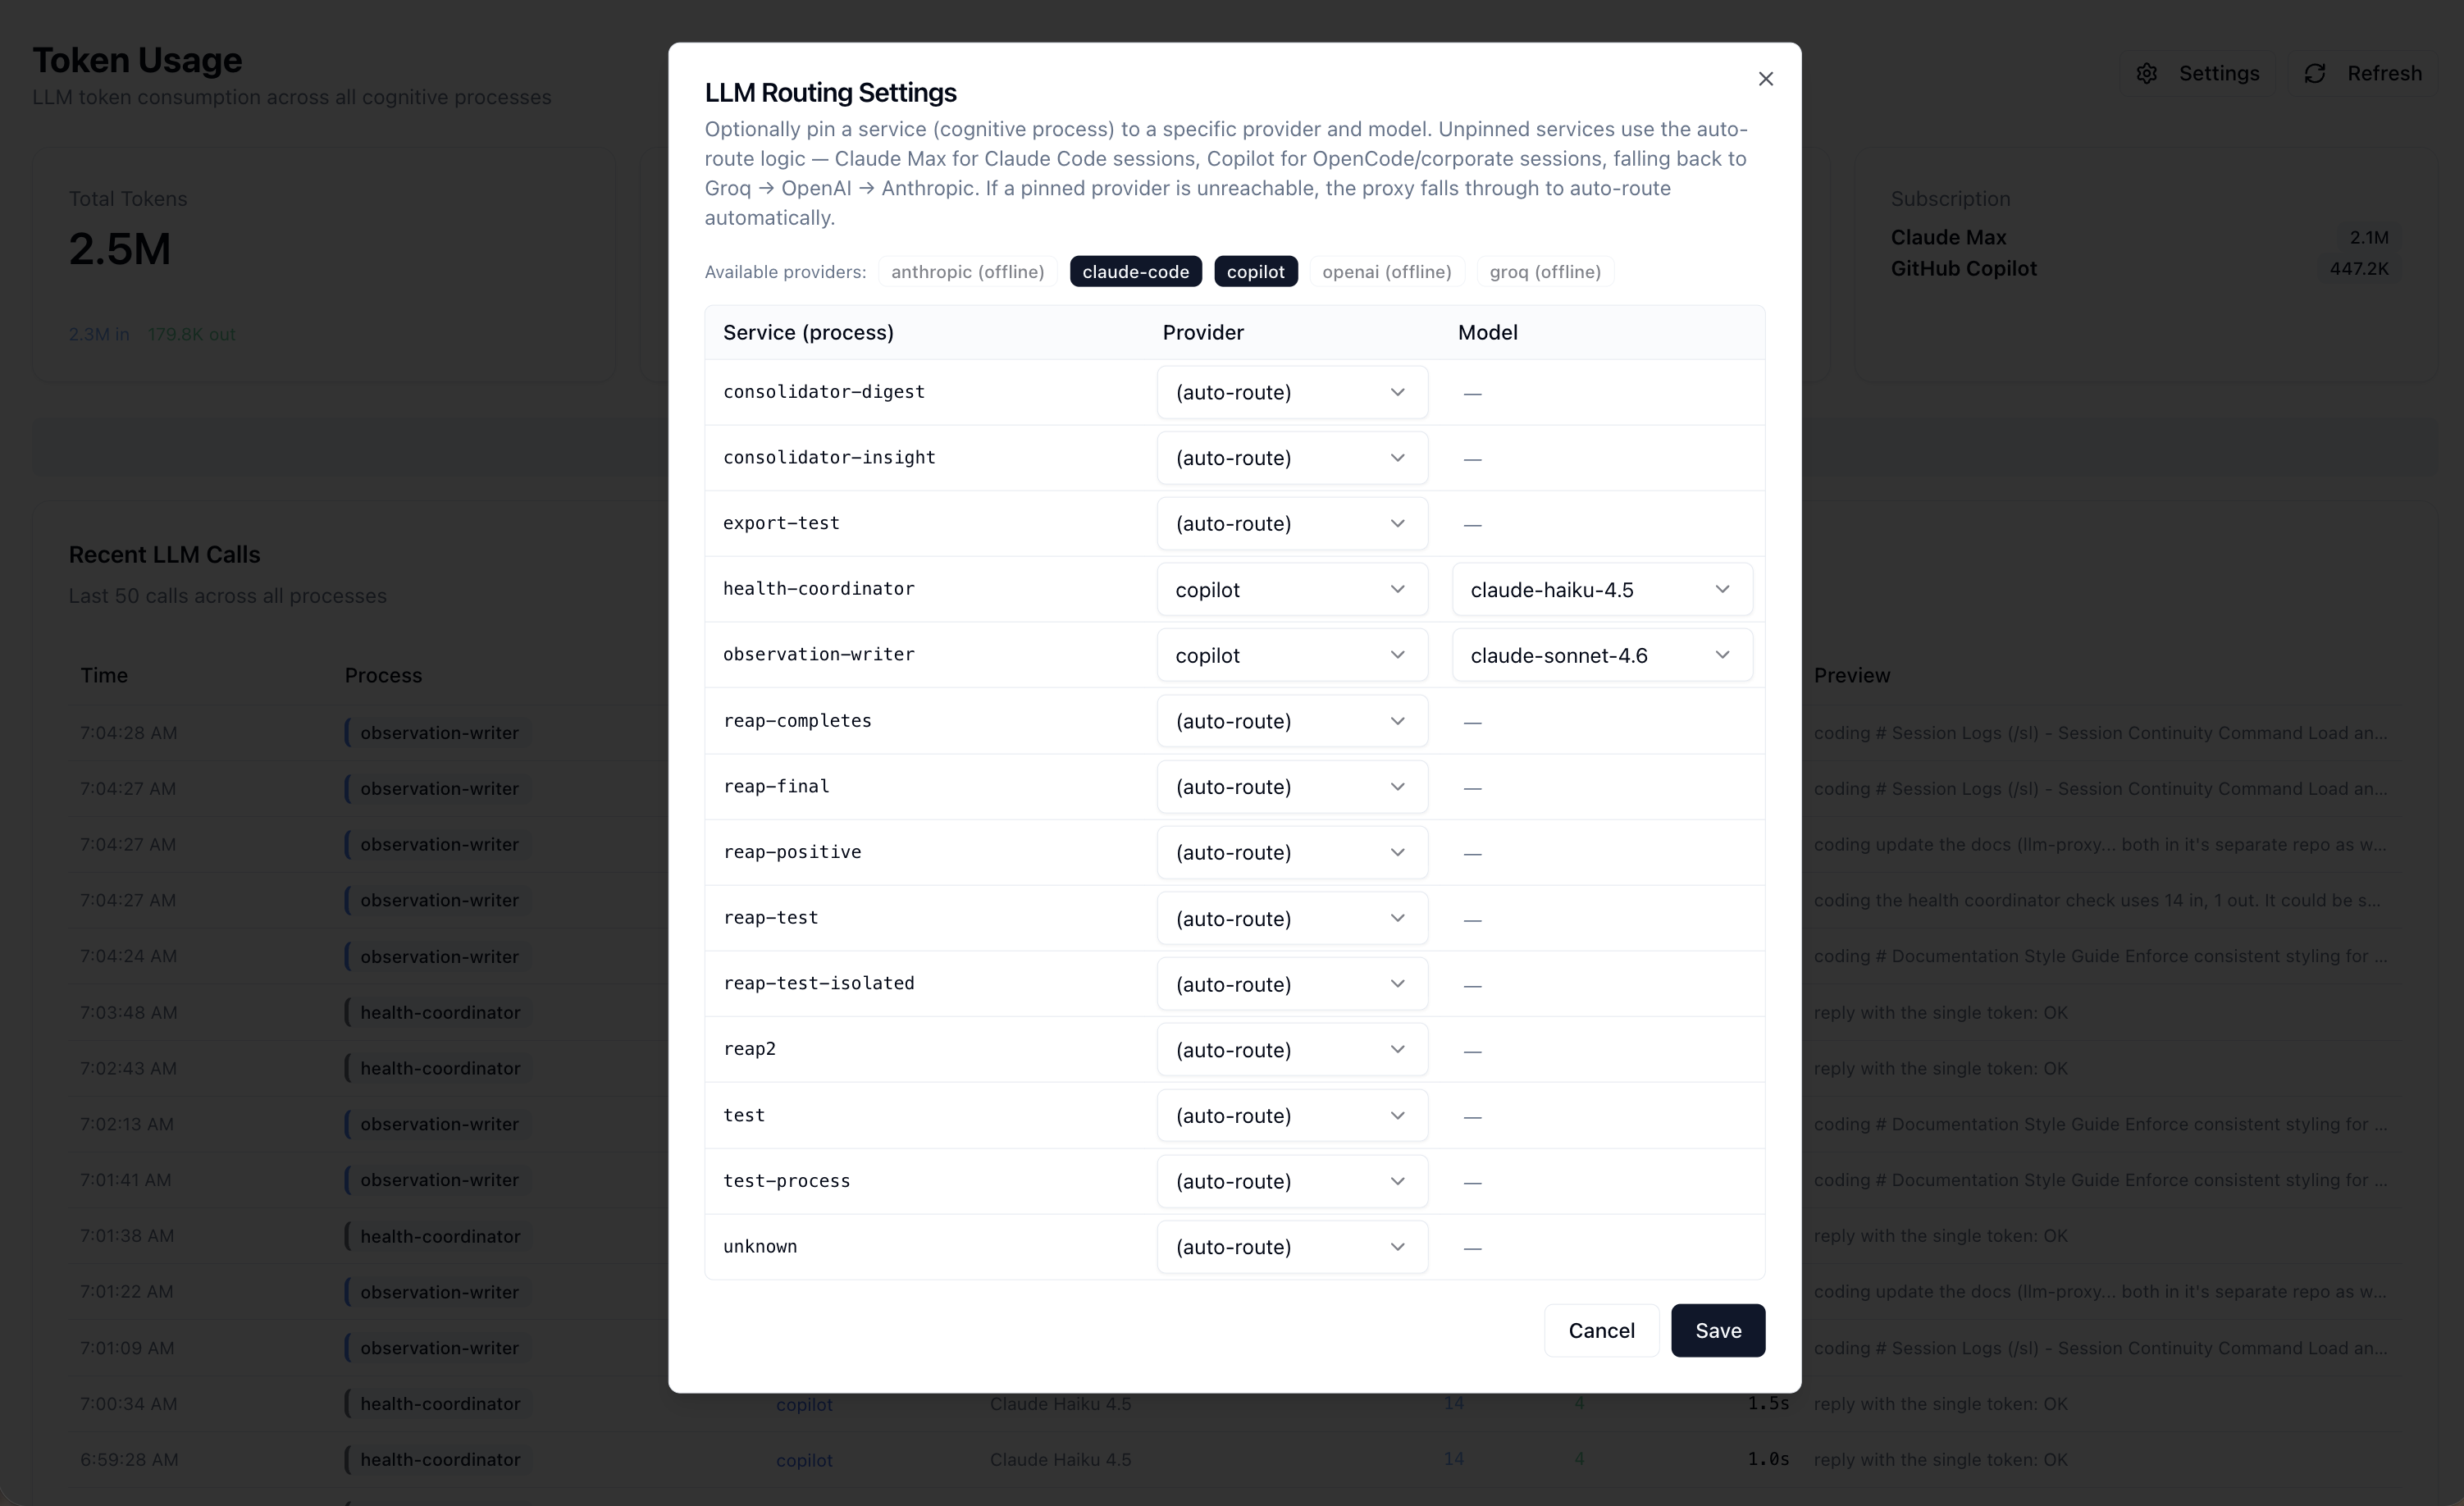
Routing lives in two version-controlled YAML files in the rapid-llm-proxy repo — config/llm-routing.yaml (which provider and complexity band serves a given job) and config/llm-fallback.yaml (what happens when that provider cannot). Both hot-reload on save. LLM Routing documents the whole mechanism; the ⚙ button on this page opens its editor.
Per-process pins no longer route anything
This section previously described the ⚙ dialog as pinning individual services to a provider and model, with those pins acting as a hard override. That mechanism is dead.
The legacy surface is still there and still answers: GET /api/llm/settings returns 200, and .data/llm-proxy/llm-settings.json — note the filename, not settings.json — still holds 26 processOverrides entries. Nothing consults them.
Demonstrated rather than asserted. The stored pin for wave-analysis-wave1 is copilot/claude-sonnet-4.6; asking the proxy what it would actually do gives:
$ curl -s 'localhost:12435/api/llm/routing/resolve?job=bg-wave-analysis-wave1' | jq -r .summary
bg-wave-analysis-wave1 (step 2) -> gh-copilot/claude-sonnet-5 > claude-code-max/claude-sonnet-5 > …
A different provider and a different model, with matchedKey: bg-wave-analysis-wave1 and complexitySource: "route bg-wave-analysis-wave1" — the YAML route, not the pin. Left in place rather than quietly deleted, because a stale file that still serves over HTTP is exactly the kind of thing someone rediscovers and trusts.
Available providers at the top of the dialog reflects the proxy's /health snapshot. Note that this legacy endpoint still reports the old provider spellings (claude-code, copilot, anthropic) while llm-routing.yaml uses the account names that replaced them (claude-code-max, gh-copilot, anthropic-api). The two name the same accounts.
Storage and the JSON-export pattern
The Token Usage page reads from a two-store setup that mirrors LSL's filesystem convention — git-trackable per-hour JSON files alongside an untracked SQLite WAL DB. Phase 36 moved the export away from a single monolithic JSON to a per-(date, time-window, user-hash) layout so multiple users sharing the project via git push their own hourly snapshots without merge conflicts:
| Path | Role | Tracked in git? |
|---|---|---|
.data/llm-proxy/token-usage.db | SQLite WAL DB — authoritative locally | No — untracked (*.db, .db-wal, .db-shm, .db-journal all gitignored) |
.data/llm-proxy-export/YYYY/MM/YYYY-MM-DD_HHMM-HHMM_<hash6>.json | Per-hour, per-user JSON snapshot | Yes — committed |
Why both? SQLite WAL files don't merge cleanly across machines; per-hour JSON files do. Teammates share token-usage history via git pull. Filename anatomy: the HHMM-HHMM time-window is the same one LSL uses (sourced from the health coordinator's /health/state.lsl_meta.current_window with a local fallback); the 6-char hex <hash6> is the deterministic per-user identifier exported by the proxy wrapper as LLM_PROXY_USER_HASH before exec node.
Cross-user merge contract. On every proxy boot, hydrateFromExports() walks <baseDir>/**/*.json and inserts every row with INSERT … ON CONFLICT(user_hash, id) DO NOTHING. After git pull brings down a peer's ..._<other-hash>.json file, the next proxy kickstart ingests it and the peer's rows appear in your dashboard alongside yours. Cold-start hydration is always-on (no count > 0 → return early exit) — the composite unique index supplies idempotency, not skipping.
The schema is one token_usage table:
| Column | Type | Notes |
|---|---|---|
id | INTEGER PK | Monotonic per-instance |
user_hash | TEXT NOT NULL DEFAULT 'unknown' | 6-char hex hash identifying the contributor. Together with id forms UNIQUE INDEX idx_token_usage_user_id(user_hash, id) — the cross-user merge key |
timestamp | TEXT | ISO-8601 with ms + Z |
provider | TEXT | The account that was billed — not the company. Not a fixed enum: the column has accumulated several spellings for the same account over time. A live count on this machine returns copilot, claude-code and anthropic (the older spellings) alongside gh-copilot, claude-code-max, github-copilot, and the local offload targets qwen-local / qwen-laptop. Normalise before grouping — normalizeProvider() in src/lib/providers.ts — or the same account appears as three rows. |
model | TEXT | Canonical model name (claude-haiku-4.5, claude-sonnet-5, claude-opus-5). The proxy normalizes the upstream-returned spelling at the persistence boundary via canonicalizeModelName() so the dashboard's By-Model panel doesn't fragment across 8 spellings of 3 models. |
model_raw | TEXT | The verbatim upstream spelling (Claude Sonnet 4.6, claude-sonnet-4-6, claude-haiku-4-5-20251001, bare sonnet, etc.) — preserved for forensic debugging. Never used by the UI; queryable via SELECT model_raw, COUNT(*) FROM token_usage GROUP BY model_raw. |
process | TEXT | Caller's process field; empty rows are labeled unknown |
subscription | TEXT | claude-max, github-copilot, or the API-key tier name |
input_tokens / output_tokens | INTEGER | input_tokens is fresh (uncached) prompt tokens on both wires — openAIFreshInputTokens() subtracts cached_tokens at the parse boundary so the OpenAI leg agrees with the Anthropic one |
total_tokens | INTEGER | input + output. Cache traffic is NOT included — see the two columns below, which are additive to this one. Summing total_tokens alone understates a cache-heavy session, sometimes by more than two orders of magnitude |
cache_read_tokens / cache_write_tokens | INTEGER | Prompt-cache traffic, additive to total_tokens. To display consumption, add them back — the dashboard's allTokens() helper is the canonical form |
reasoning_tokens | INTEGER | Completion tokens spent thinking before any content is emitted. A reasoning model can show few output_tokens for a long, expensive call |
latency_ms | INTEGER | Round-trip from request send to response close |
prompt_preview | TEXT | XML-wrapper-stripped prefix (first ~120 chars) |
tokens_estimated | INTEGER (0/1) | 1 when the proxy estimated tokens from text length because the provider returned 0 |
The table carries roughly thirty columns; the ones above are what the page's charts read. The rest fall into three groups worth knowing about:
| Group | Columns | Answers |
|---|---|---|
| Attribution | agent, task_id, tool_call_id, parent_call_id, granularity_tier, conversation_key, turn_index | which agent, task and turn a call belongs to |
| Routing decision | route_key, route_band, route_step, band_source, offloaded_from, chain_position, attempt_trail, routing_source | why the call went where it did — see LLM Routing |
| Timing | overhead_ms | proxy-side cost on top of latency_ms |
PRAGMA table_info(token_usage) is the authoritative list; this page is a reader's selection of it and will drift.
Manual queries
# Total tokens today
sqlite3 .data/llm-proxy/token-usage.db \
"SELECT SUM(input_tokens), SUM(output_tokens) FROM token_usage \
WHERE timestamp > datetime('now', '-24 hours')"
# Top processes by token usage
sqlite3 .data/llm-proxy/token-usage.db \
  "SELECT process, SUM(total_tokens) AS total FROM token_usage \
   GROUP BY process ORDER BY total DESC LIMIT 10"
# Provider distribution
sqlite3 .data/llm-proxy/token-usage.db \
"SELECT provider, COUNT(*), SUM(total_tokens) FROM token_usage GROUP BY provider"
Architecture
Data flow
- Cognitive processes (observation-writer, consolidator-digest/insight, wave-analysis agents, health-coordinator probes) send completion requests to the LLM Proxy Bridge (
:12435). - Each request includes a
processidentifier. If a row in/api/llm/settingshas a pin for that process, the proxy honors it; otherwise the auto-route runs. - The proxy routes to one of the five providers.
- After completion, the proxy logs the call to the SQLite DB and schedules the debounced JSON export.
- The Health Dashboard server (
server.js) reverse-proxies/api/token-usage/*and/api/llm/settingsto the proxy. - The frontend (
token-usage.tsx) renders the four tabs from the aggregated data; the Settings dialog renders the LLM Routing dropdowns from the same source.
Key files
| File | Role |
|---|---|
_work/rapid-llm-proxy/src/token-usage.ts | DB schema + idempotent user_hash / model_raw ALTER, logCall(), exportToHourFile() (per-window debounced), hydrateFromExports() (always-on recursive walk), backfillCanonicalModelNames() |
_work/rapid-llm-proxy/proxy-bridge/server.mjs | /api/token-usage/{summary,recent}, GET/PUT /api/llm/settings, canonicalizeModelName() + MODEL_CANONICAL_MAP, currentWindow() (30 s-cached fetch from /health/state with local fallback) |
_work/rapid-llm-proxy/bin/start-llm-proxy.sh | Exports LLM_PROXY_USER_HASH (from scripts/user-hash-generator.js) and LSL_TIMEZONE before exec node |
scripts/health-coordinator.js | Publishes lsl_meta.current_window (HHMM-HHMM, local-time) on /health/state — single source of truth for time-window |
scripts/migrate-token-usage-export.mjs | One-shot, --dry-run, idempotent. Used once to bucket the legacy monolithic .data/llm-proxy-export/token-usage.json into the per-hour layout. |
integrations/system-health-dashboard/src/pages/token-usage.tsx | Frontend page (tabs + Settings dialog); custom TreemapTooltip + SVG <title> fallback |
integrations/system-health-dashboard/server.js | Reverse-proxy to the proxy |
API endpoints
These are served by the proxy bridge; the dashboard's server.js proxies them through :3033.
Summary
Aggregates the trailing hours window. hours accepts an integer (e.g. 24, 168, 720) or the literal sentinel all — the latter falls back to the full retained DB and clamps the timeline start to the earliest persisted row so wide windows don't emit thousands of empty buckets. bucketMinutes is optional; when omitted, the bucket size scales with the window (2 / 10 / 30 / 120 / 360 minutes for 24h / 72h / 7d / 30d / All).
Response shape (snake_case throughout, dashboard reads it directly):
{
  "hours": 168,
  "bucket_minutes": 30,
  "total_calls": 2615,
  "total_input": 3920000,
  "total_output": 336000,
  "total_tokens": 4256000,
  "avg_latency_ms": 5830,
  "by_provider":     [{ "provider": "copilot",     "calls": 2250, "input_tokens": …, "output_tokens": …, "total_tokens": … }],
  "by_process":      [{ "process":  "observation-writer", "calls": 1280, "input_tokens": …, "output_tokens": …, "total_tokens": …, "avg_latency": … }],
  "by_model":        [{ "model":    "claude-sonnet-4.6", "calls": …, "total_tokens": … }],
  "by_subscription": [{ "subscription": "claude-max",    "calls": …, "total_tokens": … }],
  "by_hour":         [{ "hour": "2026-05-15T18:00:00.000Z", "input_tokens": 12400, "output_tokens": 860, "calls": 4 }],

  // Stacked series for the Evolution tab — pivoted so recharts can stack
  // columns directly (one row per bucket, one column per process / model).
  // `process_keys` / `model_keys` give the column order ranked by total
  // tokens descending.
  "process_keys":    ["observation-writer", "consolidator-insight", …],
  "model_keys":      ["claude-sonnet-4.6", "claude-haiku-4.5", …],
  "by_process_hour": [{ "hour": "2026-05-15T18:00:00.000Z", "observation-writer": 12400, "consolidator-insight": 0, … }],
  "by_model_hour":   [{ "hour": "2026-05-15T18:00:00.000Z", "claude-sonnet-4.6": 12400, "claude-haiku-4.5": 0, … }]
}
Recent
[
  {
    "id": 18342,
    "timestamp": "2026-05-15T19:24:01.412Z",
    "process": "observation-writer",
    "provider": "copilot",
    "model": "claude-sonnet-4.6",
    "input_tokens": 2700,
    "output_tokens": 142,
    "latency_ms": 5100,
    "prompt_preview": "coding # Session Logs (/sl) — Session Continuity Command Load and …"
  }
]
LLM routing settings
Returns current pins plus reference data so the dialog can populate dropdowns without a second request:
{
  "settings": {
    "observation-writer": { "provider": "copilot", "model": "claude-sonnet-4.6" }
  },
  "processes": ["observation-writer", "consolidator-digest", "health-coordinator", "..."],
  "availableProviders": ["claude-code", "copilot"],
  "allProviders": ["claude-code", "copilot", "openai", "groq", "anthropic"]
}
Replaces the entire pin map atomically; the proxy persists the document to .data/llm-proxy/settings.json.
Cognitive process reference
| Process ID | System | Description |
|---|---|---|
observation-writer | Online Learning | Classifies and summarizes session events |
consolidator-digest | Online Learning | Synthesizes daily digests from raw observations |
consolidator-insight | Online Learning | Synthesizes insights from digests |
insight-generator | Wave Analysis | Generates entity insight documents |
content-validator | Wave Analysis | Validates and refreshes entity content |
wave1-analysis | Wave Analysis | Batch code analysis agents |
reap-test / reap-final / reap2 / reap-completes / reap-positive / reap-test-isolated | Reaper test harness | Synthetic processes used by the reap-on-disconnect integration tests |
constraint-check | Constraints | Evaluates semantic constraint rules |
health-coordinator | Health Monitor | Liveness probe — minimal token count, high call frequency |
test / test-process / export-test / unknown | — | Diagnostic or untagged callers |
A process of unknown means the caller did not send a process field. These rows are kept (they still consume tokens) but they should be eliminated by patching the caller — unknown is not a useful name in the Settings dialog.
Troubleshooting
No data showing
- Verify the proxy bridge is up:
curl http://localhost:12435/health | jq - Check the DB exists and has rows:
sqlite3 .data/llm-proxy/token-usage.db 'SELECT COUNT(*) FROM token_usage' - Verify the proxy summary endpoint responds (the frontend hits it directly):
curl 'http://localhost:12435/api/token-usage/summary?hours=1' | jq '{total_calls, total_tokens, bucket_minutes}'
Refresh button stays busy
Watch the dashboard server logs: docker logs coding-services 2>&1 | grep token-usage. The button uses a fetch promise — if the proxy hangs (long-running CLI subprocess, etc.), the button stays in its busy state until the request times out or the proxy returns.
"Unknown" rows in the table
Calls showing process: "unknown" come from callers that haven't been updated to pass a process identifier. The proxy bridge health checks used to show as unknown too — those have been retagged as health-coordinator. If you still see unknown rows after a fresh window, trace the call site with: grep -r '"process"' integrations/ scripts/ observations/ | grep -v '\.test'.
Token counts showing 0
Some providers (particularly Copilot) don't always return token counts in the response body. The proxy estimates tokens from prompt/response text length (~4 chars per token) and sets tokens_estimated = 1 so you can tell estimated from authoritative rows in a manual query.
Related documentation
- LLM Architecture — provider routing, subscriptions, fallback chains
- Health Monitoring — system health dashboard overview
- LLM CLI Proxy — the consumer-side view of the proxy
- Observational Memory — online learning pipeline