Health Monitoring
One process owns the live health state. Everything else either reports into it or reads from it — which is what makes the dashboard, the status line and the hooks agree.
The shape of it
A single health coordinator on :3034 holds the truth. Reporters POST signals to it; consumers GET state from it. There is exactly one writer.
reporters  ──POST──▶  coordinator :3034  ──GET──▶  consumers
(ETM, probes)         /health/state              (status line,
                                                  dashboard, hooks)
Checking health
The dashboard renders the same state at localhost:3032.
Two things that look like bugs and are not
A grey health badge means the coordinator is unreachable, not that a service is down — the reader has nothing to read.
A stale badge (state older than 180s) means the writer stopped, not that the services stopped. Check the coordinator before checking what it reports on.
When something is genuinely stuck
A wedged process does not die: ps shows it alive while it has stopped doing work. That is why the coordinator marks a reporter stopped after 15 seconds without a heartbeat, rather than trusting that the process exists.
Why one writer
Health state used to be assembled from several files written by several processes, which meant the dashboard and the status line could disagree and neither was wrong. Now health-coordinator.js is the only writer of /health/state, and every surface reads that one document. When two surfaces disagree today, the disagreement is itself the diagnosis: something is reading a cached copy.
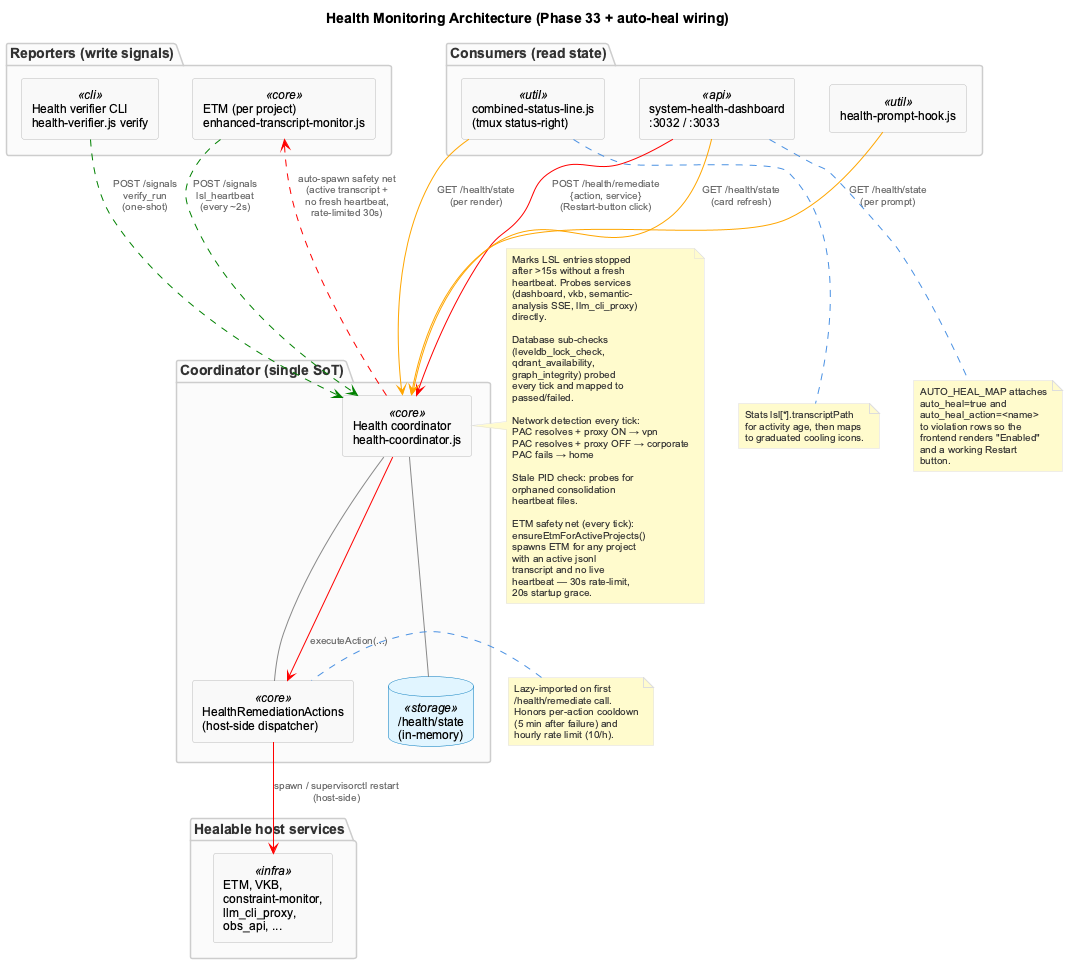
Who reports, who reads
| Role | Process | Runs |
|---|---|---|
| Coordinator | health-coordinator.js | In the services container, port 3034 |
| Session monitor | enhanced-transcript-monitor.js | On the host, one per project |
| Status line | combined-status-line.js | On the host, re-rendered every 5s |
| Dashboard | the dashboard server | In the container, ports 3032/3033 |
| Verifier | health-verifier.js | On the host, one-shot CLI — not a daemon |
What the state document promises
- One writer. No other process writes it.
- Liveness is derived from heartbeats, not from process existence. A session monitor is marked
stoppedafter 15 seconds without a fresh heartbeat, which is what catches a process that is alive but wedged. - Database sub-checks — LevelDB lock, Qdrant availability, graph integrity — are probed every tick and reported individually rather than as one opaque "databases: ok".
- Network location is detected independently of proxy state, from three signals: the VPN CLI, active
utuninterfaces, and internal DNS with a latency measurement. Conflating the two is how "am I on the VPN?" and "is the proxy working?" became the same question. generated_atmoves every tick, so consumers can detect staleness rather than trusting a document that stopped updating.
Reading the status line
Health, session-logging and knowledge-pipeline state all surface in the tmux bar. Two conventions worth knowing: red is reserved for the observations API being unreachable, and knowledge-pipeline staleness fades progressively rather than turning red, so "getting old" and "broken" do not look the same.
What restarts itself
Two independent paths, deliberately:
- Proactive — the coordinator notices a service is down and restarts it, as a safety net that needs nobody watching.
- Reactive — a restart button in the dashboard, for when you have decided something needs bouncing.
Between them, most failures resolve without intervention; the dashboard's history shows what was restarted and when.
Diagnosing
| Symptom | Look at |
|---|---|
| Grey health badge | The coordinator itself — it is unreachable |
| Stale badge (>180s) | The coordinator's writer, not the services |
| A project missing from the status line | Whether that project has a session monitor at all |
| Session logging stalled | The per-project log under .logs/, for a stalled loop |
| A project green while idle for hours | Session-activity lifecycle, below in Deep Dive |
For a wedged process, sample it rather than checking whether it exists — the whole point of the heartbeat design is that existence proves nothing.
Coordinator-centric health architecture (Phase 33). One process — the health coordinator at :3034 — owns the live health state. Reporters POST signals, consumers (statusline, dashboard, prompt hooks) GET state. There is no longer a host-side health-verifier daemon, no .health/verification-status.json file, and no .logs/statusline-health-status.txt rollup.
Roles
| Role | Process | Where it runs | Lifecycle |
|---|---|---|---|
| Coordinator | health-coordinator.js | inside coding-services container, port 3034 (host-mapped) | supervisord-managed; coding-services healthcheck flips on failure |
| ETM | enhanced-transcript-monitor.js | host (one per project) | spawned by claude-mcp launcher / agent-common-setup.sh |
| Statusline producer | combined-status-line.js | host (per render) | tmux re-invokes via wrapper every 5 s |
| Statusline cache reader | combined-status-line-wrapper.js | host (per render) | same |
| Health verifier | health-verifier.js | host (CLI, one-shot) | invoked manually or from a scheduler — no daemon |
| Dashboard | system-health-dashboard/server.js | inside container, ports 3032/3033 | supervisord-managed |
Coordinator: source of truth
Endpoint: GET http://localhost:3034/health/state
{
  "container": { "healthcheck": "healthy", "last_probe_end": "..." },
  "services": [
    { "name": "enhanced_transcript_monitor", "status": "running", "derived_from": "lsl_heartbeats" },
    { "name": "dashboard_server", "status": "running", "latency_ms": 1 }
  ],
  "lsl": {
    "etm-87152-1778236220322:coding": {
      "status": "running",
      "lastBeat": 1778237165511,
      "sessionId": "etm-87152-1778236220322",
      "projectName": "coding",
      "transcriptPath": "/Users/.../coding/9e40cccd-....jsonl",
      "tmuxPane": null,
      "source": "enhanced-transcript-monitor"
    }
  },
  "lsl_by_project": { "coding": "healthy", "rapid-automations": "healthy" },
  "processes": [],
  "databases": { "status": "healthy", "levelDB": {}, "qdrant": {}, "leveldb_lock_check": "passed", "qdrant_availability": "passed", "graph_integrity": "passed" },
  "network": { "internet_reachable": true, "location": "vpn", "vpn_cli": true, "utun_detected": true, "dns_internal_ok": true },
  "proxy": { "state": "on", "user_enabled": true, "connect_ok": true },
  "files": [],
  "generated_at": "..."
}
SoT promises:
- One writer (
health-coordinator.js); no other process writes to/health/state. - LSL entries are marked
status=stoppedautomatically after >15 s without a freshlsl_heartbeatfrom their reporter. - ETM service status is derived from
lsl_heartbeats— there is noservice_statussignal kind for ETM. Other services are probed directly by the coordinator. - Database sub-checks (
leveldb_lock_check,qdrant_availability,graph_integrity) are probed on every coordinator tick and mapped topassed/failed. The dashboard'stoUiStatus()function maps these to UI-friendly states. - Network environment (
network.location:vpn/corporate/home) is detected every tick via a 3-signal approach: (1) Cisco VPN CLI — queriesvpn statusfor tunnel state, (2) utun interface detection — checks for activeutun*interfaces viaifconfig, (3) BMW internal DNS + latency — resolves an internal hostname and measures round-trip. Network location is fully decoupled from proxy state. - Process checks (
stale_pids) actively probe for orphaned consolidation heartbeat files; placeholder rules without implementations (process_uptime,high_cpu_usage,memory_usage,disk_usage) are disabled. generated_atis updated on every state refresh; consumers use it for staleness detection (>180 sis a[🏥⏰]stale badge). Knowledge pipeline staleness uses graduated fading (matching the session activity lifecycle icons) rather than red for stalled state; red is reserved exclusively forobs_apiunreachable.
Reporters
ETM (per project)
scripts/enhanced-transcript-monitor.js — one per project, host-side. Heartbeats every poll cycle (~2 s):
POST /signals
{
  "kind": "lsl_heartbeat",
  "session_id": "<from CLAUDE_SESSION_ID env>",
  "source": "enhanced-transcript-monitor",
  "status": "running" | "degraded",
  "payload": {
    "projectPath": "...",
    "transcriptPath": "...",
    "exchangeCount": 42,
    "tmux_pane": "<TMUX_PANE or null>"
  },
  "ts": 1778237165511
}
status: 'degraded' is set when isSuspiciousActivity fires (0 exchanges processed in >30 min uptime — pipeline alive but stalled). Statusline maps this to a bold amber ● (ALARM_DOTS.WARN), rendered as [LSL●]; a stopped ETM gives the bold red [LSL●] (ALARM_DOTS.CRIT).
A third verdict, starting, renders a grey ● (STATE_DOTS.IDLE) and deliberately does NOT set the line's overall colour: no entry yet, but this tmux session is less than 60 s old. It exists because closing a session reaps its ETM within one 5 s tick while the respawn was gated by ETM_SPAWN_INTERVAL_MS = 30_000, so every freshly opened session opened on a red badge for up to thirty seconds. Launchers now POST an etm_ensure signal to :3034/signals naming their project; a targeted request bypasses that gate (and the coordinator startup grace) for that project only, without advancing the shared rate-limit clock the untargeted sweep uses. Measured: 106 ms from signal to spawn. Session age comes from .data/agent-sessions/<tmux-session>.json; an unknown age falls back to "old", so a genuinely failed launch still goes red.
The ETM also writes per-project LSL files to .coding/history/YYYY/MM/YYYY-MM-DD_HHMM-HHMM_<hash>.jsonl and posts observation summaries to the proxy.
Host path resolution: ETM uses a resolveHostCodingPath() helper at script init that prefers /Users/-style values from CODING_REPO / CODING_TOOLS_PATH and falls back to __dirname/... This avoids the claude-mcp launcher's CODING_TOOLS_PATH=/coding (in-container path) leaking into the host-side ETM and breaking redactor config / .health mkdir.
Health verifier (one-shot CLI)
scripts/health-verifier.js is reporter-mode only since plan 33-04. Subcommands:
| Command | Effect |
|---|---|
verify | Run database/service/process/file checks; POST a verify_run signal to the coordinator; exit 0/1 |
status | GET /health/state from coordinator; print compact summary |
report | GET /health/state from coordinator; print verbose (or --json) |
The start daemon subcommand was removed when the coordinator took over lifecycle. The supervisord [program:health-verifier] block was likewise retired (the program ran health-verifier.js start which now exits with "Unknown command: start"; it was kept with autostart=false as a transitional shim until commit 58e968e45 removed it entirely).
Multi-tier proxy semantic probe (3b)
The health coordinator probes the LLM proxy on a 60s cadence to drive the [🧠] statusline badge. Since 2026-05-19 this is a two-probe scheme — the original single probe was misleading because it only checked the cheapest path, leaving the badge green while the actually-configured semantic pipeline silently broke.
| Probe | Function | Path | Purpose | Drives auto-heal FSM? |
|---|---|---|---|---|
| Cheap | pollProxySemantic | POST /api/complete with provider: 'copilot', tier: 'haiku', maxTokens: 5 | "Is the proxy reachable on at least one path?" | Yes — sustained failures trigger restart_llm_cli_proxy. |
| Strong | pollProxySemanticStrong | POST /api/complete with process: 'observation-writer' (no explicit provider/model — let processOverrides choose) | "Can the actually-configured semantic pipeline complete a call?" | No — an Anthropic 429 on sonnet is not a proxy outage; restarting wouldn't help. |
State surface (under state.proxy at /health/state):
{
  "proxy": {
    "semantic_ok": true,                          // cheap probe
    "last_round_trip_ms": 925,
    "reason": null,
    "semantic_strong_ok": true,                   // 3b strong probe
    "semantic_strong_round_trip_ms": 8253,
    "semantic_strong_reason": null,
    "auto_heal_status": "healthy"
  }
}
Statusline mapping (combined-status-line.js):
semantic_ok | semantic_strong_ok | Badge | Meaning |
|---|---|---|---|
true | true | [🧠●] green | Both probes pass. |
true | false | [🧠⚠️] (amber) | Cheap path fine, configured pipeline silently broken (typical example: observation-writer pinned to claude-code/sonnet, Anthropic 429 + no working fallback). |
false | any | [🧠●] red / [🧠●] amber per existing rules | Proxy itself is unreachable; auto-heal FSM engages. |
null | any | [🧠❓] | Pre-first-probe. |
The strong probe runs fire-and-forget with a 30s timeout — the CLI-fallback path through claude-code/sonnet currently takes ~14s end-to-end, and we don't want the strong probe serializing the coordinator's tick loop. Errors are caught and write to semantic_strong_reason for diagnostics.
Proxy detection (user-intent model)
Proxy state combines daemon truth with user intent (since 2026-07-26). The px toggle sets/unsets http_proxy/https_proxy shell env vars and is reported as proxy_enabled_by_user; the proxydetox daemon itself stays loaded on :3128 regardless (always-on redesign, 2026-07-25) and is reported as proxy_running/proxy_functional.
| State | Meaning |
|---|---|
P:ON | Daemon running + functional AND user enabled proxy (px on) |
P:AUTO | Daemon running + functional, user toggle off — adaptive --direct-fallback routing |
P:OFF | Daemon down or not functional (only genuinely broken state) |
Violations
The /health/state report endpoint includes proxy and semantic_readiness violations alongside other violation categories. This fixes a previous data inconsistency where the status endpoint counted violations that were not present in the report output.
Consumers
Statusline (combined-status-line.js)
- Pulls
/health/stateonce per render. - Maps
lsl_by_project[*]rollup → 3-state (healthy/degraded/stopped). - For each
healthyproject, reads the newest timestamped record in the correspondinglsl[*].transcriptPath(bounded tail read — NOT the file mtime, which timestamp-less bookkeeping records keep artificially fresh on any open session) to compute user-activity age and bucket into the lifecycle (bright green → mid green → dark green → very dark green → grey). - Synthesizes "verifier-shape" fields for the
[🏥...]badge from coordinator services + databases + container healthcheck — no.health/verification-status.jsonread.
Dashboard (integrations/system-health-dashboard)
- Backend (
server.js) at port 3033 reads coordinator state and exposes per-card APIs. - Frontend at port 3032 polls the API.
- Supervisord process panel reads supervisorctl directly inside the container (the coordinator does not surface raw supervisord state).
- The
cgr_cachetile reads.data/graphify/metadata.json(graphify's commit sidecar) via Node fs and computes commits-behind viagit rev-listagainst the graph'sbuilt_at_commit.
Health prompt hook (scripts/health-prompt-hook.js)
- Runs on every prompt submit.
- Reads
/health/stateand surfaces a one-line health summary to the prompt. - Trusts the coordinator's
overallStatus— does not re-classify based on accepted/non-critical violations.
Session activity lifecycle
The graduated cooling scale is a single-cell ● tinted along a green ramp, defined as LIFECYCLE_ICONS in scripts/combined-status-line.js. It is NOT an emoji ladder: an earlier 🟢/🟠/🟤/⚫/💤 set was retired because only one green emoji exists, and the multi-byte icons made tmux and the terminal renderer disagree on cell width, leaving trailing residue at the right edge of status-right.
| Glyph | tmux colour | Status | Time since last activity |
|---|---|---|---|
| ● bright green | colour41 | Active | < 5 min |
| ● mid green | colour34 | Cooling | 5 – 30 min |
| ● dark green | colour28 | Fading | 30 min – 6 h |
| ● very dark green | colour22 | Inactive | 6 – 24 h |
| ● grey | colour238 | Sleeping | ≥ 24 h |
A project idle for more than a day therefore renders as a grey dot — visibly off the green ramp, not as a 💤 glyph.
Unhealthy states are NOT on this ramp at all. They are ALARM_DOTS — the same one-cell ●, but bold:
| Glyph | tmux style | Meaning |
|---|---|---|
| ● bold amber | colour214,bold | ETM degraded / stale (ALARM_DOTS.WARN) |
| ● bold red | colour196,bold | ETM stopped or unreachable (ALARM_DOTS.CRIT) |
Bold is load-bearing, not decoration: every ramp shade is dim and un-bolded, so a bold dot is the only high-intensity mark on a line of eight dots. That is what preserves the "an alarm must break the pattern" property after the alarms stopped being emoji.
A session's status is derived from the coordinator rollup and the alarm dot chosen from it — never the reverse. Inferring status by comparing the rendered glyph back against a literal (icon === '🟡') made the glyph the source of truth, so a presentation change silently reclassified every session as healthy.
The thresholds match the status-line guide. The user-activity age is computed client-side from the newest timestamped record in lsl[*].transcriptPath — deliberately not the file mtime, which timestamp-less bookkeeping records keep artificially fresh on any open session — since the coordinator's 3-state lsl_by_project rollup (healthy/degraded/stopped) does not surface age at all.
Bind-mount staleness supervision
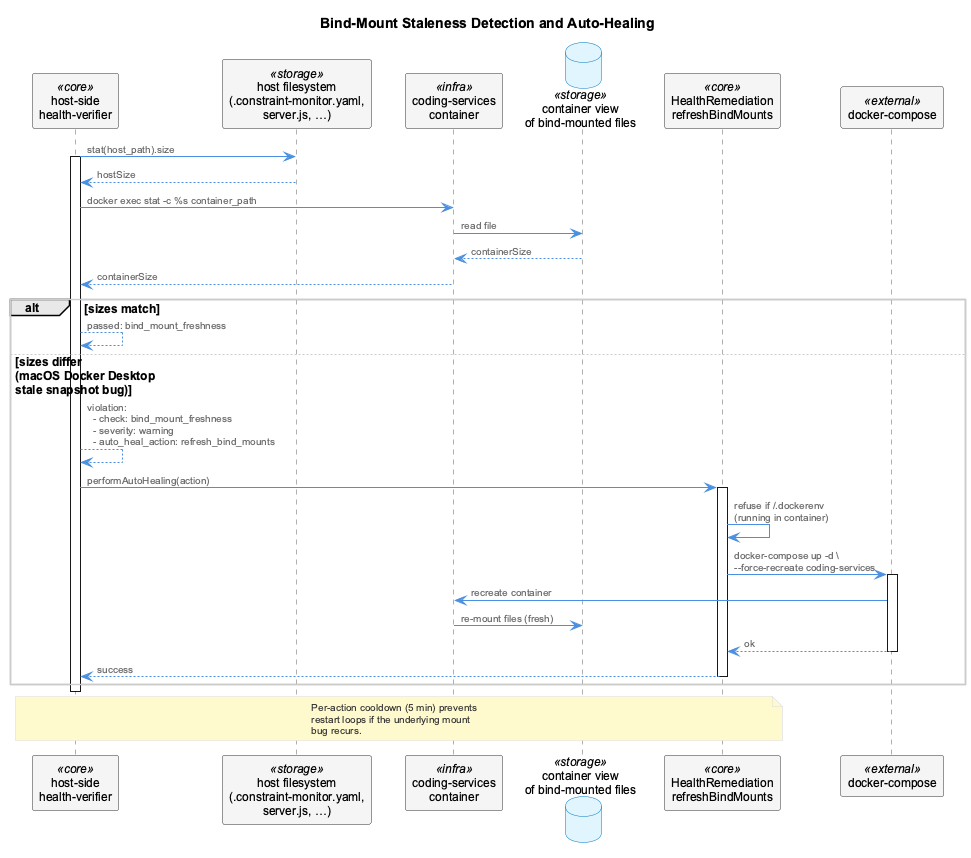
macOS Docker Desktop occasionally caches single-file bind-mounts at mount time and stops reflecting later host edits — the symptom is that the container sees a truncated/older copy while the host has the current content, silently breaking YAML/JSON loaders inside the container.
The verifier compares host stat vs docker exec stat for each bind-mounted file in coding-services:
| Watched file | Why |
|---|---|
config/constraints/constraint-monitor.yaml | Constraint config — directory-mounted (a single-file mount goes stale on replace) |
integrations/system-health-dashboard/server.js | Dashboard code — drift causes startup failures |
scripts/consolidate-observations.js | Consolidator CLI — drift desyncs heartbeat schema |
When sizes diverge, the verifier raises a bind_mount_freshness violation. Remediation is operator-driven (docker-compose restart coding-services is enough to invalidate the FUSE cache; --force-recreate is needed only if the volume mapping itself changed). This particular check has no auto-heal hook because container recreation is too disruptive to dispatch automatically — see Auto-healing below for the services that do self-heal.
Health dashboard
Frontend: http://localhost:3032 API: http://localhost:3033
Cards
| Card | Source |
|---|---|
| Databases (LevelDB / Qdrant / CGR Cache) | coordinator databases sub-checks (leveldb_lock_check, qdrant_availability, graph_integrity) + dashboard cgr_cache synthesis |
| Services (VKB / Constraint Monitor / Dashboard / Semantic Analysis SSE) | coordinator services |
| Processes (Process Registry / Stale PIDs) | coordinator processes.stale_pids (probes for orphaned heartbeat files) |
| UKB Workflows (status / capacity / history) | semantic-analysis SSE server (:3848) |
| LLM Proxy Health (Internet / Proxy / Network location) | coordinator network (3-signal VPN detection, internet reachability) + coordinator proxy (user-intent proxy state) |
| Service Detail (Port Liveness / Supervisord Processes) | dashboard server probes ports + queries supervisorctl |
Key API endpoints
| Endpoint | Description |
|---|---|
/api/health | Dashboard's own self-healthcheck (not the coordinator rollup) |
/api/cgr/freshness | Graph freshness; compares graph.json built_at_commit vs HEAD |
/api/health-verifier/status | Pass-through to coordinator /health/state |
/api/health-verifier/report | Same, verbose |
/api/ukb/* | UKB workflow control + history |
Observation cold storage (Phase 35)
The observations DB is bounded — older-than-retention rows are pruned from SQLite by a 1-hour in-process job (ObservationPruner) so queries stay fast on a growing corpus. But the dashboard still needs to surface old rows when an operator scrolls back, so the JSON export (.data/observation-export/*.json — the same files we already commit for cross-machine sync) is the second tier of the same store. SQLite is the hot tier; the JSON snapshots are the cold tier; queries that span the boundary go through a pure merge helper.
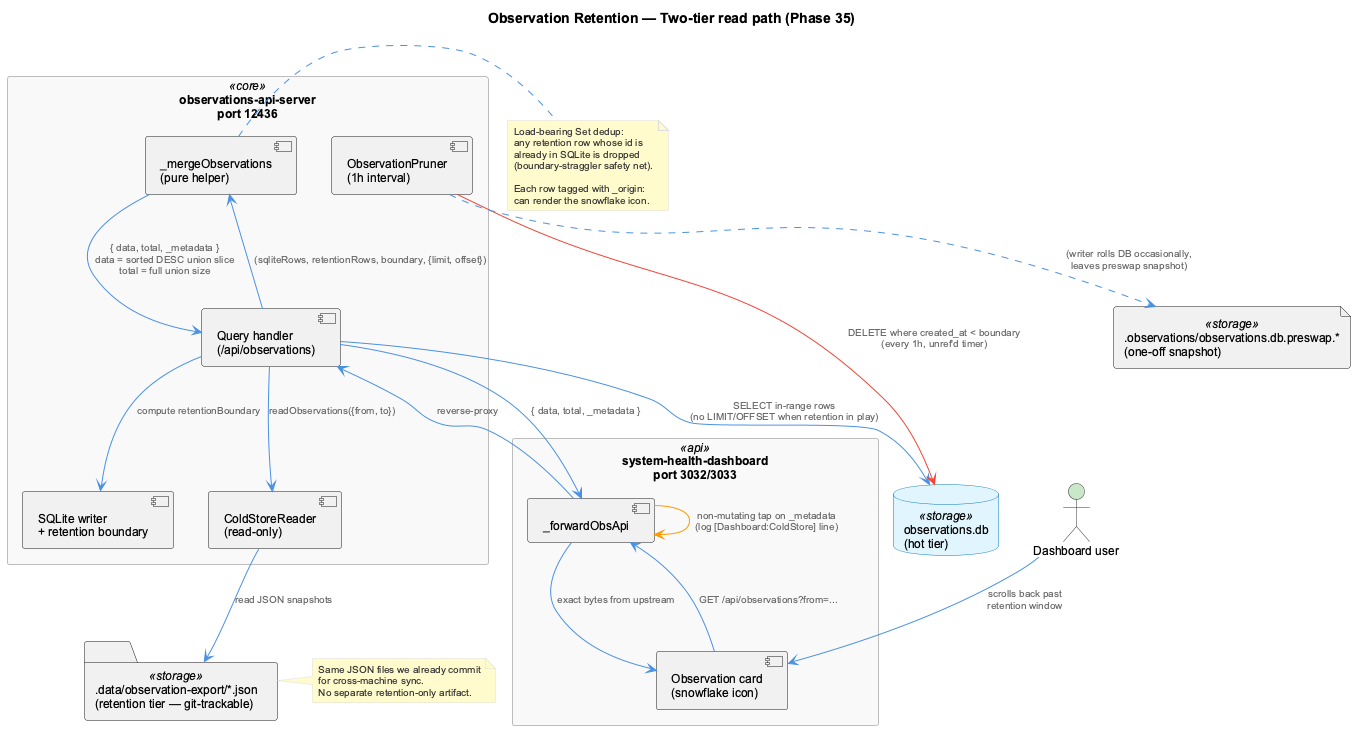
Components
| File | Role |
|---|---|
scripts/observations-api-server.mjs | Hosts both tiers in-process: holds the SQLite writer, schedules the pruner, lazy-inits ColdStoreReader |
ObservationPruner.prune() | DELETEs rows where created_at < now - retentionDays. First prune fires immediately on init; subsequent prunes every 1 h via setInterval(...).unref() so the timer never holds the process open. |
ColdStoreReader | Read-only reader for .data/observation-export/*.json. Defaults to <repo>/.data/observation-export. |
scripts/observations-api-merge.mjs | Pure (side-effect-free) merge helpers — lives in its own file so the Jest integration test can import them without dragging in the obs-api server's transitive deps. |
integrations/system-health-dashboard/server.js: _forwardObsApi | Reverse-proxies obs-api requests on dashboard port 3033 and non-mutatively taps _metadata.fromColdStore on the response to emit a [Dashboard:ColdStore] stderr line. The response body is not re-stringified — bytes flow through unchanged. |
Retention boundary
_computeRetentionBoundary(db, retentionDays) returns an ISO-8601 UTC cutoff. SQLite holds anything with created_at >= boundary; cold-store holds anything strictly older. The boundary is computed via SELECT datetime('now', '-N days') inside SQLite so it stays consistent with the DB's notion of "now," then normalized through new Date(...).toISOString() so byte-for-byte string comparison against cold-row createdAt (full ISO with ms + Z) lines up.
Full-union pagination (Phase 35-07)
When a query's from timestamp reaches past the retention boundary, the server:
- Fetches the full SQLite-in-range slice (no
LIMIT/OFFSET) - Reads the full cold-in-range rows from
ColdStoreReader - Hands both to
_mergeObservations(sqliteRows, coldRows, retentionBoundary, { limit, offset })
The merge helper then:
- Filters cold rows to strictly
< retentionBoundary - Builds a
Setof SQLite ids — load-bearing safety net against any straggler from the cold tier whosecreatedAthappens to land on the boundary - Tags each row with
_origin: 'sqlite' | 'cold'so the frontend can render a snowflake icon (see Health Dashboard) - Sorts the dedup'd union by
timestamp DESC - Slices to
[offset, offset + limit) - Returns
{ data, total: <union size>, _metadata: { fromColdStore, sqliteRows, coldRows, retentionBoundary } }
total is the size of the dedup'd union — pagination walks across both tiers, not just the hot one. Cold rows can appear on any page, not only the first. The _metadata.coldOnFirstPageOnly field is retained for back-compat with frontends that may still read it but is always false under this contract.
Why a separate merge module
The merge helpers live in observations-api-merge.mjs rather than inside the server so the Jest integration tests (tests/scripts/observations-api-server.merge.test.js) can import them directly. The server module's transitive dependency graph includes RetrievalService → embedding-service.js (a TS dist file), which the Jest moduleNameMapper cannot resolve at test time.
Operator surface
[Dashboard:ColdStore]stderr line — one per request that served cold rows; reports<path> served <coldRows> cold + <sqliteRows> sqlite (boundary=<ISO>)- Snowflake icon (
lucide-reactSnowflake, sky-400/80) on every observation card and digest row whose_origin === 'cold' - Pre-swap snapshot — historical: when the writer rolled SQLite, it left
.observations/observations.db.preswap.<YYYYMMDD-HHMMSS>as a one-off safety copy. As of 2026-06-05 (Phase 44 Plan 18), the SQLite file has been archived to.observations/observations.db.archived.2026-06-05and is no longer the runtime store; the writer is km-core-native and no longer produces pre-swap snapshots.
Auto-healing
Two complementary paths bring failed services back without operator action:
1. Coordinator-driven safety net (proactive)
ensureEtmForActiveProjects() runs on every coordinator tick. It walks the projects under ~/Agentic/, checks each for an actively-written Claude transcript (*.jsonl mtime within the last 2 min), and spawns an enhanced-transcript-monitor for any project that is active but has no fresh heartbeat in the coordinator's lsl map. Rate-limited to one sweep per 30 s with a startup grace of ~20 s so existing ETMs (started before the coordinator) get a chance to register first. This closes the gap left when Phase 33 retired GlobalLSLCoordinator — sessions launched outside bin/coding (VS Code Claude extension, manual node invocations, agent worktrees) are now picked up automatically.
2. Dashboard-driven restart click (reactive)
The dashboard violations table renders an "Enabled" badge + Restart button on any row whose service has an entry in the dashboard's AUTO_HEAL_MAP (integrations/system-health-dashboard/server.js). Clicking the button POSTs to coordinator :3034 /health/remediate { action, service }. The coordinator lazy-imports HealthRemediationActions and dispatches via executeAction(actionName, details), then triggers an immediate forceTick() so the next dashboard poll reflects the new state.
The proxy hop is necessary because the dashboard runs inside the coding-services container, which cannot reach host-side processes (ETM, vkb, etc.) via supervisorctl — the coordinator runs natively and can.
| Service | Action | Handler |
|---|---|---|
enhanced_transcript_monitor | restart_transcript_monitor | restartTranscriptMonitor() |
vkb_server | restart_vkb_server | restartVkbServer() |
constraint_monitor | restart_constraint_monitor | restartConstraintMonitor() |
dashboard_server, health_dashboard_* | restart_dashboard_server / restart_health_* | corresponding handlers |
llm_cli_proxy | restart_llm_cli_proxy | restartLLMCLIProxy() |
obs_api | restart_obs_api | restartObsApi() — runs scripts/restart-obs-api.mjs on the host |
If the coordinator proxy fails (network or coordinator down) the dashboard falls back to the legacy local restartCommands map (supervisorctl inside the container, npm/bin paths on host), so a coordinator outage does not strand the Restart button.
HealthRemediationActions enforces a per-action 5-min cooldown on failure and a 10-attempt-per-hour ceiling, preventing spawn storms when an underlying issue keeps killing the restarted process.
Retired components (do not write/read)
| Component | Removed in | Replacement |
|---|---|---|
Host-side health-verifier daemon (start subcommand) | Plan 33-04 | Coordinator :3034 |
[program:health-verifier] supervisord block | Commit 58e968e45 | n/a |
[program:browser-access] supervisord block | Commit 1cd72cd2b | /gsd-browser (Playwright via CLI) |
.health/verification-status.json | Plan 33-04 | Coordinator /health/state |
.logs/statusline-health-status.txt | Plan 33-04 | Coordinator lsl_by_project |
.lsl/global-registry.json | Plan 33-04 | Coordinator lsl map |
GlobalProcessSupervisor daemon | Plan 33-04 | Coordinator + supervisord |
GlobalLSLCoordinator daemon | Plan 33-04 | Coordinator + per-launcher ETM spawn |
StatusLineHealthMonitor daemon | Plan 33-04 | On-demand render in combined-status-line.js |
Troubleshooting
Coordinator unreachable / [🏥●] grey
# Is the container up?
docker ps --format '{{.Names}} {{.Status}}' | grep coding-services

# Is the coordinator port mapped?
lsof -nP -iTCP:3034 -sTCP:LISTEN

# Direct probe
curl -fs http://localhost:3034/health/state | jq '.generated_at'
LSL pipeline stalled (no new files / no observations)
The most common cause is the ETM hitting an init error after which a half-baked redactor singleton blocks all subsequent transcript processing. Symptoms: ETMs are alive and heartbeating (status=running) but exchangeCount=0 for hours and no LSL files / observations appear.
# ETM log for redactor / ENOENT errors
tail -100 transcript-monitor.log | grep -iE 'not initialized|enoent.*\.health|enoent.*redaction'

# If the env has CODING_TOOLS_PATH=/coding (the in-container path), the host-side
# resolver in enhanced-transcript-monitor.js should reject it and fall back to
# __dirname/.. — verify the fix is in place:
grep -n 'resolveHostCodingPath' scripts/enhanced-transcript-monitor.js

# Restart with a clean env:
pkill -f 'enhanced-transcript-monitor.js.*coding'
nohup env -i HOME=$HOME PATH=$PATH \
  CODING_REPO="$PWD" \
  node scripts/enhanced-transcript-monitor.js "$PWD" \
  >> .logs/etm-coding.log 2>&1 &
Status line shows residual chars (12:411, 13:0656)
See Status Line / Right-edge stability — verify the wrapper preserves trailing whitespace and the producer pads to ≥220 codepoints + NBSP terminator.
Project shows 🟢 despite hours idle
The cooling lifecycle depends on transcriptPath mtime. If the project shows 🟢 but should be ⚫, either the transcript path is wrong or the file isn't being read:
# Coordinator's transcriptPath for the project
curl -fs http://localhost:3034/health/state \
  | jq '.lsl | to_entries[] | select(.value.projectName=="rapid-automations")'

# Is that file actually on disk and being updated?
stat /Users/.../target.jsonl

# Force a fresh statusline render
rm -f .logs/combined-status-line-cache-*.txt
node scripts/combined-status-line.js